| Tabulation of Results | ||
| Learning2 x Happiness2 | ||
| HI | LO | HI | 53 | 30 | LO | 50 | 29 |
| Tabulation of Expected Results | ||
| Learning2 x Happiness2 | ||
| HI | LO | HI | 52.77 | 30.23 | LO | 50.23 | 28.77 |
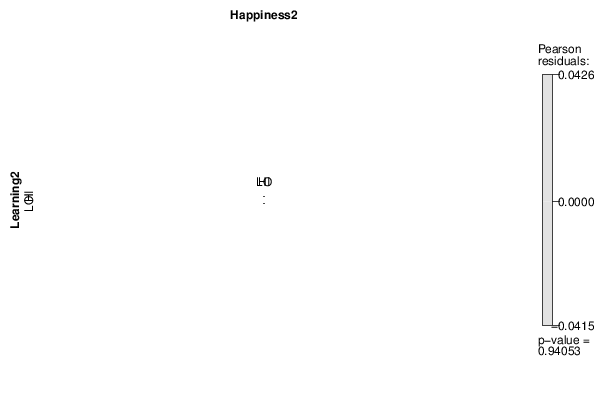
| Statistical Results | |
| Pearson's Chi-squared test with simulated p-value (based on 2000 replicates) | |
| Exact Pearson Chi Square Statistic | 0.01 |
| P value | 1 |