| Tabulation of Results | ||
| Learning2 x Depression2 | ||
| HI | LO | HI | 43 | 40 | LO | 57 | 22 |
| Tabulation of Expected Results | ||
| Learning2 x Depression2 | ||
| HI | LO | HI | 51.23 | 31.77 | LO | 48.77 | 30.23 |
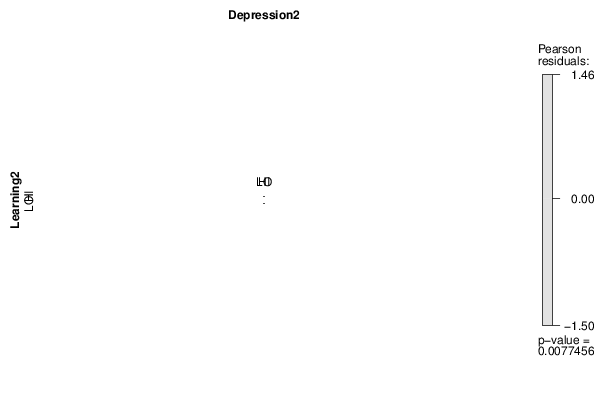
| Statistical Results | |
| Pearson's Chi-squared test with simulated p-value (based on 2000 replicates) | |
| Exact Pearson Chi Square Statistic | 7.09 |
| P value | 0.01 |