| Multiple Linear Regression - Estimated Regression Equation |
| V1[t] = + 4.56113 -12.2915V2[t] + 0.0249683V3[t] + 46.7043V4[t] + 11.4732V5[t] + e[t] |
| Multiple Linear Regression - Ordinary Least Squares | |||||
| Variable | Parameter | S.D. | T-STAT H0: parameter = 0 | 2-tail p-value | 1-tail p-value |
| (Intercept) | 4.56113 | 14.9477 | 0.3051 | 0.761553 | 0.380776 |
| V2 | -12.2915 | 9.77056 | -1.258 | 0.21435 | 0.107175 |
| V3 | 0.0249683 | 0.101644 | 0.2456 | 0.806984 | 0.403492 |
| V4 | 46.7043 | 15.5934 | 2.995 | 0.00429341 | 0.00214671 |
| V5 | 11.4732 | 7.83009 | 1.465 | 0.149236 | 0.074618 |
| Multiple Linear Regression - Regression Statistics | |
| Multiple R | 0.464044 |
| R-squared | 0.215337 |
| Adjusted R-squared | 0.151283 |
| F-TEST (value) | 3.3618 |
| F-TEST (DF numerator) | 4 |
| F-TEST (DF denominator) | 49 |
| p-value | 0.0164969 |
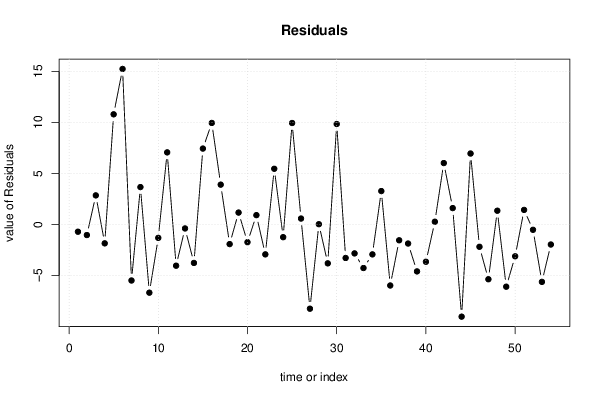
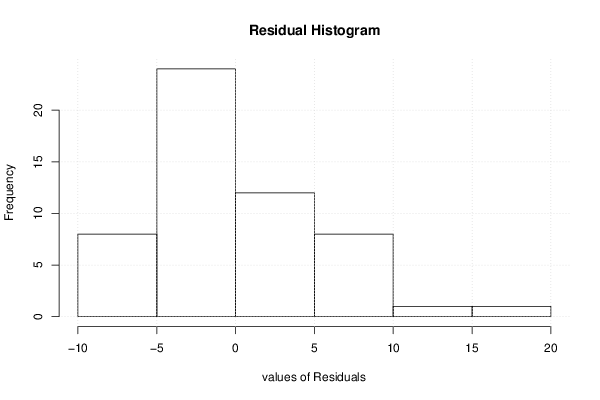
| Multiple Linear Regression - Residual Statistics | |
| Residual Standard Deviation | 5.43474 |
| Sum Squared Residuals | 1447.28 |
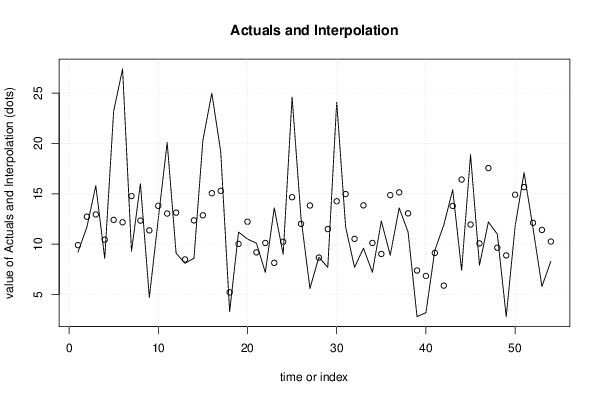
| Multiple Linear Regression - Actuals, Interpolation, and Residuals | |||
| Time or Index | Actuals | Interpolation Forecast | Residuals Prediction Error |
| 1 | 9.2 | 9.90294 | -0.702938 |
| 2 | 11.7 | 12.7286 | -1.02857 |
| 3 | 15.8 | 12.9481 | 2.85191 |
| 4 | 8.6 | 10.4423 | -1.84225 |
| 5 | 23.2 | 12.4136 | 10.7864 |
| 6 | 27.4 | 12.1729 | 15.2271 |
| 7 | 9.3 | 14.776 | -5.47602 |
| 8 | 16 | 12.335 | 3.66497 |
| 9 | 4.7 | 11.3683 | -6.66827 |
| 10 | 12.5 | 13.8055 | -1.30553 |
| 11 | 20.1 | 13.0381 | 7.06193 |
| 12 | 9.1 | 13.1285 | -4.02846 |
| 13 | 8.1 | 8.48311 | -0.38311 |
| 14 | 8.6 | 12.3589 | -3.75894 |
| 15 | 20.3 | 12.8678 | 7.43215 |
| 16 | 25 | 15.0579 | 9.94212 |
| 17 | 19.2 | 15.2961 | 3.90392 |
| 18 | 3.3 | 5.21571 | -1.91571 |
| 19 | 11.2 | 10.0283 | 1.1717 |
| 20 | 10.5 | 12.2277 | -1.72767 |
| 21 | 10.1 | 9.18208 | 0.917919 |
| 22 | 7.2 | 10.1199 | -2.91995 |
| 23 | 13.6 | 8.14259 | 5.45741 |
| 24 | 9 | 10.2374 | -1.23739 |
| 25 | 24.6 | 14.6628 | 9.93719 |
| 26 | 12.6 | 12.014 | 0.585997 |
| 27 | 5.6 | 13.8368 | -8.23682 |
| 28 | 8.7 | 8.66785 | 0.0321478 |
| 29 | 7.7 | 11.4994 | -3.79939 |
| 30 | 24.1 | 14.2606 | 9.83939 |
| 31 | 11.7 | 14.9728 | -3.27281 |
| 32 | 7.7 | 10.5251 | -2.82505 |
| 33 | 9.6 | 13.8559 | -4.2559 |
| 34 | 7.2 | 10.1199 | -2.91995 |
| 35 | 12.3 | 9.02509 | 3.27491 |
| 36 | 8.9 | 14.8662 | -5.9662 |
| 37 | 13.6 | 15.1412 | -1.54122 |
| 38 | 11.2 | 13.0592 | -1.85918 |
| 39 | 2.8 | 7.38662 | -4.58662 |
| 40 | 3.2 | 6.84347 | -3.64347 |
| 41 | 9.4 | 9.12569 | 0.27431 |
| 42 | 11.9 | 5.88217 | 6.01783 |
| 43 | 15.4 | 13.7908 | 1.60918 |
| 44 | 7.4 | 16.4156 | -9.01556 |
| 45 | 18.9 | 11.9498 | 6.95015 |
| 46 | 7.9 | 10.0767 | -2.1767 |
| 47 | 12.2 | 17.5547 | -5.35471 |
| 48 | 11 | 9.64676 | 1.35324 |
| 49 | 2.8 | 8.88409 | -6.08409 |
| 50 | 11.8 | 14.9084 | -3.10837 |
| 51 | 17.1 | 15.669 | 1.43104 |
| 52 | 11.6 | 12.1153 | -0.515304 |
| 53 | 5.8 | 11.4121 | -5.61206 |
| 54 | 8.3 | 10.2547 | -1.95471 |
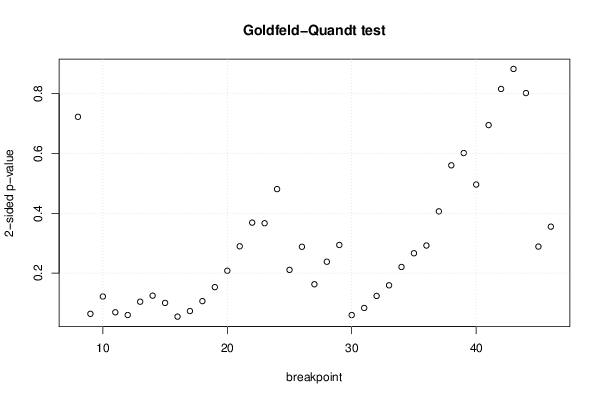
| Goldfeld-Quandt test for Heteroskedasticity | |||
| p-values | Alternative Hypothesis | ||
| breakpoint index | greater | 2-sided | less |
| 8 | 0.361303 | 0.722607 | 0.638697 |
| 9 | 0.968222 | 0.063557 | 0.0317785 |
| 10 | 0.939244 | 0.121511 | 0.0607555 |
| 11 | 0.965652 | 0.0686954 | 0.0343477 |
| 12 | 0.970222 | 0.0595557 | 0.0297778 |
| 13 | 0.947983 | 0.104035 | 0.0520174 |
| 14 | 0.937827 | 0.124345 | 0.0621725 |
| 15 | 0.94997 | 0.10006 | 0.0500298 |
| 16 | 0.972954 | 0.0540914 | 0.0270457 |
| 17 | 0.963554 | 0.072891 | 0.0364455 |
| 18 | 0.946994 | 0.106012 | 0.0530059 |
| 19 | 0.923606 | 0.152788 | 0.0763941 |
| 20 | 0.896194 | 0.207612 | 0.103806 |
| 21 | 0.855238 | 0.289523 | 0.144762 |
| 22 | 0.815655 | 0.36869 | 0.184345 |
| 23 | 0.816671 | 0.366658 | 0.183329 |
| 24 | 0.759579 | 0.480843 | 0.240421 |
| 25 | 0.894742 | 0.210517 | 0.105258 |
| 26 | 0.856074 | 0.287851 | 0.143926 |
| 27 | 0.918771 | 0.162458 | 0.081229 |
| 28 | 0.881106 | 0.237787 | 0.118894 |
| 29 | 0.853092 | 0.293815 | 0.146908 |
| 30 | 0.970306 | 0.0593874 | 0.0296937 |
| 31 | 0.958454 | 0.0830928 | 0.0415464 |
| 32 | 0.938264 | 0.123472 | 0.0617358 |
| 33 | 0.920508 | 0.158985 | 0.0794924 |
| 34 | 0.889844 | 0.220312 | 0.110156 |
| 35 | 0.86688 | 0.266241 | 0.13312 |
| 36 | 0.853979 | 0.292042 | 0.146021 |
| 37 | 0.796837 | 0.406326 | 0.203163 |
| 38 | 0.719822 | 0.560357 | 0.280178 |
| 39 | 0.699258 | 0.601485 | 0.300742 |
| 40 | 0.751988 | 0.496025 | 0.248012 |
| 41 | 0.652543 | 0.694915 | 0.347457 |
| 42 | 0.592074 | 0.815851 | 0.407926 |
| 43 | 0.558618 | 0.882765 | 0.441382 |
| 44 | 0.598931 | 0.802137 | 0.401069 |
| 45 | 0.855758 | 0.288483 | 0.144242 |
| 46 | 0.822454 | 0.355093 | 0.177546 |
| Meta Analysis of Goldfeld-Quandt test for Heteroskedasticity | |||
| Description | # significant tests | % significant tests | OK/NOK |
| 1% type I error level | 0 | 0 | OK |
| 5% type I error level | 0 | 0 | OK |
| 10% type I error level | 7 | 0.179487 | NOK |