| Tabulation of Results | |||
| score x treatment | |||
| E | S | T | 0 | 8 | 17 | 13 | 1 | 25 | 18 | 24 |
| Tabulation of Expected Results | |||
| score x treatment | |||
| E | S | T | 0 | 11.94 | 12.67 | 13.39 | 1 | 21.06 | 22.33 | 23.61 |
| Statistical Results | |
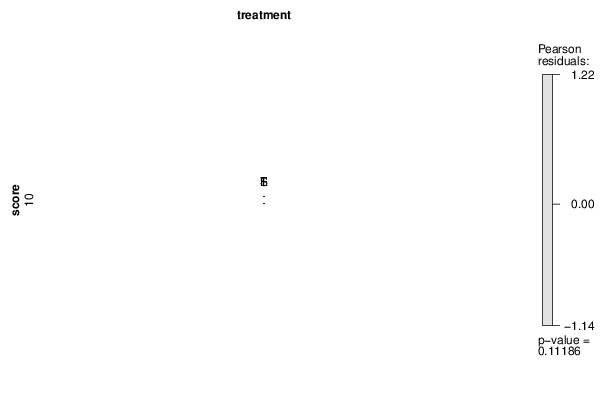
| Pearson's Chi-squared test | |
| Pearson Chi Square Statistic | 4.38 |
| Degrees of Freedom | 2 |
| P value | 0.11 |