| Multiple Linear Regression - Estimated Regression Equation |
| firearm[t] = -57480.6 + 29.3627year[t] + 99.1176jan[t] -50.2353feb[t] + 126.059mar[t] + 120.647apr[t] + 154.941may[t] + 107.765jun[t] + 173.706jul[t] + 124.034aug[t] + 59.0925sep[t] + 101.529oct[t] + 11.3529nov[t] + 134.427RW[t] + e[t] |
| Multiple Linear Regression - Ordinary Least Squares | |||||
| Variable | Parameter | S.D. | T-STAT H0: parameter = 0 | 2-tail p-value | 1-tail p-value |
| (Intercept) | -5.748e+04 | 2116 | -2.7170e+01 | 2.311e-67 | 1.156e-67 |
| year | +29.36 | 1.054 | +2.7860e+01 | 5.196e-69 | 2.598e-69 |
| jan | +99.12 | 25.03 | +3.9610e+00 | 0.0001057 | 5.283e-05 |
| feb | -50.23 | 25.03 | -2.0070e+00 | 0.04613 | 0.02307 |
| mar | +126.1 | 25.03 | +5.0370e+00 | 1.095e-06 | 5.476e-07 |
| apr | +120.7 | 25.03 | +4.8210e+00 | 2.92e-06 | 1.46e-06 |
| may | +154.9 | 25.03 | +6.1910e+00 | 3.605e-09 | 1.803e-09 |
| jun | +107.8 | 25.03 | +4.3060e+00 | 2.66e-05 | 1.33e-05 |
| jul | +173.7 | 25.03 | +6.9410e+00 | 5.979e-11 | 2.99e-11 |
| aug | +124 | 25.23 | +4.9170e+00 | 1.895e-06 | 9.473e-07 |
| sep | +59.09 | 25.23 | +2.3430e+00 | 0.02018 | 0.01009 |
| oct | +101.5 | 25.03 | +4.0570e+00 | 7.255e-05 | 3.627e-05 |
| nov | +11.35 | 25.03 | +4.5360e-01 | 0.6506 | 0.3253 |
| RW | +134.4 | 53.76 | +2.5010e+00 | 0.01324 | 0.00662 |
| Multiple Linear Regression - Regression Statistics | |
| Multiple R | 0.9152 |
| R-squared | 0.8376 |
| Adjusted R-squared | 0.8265 |
| F-TEST (value) | 75.39 |
| F-TEST (DF numerator) | 13 |
| F-TEST (DF denominator) | 190 |
| p-value | 0 |
| Multiple Linear Regression - Residual Statistics | |
| Residual Standard Deviation | 72.96 |
| Sum Squared Residuals | 1.011e+06 |
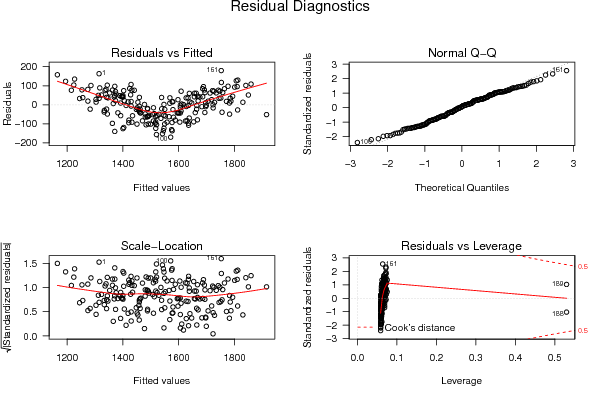
| Menu of Residual Diagnostics | |
| Description | Link |
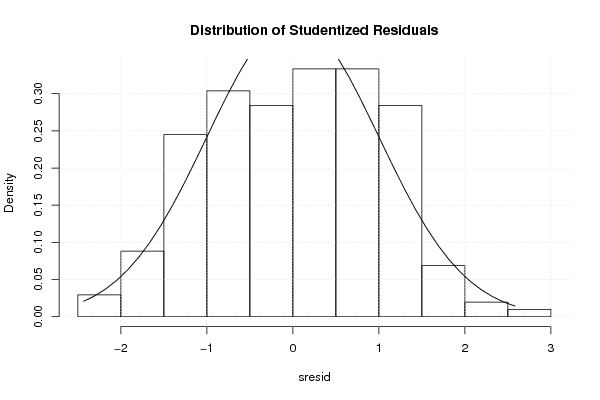
| Histogram | Compute |
| Central Tendency | Compute |
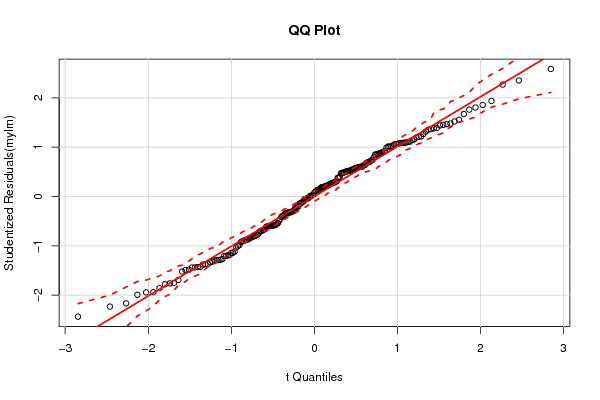
| QQ Plot | Compute |
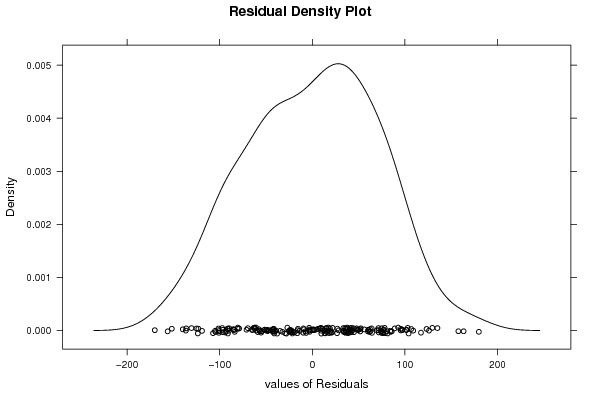
| Kernel Density Plot | Compute |
| Skewness/Kurtosis Test | Compute |
| Skewness-Kurtosis Plot | Compute |
| Harrell-Davis Plot | Compute |
| Bootstrap Plot -- Central Tendency | Compute |
| Blocked Bootstrap Plot -- Central Tendency | Compute |
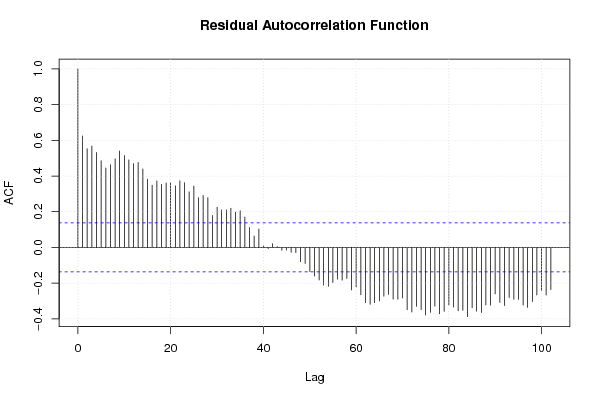
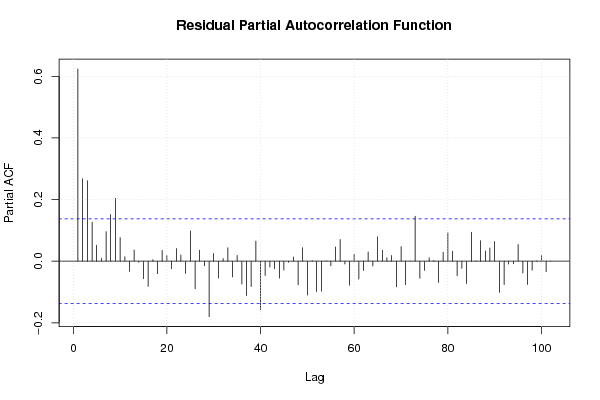
| (Partial) Autocorrelation Plot | Compute |
| Spectral Analysis | Compute |
| Tukey lambda PPCC Plot | Compute |
| Box-Cox Normality Plot | Compute |
| Summary Statistics | Compute |
| Ramsey RESET F-Test for powers (2 and 3) of fitted values |
> reset_test_fitted RESET test data: mylm RESET = 54.374, df1 = 2, df2 = 188, p-value < 2.2e-16 |
| Ramsey RESET F-Test for powers (2 and 3) of regressors |
> reset_test_regressors RESET test data: mylm RESET = 5.2879, df1 = 26, df2 = 164, p-value = 9.654e-12 |
| Ramsey RESET F-Test for powers (2 and 3) of principal components |
> reset_test_principal_components RESET test data: mylm RESET = 78.803, df1 = 2, df2 = 188, p-value < 2.2e-16 |
| Variance Inflation Factors (Multicollinearity) |
> vif
    year      jan      feb      mar      apr      may      jun      jul
1.021729 1.833333 1.833333 1.833333 1.833333 1.833333 1.833333 1.833333
     aug      sep      oct      nov       RW
1.862602 1.862602 1.833333 1.833333 1.074945
|