| Multiple Linear Regression - Estimated Regression Equation |
| allsui[t] = -151647 + 76.9364year[t] + 174.176jan[t] -115.941feb[t] + 256.059mar[t] + 244.706apr[t] + 370.353may[t] + 256.788jun[t] + 371.2jul[t] + 321.992aug[t] + 188.581sep[t] + 233.118oct[t] + 48.0588nov[t] + 472.129RW[t] + 17.6038MJ[t] + e[t] |
| Multiple Linear Regression - Ordinary Least Squares | |||||
| Variable | Parameter | S.D. | T-STAT H0: parameter = 0 | 2-tail p-value | 1-tail p-value |
| (Intercept) | -1.516e+05 | 2944 | -5.1500e+01 | 3.487e-113 | 1.744e-113 |
| year | +76.94 | 1.467 | +5.2440e+01 | 1.424e-114 | 7.118e-115 |
| jan | +174.2 | 34.8 | +5.0050e+00 | 1.275e-06 | 6.374e-07 |
| feb | -115.9 | 34.8 | -3.3320e+00 | 0.001039 | 0.0005194 |
| mar | +256.1 | 34.8 | +7.3580e+00 | 5.554e-12 | 2.777e-12 |
| apr | +244.7 | 34.8 | +7.0310e+00 | 3.626e-11 | 1.813e-11 |
| may | +370.4 | 34.8 | +1.0640e+01 | 5.053e-21 | 2.527e-21 |
| jun | +256.8 | 35.07 | +7.3220e+00 | 6.852e-12 | 3.426e-12 |
| jul | +371.2 | 35.07 | +1.0580e+01 | 7.465e-21 | 3.733e-21 |
| aug | +322 | 35.08 | +9.1790e+00 | 7.637e-17 | 3.818e-17 |
| sep | +188.6 | 35.08 | +5.3760e+00 | 2.229e-07 | 1.114e-07 |
| oct | +233.1 | 34.8 | +6.6990e+00 | 2.345e-10 | 1.172e-10 |
| nov | +48.06 | 34.8 | +1.3810e+00 | 0.1689 | 0.08446 |
| RW | +472.1 | 74.75 | +6.3160e+00 | 1.876e-09 | 9.382e-10 |
| MJ | +17.6 | 74.02 | +2.3780e-01 | 0.8123 | 0.4061 |
| Multiple Linear Regression - Regression Statistics | |
| Multiple R | 0.9731 |
| R-squared | 0.947 |
| Adjusted R-squared | 0.9431 |
| F-TEST (value) | 241.1 |
| F-TEST (DF numerator) | 14 |
| F-TEST (DF denominator) | 189 |
| p-value | 0 |
| Multiple Linear Regression - Residual Statistics | |
| Residual Standard Deviation | 101.5 |
| Sum Squared Residuals | 1.946e+06 |
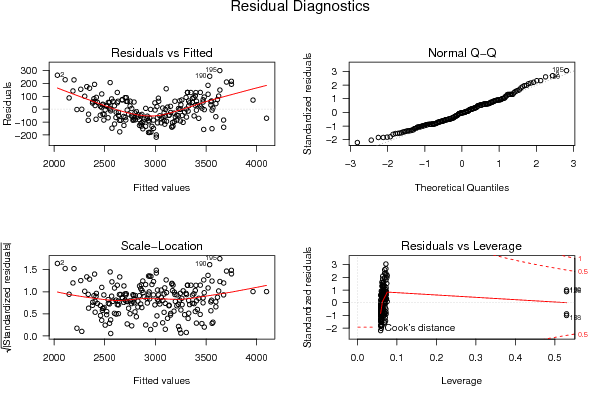
| Menu of Residual Diagnostics | |
| Description | Link |
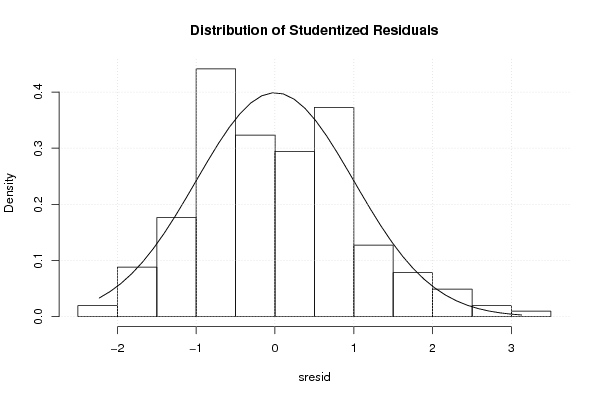
| Histogram | Compute |
| Central Tendency | Compute |
| QQ Plot | Compute |
| Kernel Density Plot | Compute |
| Skewness/Kurtosis Test | Compute |
| Skewness-Kurtosis Plot | Compute |
| Harrell-Davis Plot | Compute |
| Bootstrap Plot -- Central Tendency | Compute |
| Blocked Bootstrap Plot -- Central Tendency | Compute |
| (Partial) Autocorrelation Plot | Compute |
| Spectral Analysis | Compute |
| Tukey lambda PPCC Plot | Compute |
| Box-Cox Normality Plot | Compute |
| Summary Statistics | Compute |
| Ramsey RESET F-Test for powers (2 and 3) of fitted values |
> reset_test_fitted RESET test data: mylm RESET = 46.095, df1 = 2, df2 = 187, p-value < 2.2e-16 |
| Ramsey RESET F-Test for powers (2 and 3) of regressors |
> reset_test_regressors RESET test data: mylm RESET = 1.7859, df1 = 28, df2 = 161, p-value = 0.01393 |
| Ramsey RESET F-Test for powers (2 and 3) of principal components |
> reset_test_principal_components RESET test data: mylm RESET = 29.039, df1 = 2, df2 = 187, p-value = 1.04e-11 |
| Variance Inflation Factors (Multicollinearity) |
> vif
    year      jan      feb      mar      apr      may      jun      jul
1.023545 1.833333 1.833333 1.833333 1.833333 1.833333 1.862030 1.862030
     aug      sep      oct      nov       RW       MJ
1.862603 1.862603 1.833333 1.833333 1.074985 1.053953
|