| *The author of this computation has been verified* | ||||||||||||||||||||||||||||||||||||||||||||
| R Software Module: /rwasp_boxcoxlin.wasp (opens new window with default values) | ||||||||||||||||||||||||||||||||||||||||||||
| Title produced by software: Box-Cox Linearity Plot | ||||||||||||||||||||||||||||||||||||||||||||
| Date of computation: Tue, 03 Nov 2009 13:56:05 -0700 | ||||||||||||||||||||||||||||||||||||||||||||
| Cite this page as follows: | ||||||||||||||||||||||||||||||||||||||||||||
| Statistical Computations at FreeStatistics.org, Office for Research Development and Education, URL http://www.freestatistics.org/blog/date/2009/Nov/03/t1257281814bdeap0fvhi4qzdn.htm/, Retrieved Tue, 03 Nov 2009 21:56:57 +0100 | ||||||||||||||||||||||||||||||||||||||||||||
| BibTeX entries for LaTeX users: | ||||||||||||||||||||||||||||||||||||||||||||
@Manual{KEY,
    author = {{YOUR NAME}},
    publisher = {Office for Research Development and Education},
    title = {Statistical Computations at FreeStatistics.org, URL http://www.freestatistics.org/blog/date/2009/Nov/03/t1257281814bdeap0fvhi4qzdn.htm/},
    year = {2009},
}
@Manual{R,
    title = {R: A Language and Environment for Statistical Computing},
    author = {{R Development Core Team}},
    organization = {R Foundation for Statistical Computing},
    address = {Vienna, Austria},
    year = {2009},
    note = {{ISBN} 3-900051-07-0},
    url = {http://www.R-project.org},
}
| ||||||||||||||||||||||||||||||||||||||||||||
| Original text written by user: | ||||||||||||||||||||||||||||||||||||||||||||
| IsPrivate? | ||||||||||||||||||||||||||||||||||||||||||||
| No (this computation is public) | ||||||||||||||||||||||||||||||||||||||||||||
| User-defined keywords: | ||||||||||||||||||||||||||||||||||||||||||||
| WS6boxcox | ||||||||||||||||||||||||||||||||||||||||||||
| Dataseries X: | ||||||||||||||||||||||||||||||||||||||||||||
| » Textbox « » Textfile « » CSV « | ||||||||||||||||||||||||||||||||||||||||||||
| 9356 9337 10149 9788 9770 9911 9429 8775 10189 10529 9914 9790 9625 9729 10589 9611 9388 9510 9690 8434 9844 10601 9942 10229 9381 9635 11228 9999 10089 11622 10533 9965 11567 11321 11686 11747 10595 10751 12199 11690 10978 11753 10839 10518 12183 11967 12363 12359 12162 12096 14325 12670 13865 13563 12734 12464 13389 13961 14088 13143 13413 13579 15388 13708 14689 14883 13991 13854 14364 15672 15904 14016 | ||||||||||||||||||||||||||||||||||||||||||||
| Dataseries Y: | ||||||||||||||||||||||||||||||||||||||||||||
| » Textbox « » Textfile « » CSV « | ||||||||||||||||||||||||||||||||||||||||||||
| 14271 14013 15912 14290 14744 14721 13918 13263 15660 15629 15113 14526 15132 14908 16167 14122 13985 14236 13921 12394 15454 16146 15107 14593 14695 14513 17071 15179 15460 17173 15938 15003 18216 17847 18029 17281 16706 16750 18912 17763 16736 18061 16713 16769 19514 19251 19951 19052 19555 19083 22534 18854 19801 20346 18169 19087 20842 21602 22360 20334 21215 20530 23152 20134 21193 21628 20823 20493 22106 24178 24958 21620 | ||||||||||||||||||||||||||||||||||||||||||||
| Output produced by software: | ||||||||||||||||||||||||||||||||||||||||||||
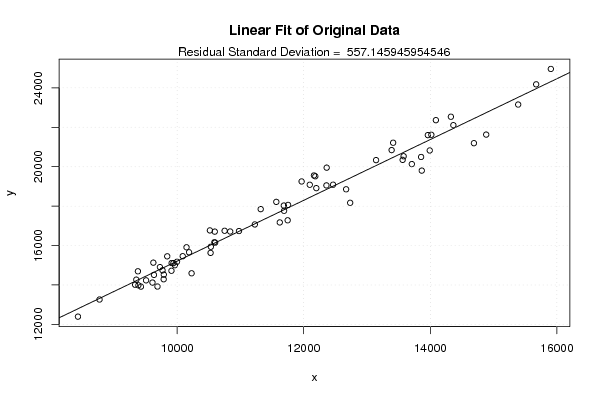
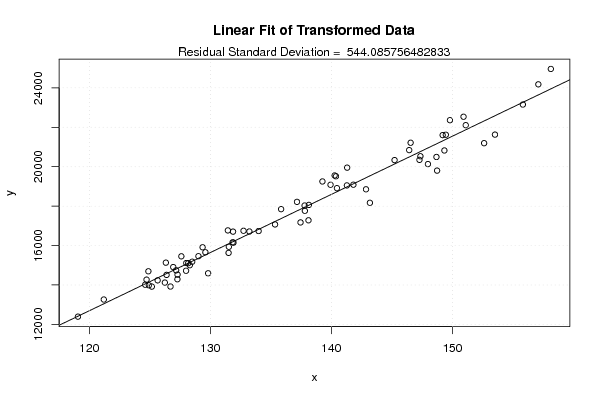
| Charts produced by software: |
| Parameters (Session): | | Parameters (R input): | | R code (references can be found in the software module): | n <- length(x)
| c <- array(NA,dim=c(401)) l <- array(NA,dim=c(401)) mx <- 0 mxli <- -999 for (i in 1:401) { l[i] <- (i-201)/100 if (l[i] != 0) { x1 <- (x^l[i] - 1) / l[i] } else { x1 <- log(x) } c[i] <- cor(x1,y) if (mx < abs(c[i])) { mx <- abs(c[i]) mxli <- l[i] } } c mx mxli if (mxli != 0) { x1 <- (x^mxli - 1) / mxli } else { x1 <- log(x) } r<-lm(y~x) se <- sqrt(var(r$residuals)) r1 <- lm(y~x1) se1 <- sqrt(var(r1$residuals)) bitmap(file='test1.png') plot(l,c,main='Box-Cox Linearity Plot',xlab='Lambda',ylab='correlation') grid() dev.off() bitmap(file='test2.png') plot(x,y,main='Linear Fit of Original Data',xlab='x',ylab='y') abline(r) grid() mtext(paste('Residual Standard Deviation = ',se)) dev.off() bitmap(file='test3.png') plot(x1,y,main='Linear Fit of Transformed Data',xlab='x',ylab='y') abline(r1) grid() mtext(paste('Residual Standard Deviation = ',se1)) dev.off() load(file='createtable') a<-table.start() a<-table.row.start(a) a<-table.element(a,'Box-Cox Linearity Plot',2,TRUE) a<-table.row.end(a) a<-table.row.start(a) a<-table.element(a,'# observations x',header=TRUE) a<-table.element(a,n) a<-table.row.end(a) a<-table.row.start(a) a<-table.element(a,'maximum correlation',header=TRUE) a<-table.element(a,mx) a<-table.row.end(a) a<-table.row.start(a) a<-table.element(a,'optimal lambda(x)',header=TRUE) a<-table.element(a,mxli) a<-table.row.end(a) a<-table.row.start(a) a<-table.element(a,'Residual SD (orginial)',header=TRUE) a<-table.element(a,se) a<-table.row.end(a) a<-table.row.start(a) a<-table.element(a,'Residual SD (transformed)',header=TRUE) a<-table.element(a,se1) a<-table.row.end(a) a<-table.end(a) table.save(a,file='mytable.tab') | Copyright
Software written by Ed van Stee & Patrick Wessa Disclaimer Information provided on this web site is provided "AS IS" without warranty of any kind, either express or implied, including, without limitation, warranties of merchantability, fitness for a particular purpose, and noninfringement. We use reasonable efforts to include accurate and timely information and periodically update the information, and software without notice. However, we make no warranties or representations as to the accuracy or completeness of such information (or software), and we assume no liability or responsibility for errors or omissions in the content of this web site, or any software bugs in online applications. Your use of this web site is AT YOUR OWN RISK. Under no circumstances and under no legal theory shall we be liable to you or any other person for any direct, indirect, special, incidental, exemplary, or consequential damages arising from your access to, or use of, this web site. Privacy Policy We may request personal information to be submitted to our servers in order to be able to:
We NEVER allow other companies to directly offer registered users information about their products and services. Banner references and hyperlinks of third parties NEVER contain any personal data of the visitor. We do NOT sell, nor transmit by any means, personal information, nor statistical data series uploaded by you to third parties.
We store a unique ANONYMOUS USER ID in the form of a small 'Cookie' on your computer. This allows us to track your progress when using this website which is necessary to create state-dependent features. The cookie is used for NO OTHER PURPOSE. At any time you may opt to disallow cookies from this website - this will not affect other features of this website. We examine cookies that are used by third-parties (banner and online ads) very closely: abuse from third-parties automatically results in termination of the advertising contract without refund. We have very good reason to believe that the cookies that are produced by third parties (banner ads) do NOT cause any privacy or security risk. FreeStatistics.org is safe. There is no need to download any software to use the applications and services contained in this website. Hence, your system's security is not compromised by their use, and your personal data - other than data you submit in the account application form, and the user-agent information that is transmitted by your browser - is never transmitted to our servers. As a general rule, we do not log on-line behavior of individuals (other than normal logging of webserver 'hits'). However, in cases of abuse, hacking, unauthorized access, Denial of Service attacks, illegal copying, hotlinking, non-compliance with international webstandards (such as robots.txt), or any other harmful behavior, our system engineers are empowered to log, track, identify, publish, and ban misbehaving individuals - even if this leads to ban entire blocks of IP addresses, or disclosing user's identity. | ||||||||||||||||||||||||||||||||||