Yt gezuiverd van Zt WS5 Bivariate EDA | |||||||||||||||||||||||||||||||||||||||||||||||||||||||||||||||||||||
| *The author of this computation has been verified* | |||||||||||||||||||||||||||||||||||||||||||||||||||||||||||||||||||||
| R Software Module: /rwasp_edabi.wasp (opens new window with default values) | |||||||||||||||||||||||||||||||||||||||||||||||||||||||||||||||||||||
| Title produced by software: Bivariate Explorative Data Analysis | |||||||||||||||||||||||||||||||||||||||||||||||||||||||||||||||||||||
| Date of computation: Wed, 04 Nov 2009 08:49:53 -0700 | |||||||||||||||||||||||||||||||||||||||||||||||||||||||||||||||||||||
| Cite this page as follows: | |||||||||||||||||||||||||||||||||||||||||||||||||||||||||||||||||||||
| Statistical Computations at FreeStatistics.org, Office for Research Development and Education, URL http://www.freestatistics.org/blog/date/2009/Nov/04/t1257349892efzjcipuip5tast.htm/, Retrieved Wed, 04 Nov 2009 16:51:34 +0100 | |||||||||||||||||||||||||||||||||||||||||||||||||||||||||||||||||||||
| BibTeX entries for LaTeX users: | |||||||||||||||||||||||||||||||||||||||||||||||||||||||||||||||||||||
@Manual{KEY,
    author = {{YOUR NAME}},
    publisher = {Office for Research Development and Education},
    title = {Statistical Computations at FreeStatistics.org, URL http://www.freestatistics.org/blog/date/2009/Nov/04/t1257349892efzjcipuip5tast.htm/},
    year = {2009},
}
@Manual{R,
    title = {R: A Language and Environment for Statistical Computing},
    author = {{R Development Core Team}},
    organization = {R Foundation for Statistical Computing},
    address = {Vienna, Austria},
    year = {2009},
    note = {{ISBN} 3-900051-07-0},
    url = {http://www.R-project.org},
}
| |||||||||||||||||||||||||||||||||||||||||||||||||||||||||||||||||||||
| Original text written by user: | |||||||||||||||||||||||||||||||||||||||||||||||||||||||||||||||||||||
| populatieaangroei gezuiverd met het sterftecijfer in bivariate EDA | |||||||||||||||||||||||||||||||||||||||||||||||||||||||||||||||||||||
| IsPrivate? | |||||||||||||||||||||||||||||||||||||||||||||||||||||||||||||||||||||
| No (this computation is public) | |||||||||||||||||||||||||||||||||||||||||||||||||||||||||||||||||||||
| User-defined keywords: | |||||||||||||||||||||||||||||||||||||||||||||||||||||||||||||||||||||
| Dataseries X: | |||||||||||||||||||||||||||||||||||||||||||||||||||||||||||||||||||||
| » Textbox « » Textfile « » CSV « | |||||||||||||||||||||||||||||||||||||||||||||||||||||||||||||||||||||
| 29211 29870 32045 32209 32062 31623 32652 30030 29220 29894 28375 29082 29699 27736 28417 28412 29158 29099 29981 30560 31645 31761 32543 33313 34318 36850 35171 35317 36010 36216 37668 38994 38723 38981 39375 39958 39464 40061 40216 39824 40682 41632 41340 41893 41454 42224 42581 44372 43560 44959 45354 45173 46021 44923 44731 46597 44071 45190 43860 44595 44112 45170 44002 43981 44465 42478 41200 41232 | |||||||||||||||||||||||||||||||||||||||||||||||||||||||||||||||||||||
| Dataseries Y: | |||||||||||||||||||||||||||||||||||||||||||||||||||||||||||||||||||||
| » Textbox « » Textfile « » CSV « | |||||||||||||||||||||||||||||||||||||||||||||||||||||||||||||||||||||
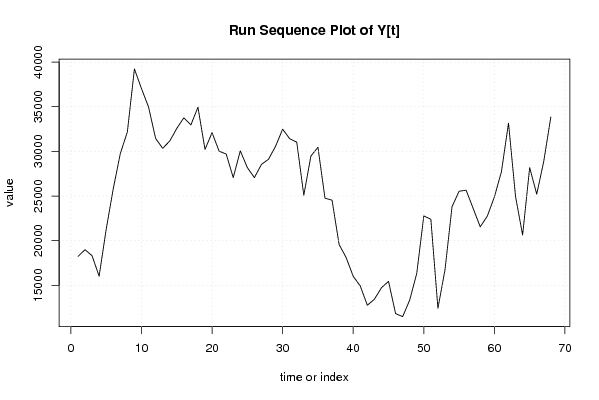
| 18234 18989 18315 16020 21277 25816 29747 32185 39228 37028 34974 31455 30342 31150 32564 33756 32960 34947 30217 32096 30015 29706 27064 30058 28177 27062 28541 29117 30572 32482 31412 31029 25084 29468 30462 24755 24535 19576 18101 16006 14926 12766 13440 14723 15448 11842 11492 13342 16334 22768 22397 12430 16714 23804 25533 25648 23595 21547 22757 24885 27730 33168 24939 20630 28186 25205 28906 33856 | |||||||||||||||||||||||||||||||||||||||||||||||||||||||||||||||||||||
| Output produced by software: | |||||||||||||||||||||||||||||||||||||||||||||||||||||||||||||||||||||
| Charts produced by software: |
| Parameters (Session): | par1 = 0 ; par2 = 36 ; | | Parameters (R input): | par1 = 0 ; par2 = 36 ; | | R code (references can be found in the software module): | par1 <- as.numeric(par1)
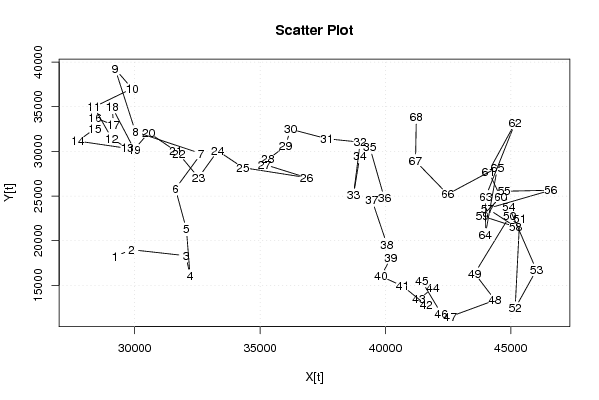
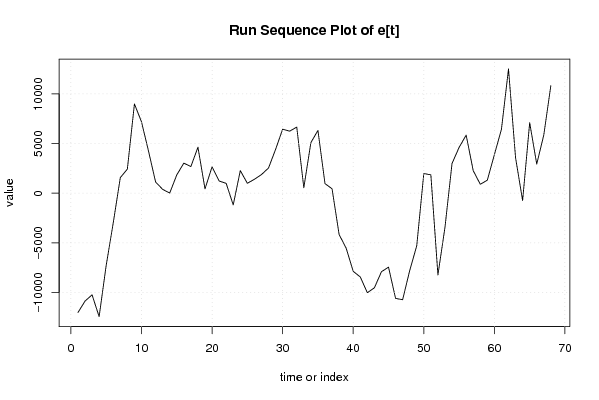
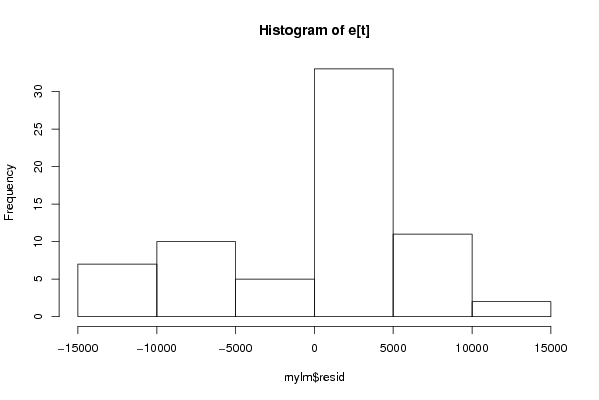
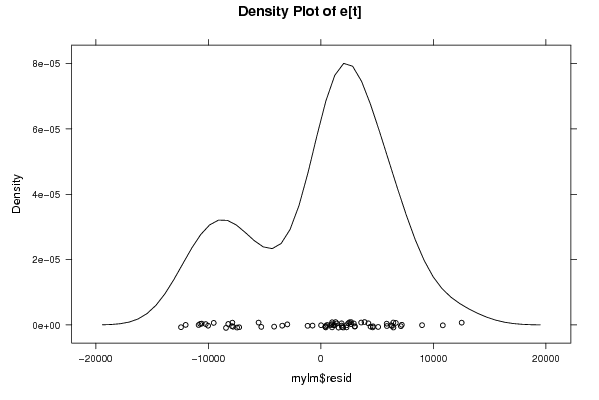
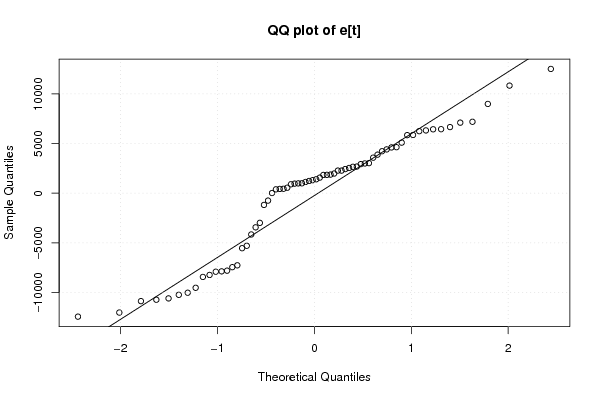
| par2 <- as.numeric(par2) x <- as.ts(x) y <- as.ts(y) mylm <- lm(y~x) cbind(mylm$resid) library(lattice) bitmap(file='pic1.png') plot(y,type='l',main='Run Sequence Plot of Y[t]',xlab='time or index',ylab='value') grid() dev.off() bitmap(file='pic1a.png') plot(x,type='l',main='Run Sequence Plot of X[t]',xlab='time or index',ylab='value') grid() dev.off() bitmap(file='pic1b.png') plot(x,y,main='Scatter Plot',xlab='X[t]',ylab='Y[t]') grid() dev.off() bitmap(file='pic1c.png') plot(mylm$resid,type='l',main='Run Sequence Plot of e[t]',xlab='time or index',ylab='value') grid() dev.off() bitmap(file='pic2.png') hist(mylm$resid,main='Histogram of e[t]') dev.off() bitmap(file='pic3.png') if (par1 > 0) { densityplot(~mylm$resid,col='black',main=paste('Density Plot of e[t] bw = ',par1),bw=par1) } else { densityplot(~mylm$resid,col='black',main='Density Plot of e[t]') } dev.off() bitmap(file='pic4.png') qqnorm(mylm$resid,main='QQ plot of e[t]') qqline(mylm$resid) grid() dev.off() if (par2 > 0) { bitmap(file='pic5.png') acf(mylm$resid,lag.max=par2,main='Residual Autocorrelation Function') grid() dev.off() } summary(x) load(file='createtable') a<-table.start() a<-table.row.start(a) a<-table.element(a,'Model: Y[t] = c + b X[t] + e[t]',2,TRUE) a<-table.row.end(a) a<-table.row.start(a) a<-table.element(a,'c',1,TRUE) a<-table.element(a,mylm$coeff[[1]]) a<-table.row.end(a) a<-table.row.start(a) a<-table.element(a,'b',1,TRUE) a<-table.element(a,mylm$coeff[[2]]) a<-table.row.end(a) a<-table.end(a) table.save(a,file='mytable.tab') a<-table.start() a<-table.row.start(a) a<-table.element(a,'Descriptive Statistics about e[t]',2,TRUE) a<-table.row.end(a) a<-table.row.start(a) a<-table.element(a,'# observations',header=TRUE) a<-table.element(a,length(mylm$resid)) a<-table.row.end(a) a<-table.row.start(a) a<-table.element(a,'minimum',header=TRUE) a<-table.element(a,min(mylm$resid)) a<-table.row.end(a) a<-table.row.start(a) a<-table.element(a,'Q1',header=TRUE) a<-table.element(a,quantile(mylm$resid,0.25)) a<-table.row.end(a) a<-table.row.start(a) a<-table.element(a,'median',header=TRUE) a<-table.element(a,median(mylm$resid)) a<-table.row.end(a) a<-table.row.start(a) a<-table.element(a,'mean',header=TRUE) a<-table.element(a,mean(mylm$resid)) a<-table.row.end(a) a<-table.row.start(a) a<-table.element(a,'Q3',header=TRUE) a<-table.element(a,quantile(mylm$resid,0.75)) a<-table.row.end(a) a<-table.row.start(a) a<-table.element(a,'maximum',header=TRUE) a<-table.element(a,max(mylm$resid)) a<-table.row.end(a) a<-table.end(a) table.save(a,file='mytable.tab') | Copyright
Software written by Ed van Stee & Patrick Wessa Disclaimer Information provided on this web site is provided "AS IS" without warranty of any kind, either express or implied, including, without limitation, warranties of merchantability, fitness for a particular purpose, and noninfringement. We use reasonable efforts to include accurate and timely information and periodically update the information, and software without notice. However, we make no warranties or representations as to the accuracy or completeness of such information (or software), and we assume no liability or responsibility for errors or omissions in the content of this web site, or any software bugs in online applications. Your use of this web site is AT YOUR OWN RISK. Under no circumstances and under no legal theory shall we be liable to you or any other person for any direct, indirect, special, incidental, exemplary, or consequential damages arising from your access to, or use of, this web site. Privacy Policy We may request personal information to be submitted to our servers in order to be able to:
We NEVER allow other companies to directly offer registered users information about their products and services. Banner references and hyperlinks of third parties NEVER contain any personal data of the visitor. We do NOT sell, nor transmit by any means, personal information, nor statistical data series uploaded by you to third parties.
We store a unique ANONYMOUS USER ID in the form of a small 'Cookie' on your computer. This allows us to track your progress when using this website which is necessary to create state-dependent features. The cookie is used for NO OTHER PURPOSE. At any time you may opt to disallow cookies from this website - this will not affect other features of this website. We examine cookies that are used by third-parties (banner and online ads) very closely: abuse from third-parties automatically results in termination of the advertising contract without refund. We have very good reason to believe that the cookies that are produced by third parties (banner ads) do NOT cause any privacy or security risk. FreeStatistics.org is safe. There is no need to download any software to use the applications and services contained in this website. Hence, your system's security is not compromised by their use, and your personal data - other than data you submit in the account application form, and the user-agent information that is transmitted by your browser - is never transmitted to our servers. As a general rule, we do not log on-line behavior of individuals (other than normal logging of webserver 'hits'). However, in cases of abuse, hacking, unauthorized access, Denial of Service attacks, illegal copying, hotlinking, non-compliance with international webstandards (such as robots.txt), or any other harmful behavior, our system engineers are empowered to log, track, identify, publish, and ban misbehaving individuals - even if this leads to ban entire blocks of IP addresses, or disclosing user's identity. | |||||||||||||||||||||||||||||||||||||||||||||||||||||||||