TRIVIATE SCATTERPLOT | ||||||||||||||||||||||||||||||||||||||||||||
| *The author of this computation has been verified* | ||||||||||||||||||||||||||||||||||||||||||||
| R Software Module: /rwasp_cloud.wasp (opens new window with default values) | ||||||||||||||||||||||||||||||||||||||||||||
| Title produced by software: Trivariate Scatterplots | ||||||||||||||||||||||||||||||||||||||||||||
| Date of computation: Wed, 04 Nov 2009 10:21:13 -0700 | ||||||||||||||||||||||||||||||||||||||||||||
| Cite this page as follows: | ||||||||||||||||||||||||||||||||||||||||||||
| Statistical Computations at FreeStatistics.org, Office for Research Development and Education, URL http://www.freestatistics.org/blog/date/2009/Nov/04/t125735534525pn4mxrj17edgu.htm/, Retrieved Wed, 04 Nov 2009 18:22:36 +0100 | ||||||||||||||||||||||||||||||||||||||||||||
| BibTeX entries for LaTeX users: | ||||||||||||||||||||||||||||||||||||||||||||
@Manual{KEY,
    author = {{YOUR NAME}},
    publisher = {Office for Research Development and Education},
    title = {Statistical Computations at FreeStatistics.org, URL http://www.freestatistics.org/blog/date/2009/Nov/04/t125735534525pn4mxrj17edgu.htm/},
    year = {2009},
}
@Manual{R,
    title = {R: A Language and Environment for Statistical Computing},
    author = {{R Development Core Team}},
    organization = {R Foundation for Statistical Computing},
    address = {Vienna, Austria},
    year = {2009},
    note = {{ISBN} 3-900051-07-0},
    url = {http://www.R-project.org},
}
| ||||||||||||||||||||||||||||||||||||||||||||
| Original text written by user: | ||||||||||||||||||||||||||||||||||||||||||||
| IsPrivate? | ||||||||||||||||||||||||||||||||||||||||||||
| No (this computation is public) | ||||||||||||||||||||||||||||||||||||||||||||
| User-defined keywords: | ||||||||||||||||||||||||||||||||||||||||||||
| Dataseries X: | ||||||||||||||||||||||||||||||||||||||||||||
| » Textbox « » Textfile « » CSV « | ||||||||||||||||||||||||||||||||||||||||||||
| 4651,600942 4648,46719 4629,664677 4595,193403 4573,257137 4592,05965 4751,881013 4805,154801 4811,422306 4805,154801 4751,881013 4755,014766 4742,479757 4736,212252 4720,543491 4686,072217 4667,269704 4673,537208 4836,492323 4861,562341 4858,428589 4808,288553 4755,014766 4761,28227 4748,747261 4739,346005 4708,008482 4689,205969 4686,072217 4686,072217 4833,358571 4852,161084 4833,358571 4733,0785 4664,135951 4635,932181 4648,46719 4610,862164 4557,588376 4538,785863 4491,779579 4454,174553 4629,664677 4661,002199 4588,925898 4541,919615 4488,645827 4501,180836 4510,582093 4482,378323 4435,37204 4425,970783 4360,161986 4388,365756 4545,053367 4563,85588 4513,715845 4476,110818 4463,57581 4507,448341 | ||||||||||||||||||||||||||||||||||||||||||||
| Dataseries Y: | ||||||||||||||||||||||||||||||||||||||||||||
| » Textbox « » Textfile « » CSV « | ||||||||||||||||||||||||||||||||||||||||||||
| 52.034 58.146 79.035 63.969 34.831 42.602 23.589 21.974 29.651 39.547 27.957 10.511 63.044 50.898 63.547 55.028 40.073 56.080 28.091 29.211 33.415 35.336 31.502 1.007 75.840 69.091 88.380 61.147 59.750 50.533 33.467 28.944 32.053 42.095 27.840 -686 69.362 55.107 73.801 50.981 48.575 52.660 37.173 25.894 30.201 46.248 26.577 1.911 68.401 65.458 67.183 76.063 48.064 52.591 34.502 22.268 30.174 39.902 14.115 -2.715 | ||||||||||||||||||||||||||||||||||||||||||||
| Dataseries Z: | ||||||||||||||||||||||||||||||||||||||||||||
| » Textbox « » Textfile « » CSV « | ||||||||||||||||||||||||||||||||||||||||||||
| 562000 561000 555000 544000 537000 543000 594000 611000 613000 611000 594000 595000 591000 589000 584000 573000 567000 569000 621000 629000 628000 612000 595000 597000 593000 590000 580000 574000 573000 573000 620000 626000 620000 588000 566000 557000 561000 549000 532000 526000 511000 499000 555000 565000 542000 527000 510000 514000 517000 508000 493000 490000 469000 478000 528000 534000 518000 506000 502000 516000 | ||||||||||||||||||||||||||||||||||||||||||||
| Output produced by software: | ||||||||||||||||||||||||||||||||||||||||||||
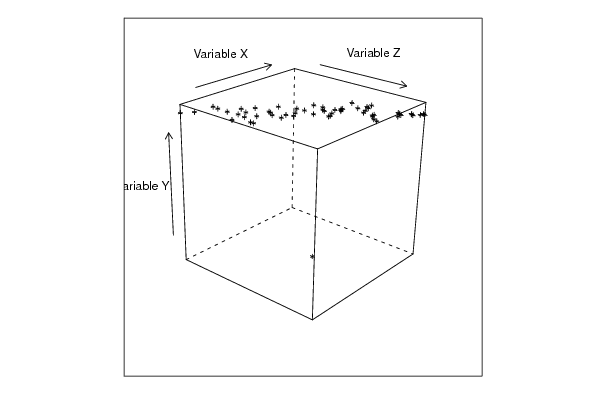
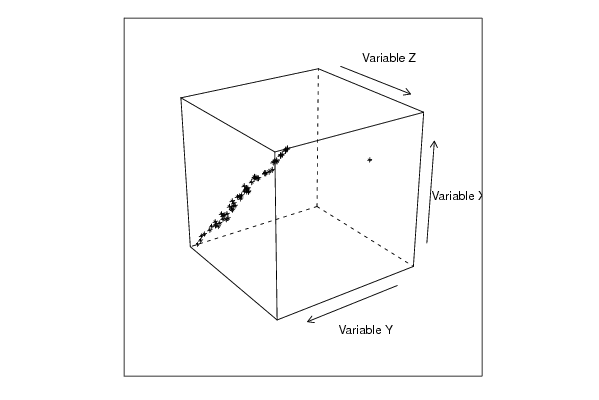
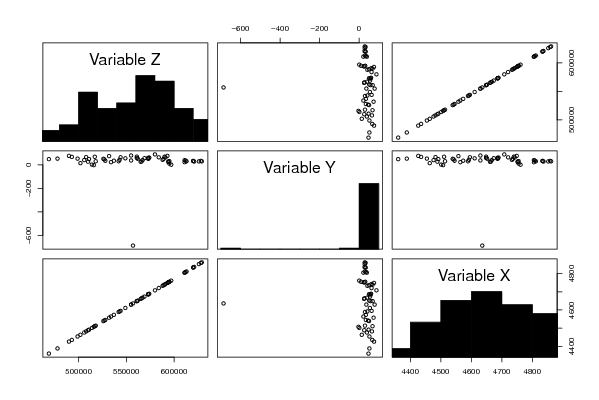
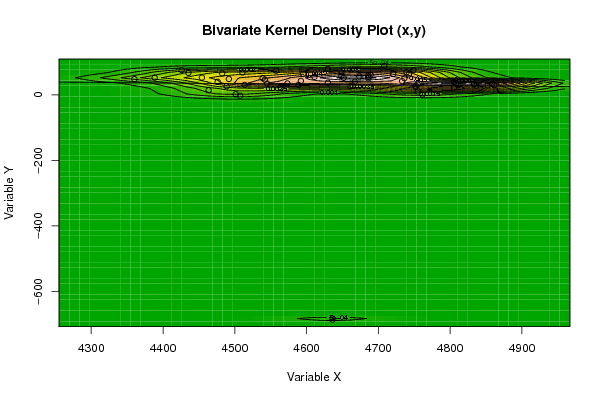
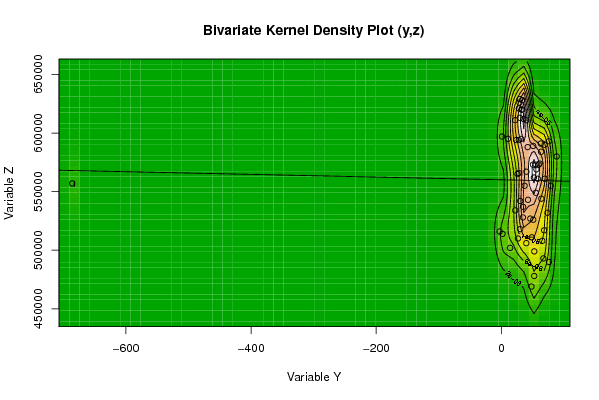
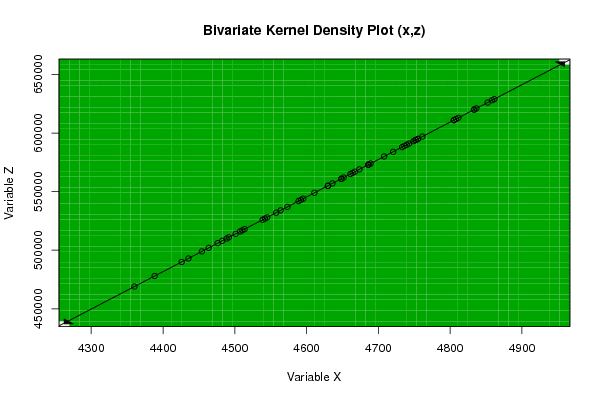
| Charts produced by software: |
| Parameters (Session): | par1 = 50 ; par2 = 50 ; par3 = Y ; par4 = Y ; par5 = Variable X ; par6 = Variable Y ; par7 = Variable Z ; | | Parameters (R input): | par1 = 50 ; par2 = 50 ; par3 = Y ; par4 = Y ; par5 = Variable X ; par6 = Variable Y ; par7 = Variable Z ; | | R code (references can be found in the software module): | x <- array(x,dim=c(length(x),1))
| colnames(x) <- par5 y <- array(y,dim=c(length(y),1)) colnames(y) <- par6 z <- array(z,dim=c(length(z),1)) colnames(z) <- par7 d <- data.frame(cbind(z,y,x)) colnames(d) <- list(par7,par6,par5) par1 <- as.numeric(par1) par2 <- as.numeric(par2) if (par1>500) par1 <- 500 if (par2>500) par2 <- 500 if (par1<10) par1 <- 10 if (par2<10) par2 <- 10 library(GenKern) library(lattice) panel.hist <- function(x, ...) { usr <- par('usr'); on.exit(par(usr)) par(usr = c(usr[1:2], 0, 1.5) ) h <- hist(x, plot = FALSE) breaks <- h$breaks; nB <- length(breaks) y <- h$counts; y <- y/max(y) rect(breaks[-nB], 0, breaks[-1], y, col='black', ...) } bitmap(file='cloud1.png') cloud(z~x*y, screen = list(x=-45, y=45, z=35),xlab=par5,ylab=par6,zlab=par7) dev.off() bitmap(file='cloud2.png') cloud(z~x*y, screen = list(x=35, y=45, z=25),xlab=par5,ylab=par6,zlab=par7) dev.off() bitmap(file='cloud3.png') cloud(z~x*y, screen = list(x=35, y=-25, z=90),xlab=par5,ylab=par6,zlab=par7) dev.off() bitmap(file='pairs.png') pairs(d,diag.panel=panel.hist) dev.off() x <- as.vector(x) y <- as.vector(y) z <- as.vector(z) bitmap(file='bidensity1.png') op <- KernSur(x,y, xgridsize=par1, ygridsize=par2, correlation=cor(x,y), xbandwidth=dpik(x), ybandwidth=dpik(y)) image(op$xords, op$yords, op$zden, col=terrain.colors(100), axes=TRUE,main='Bivariate Kernel Density Plot (x,y)',xlab=par5,ylab=par6) if (par3=='Y') contour(op$xords, op$yords, op$zden, add=TRUE) if (par4=='Y') points(x,y) (r<-lm(y ~ x)) abline(r) box() dev.off() bitmap(file='bidensity2.png') op <- KernSur(y,z, xgridsize=par1, ygridsize=par2, correlation=cor(y,z), xbandwidth=dpik(y), ybandwidth=dpik(z)) op image(op$xords, op$yords, op$zden, col=terrain.colors(100), axes=TRUE,main='Bivariate Kernel Density Plot (y,z)',xlab=par6,ylab=par7) if (par3=='Y') contour(op$xords, op$yords, op$zden, add=TRUE) if (par4=='Y') points(y,z) (r<-lm(z ~ y)) abline(r) box() dev.off() bitmap(file='bidensity3.png') op <- KernSur(x,z, xgridsize=par1, ygridsize=par2, correlation=cor(x,z), xbandwidth=dpik(x), ybandwidth=dpik(z)) op image(op$xords, op$yords, op$zden, col=terrain.colors(100), axes=TRUE,main='Bivariate Kernel Density Plot (x,z)',xlab=par5,ylab=par7) if (par3=='Y') contour(op$xords, op$yords, op$zden, add=TRUE) if (par4=='Y') points(x,z) (r<-lm(z ~ x)) abline(r) box() dev.off() | Copyright
Software written by Ed van Stee & Patrick Wessa Disclaimer Information provided on this web site is provided "AS IS" without warranty of any kind, either express or implied, including, without limitation, warranties of merchantability, fitness for a particular purpose, and noninfringement. We use reasonable efforts to include accurate and timely information and periodically update the information, and software without notice. However, we make no warranties or representations as to the accuracy or completeness of such information (or software), and we assume no liability or responsibility for errors or omissions in the content of this web site, or any software bugs in online applications. Your use of this web site is AT YOUR OWN RISK. Under no circumstances and under no legal theory shall we be liable to you or any other person for any direct, indirect, special, incidental, exemplary, or consequential damages arising from your access to, or use of, this web site. Privacy Policy We may request personal information to be submitted to our servers in order to be able to:
We NEVER allow other companies to directly offer registered users information about their products and services. Banner references and hyperlinks of third parties NEVER contain any personal data of the visitor. We do NOT sell, nor transmit by any means, personal information, nor statistical data series uploaded by you to third parties.
We store a unique ANONYMOUS USER ID in the form of a small 'Cookie' on your computer. This allows us to track your progress when using this website which is necessary to create state-dependent features. The cookie is used for NO OTHER PURPOSE. At any time you may opt to disallow cookies from this website - this will not affect other features of this website. We examine cookies that are used by third-parties (banner and online ads) very closely: abuse from third-parties automatically results in termination of the advertising contract without refund. We have very good reason to believe that the cookies that are produced by third parties (banner ads) do NOT cause any privacy or security risk. FreeStatistics.org is safe. There is no need to download any software to use the applications and services contained in this website. Hence, your system's security is not compromised by their use, and your personal data - other than data you submit in the account application form, and the user-agent information that is transmitted by your browser - is never transmitted to our servers. As a general rule, we do not log on-line behavior of individuals (other than normal logging of webserver 'hits'). However, in cases of abuse, hacking, unauthorized access, Denial of Service attacks, illegal copying, hotlinking, non-compliance with international webstandards (such as robots.txt), or any other harmful behavior, our system engineers are empowered to log, track, identify, publish, and ban misbehaving individuals - even if this leads to ban entire blocks of IP addresses, or disclosing user's identity. | ||||||||||||||||||||||||||||||||