| *The author of this computation has been verified* | ||||||||||||||||||||||||||||||||||||||||||||
| R Software Module: /rwasp_meanplot.wasp (opens new window with default values) | ||||||||||||||||||||||||||||||||||||||||||||
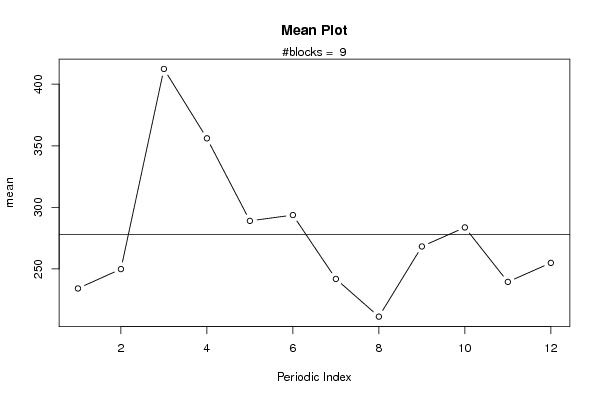
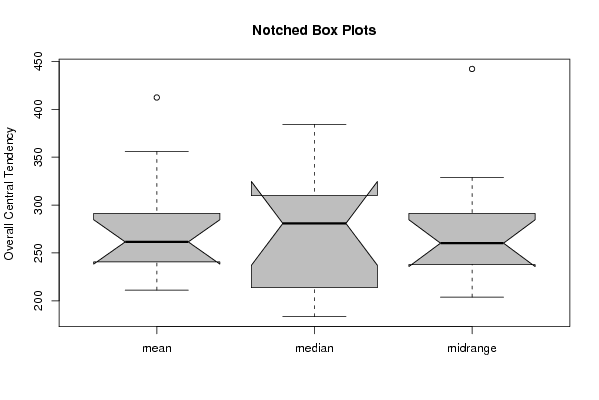
| Title produced by software: Mean Plot | ||||||||||||||||||||||||||||||||||||||||||||
| Date of computation: Tue, 10 Nov 2009 05:08:00 -0700 | ||||||||||||||||||||||||||||||||||||||||||||
| Cite this page as follows: | ||||||||||||||||||||||||||||||||||||||||||||
| Statistical Computations at FreeStatistics.org, Office for Research Development and Education, URL http://www.freestatistics.org/blog/date/2009/Nov/10/t1257855704a4urb6dhlv311cr.htm/, Retrieved Tue, 10 Nov 2009 13:21:53 +0100 | ||||||||||||||||||||||||||||||||||||||||||||
| BibTeX entries for LaTeX users: | ||||||||||||||||||||||||||||||||||||||||||||
@Manual{KEY,
    author = {{YOUR NAME}},
    publisher = {Office for Research Development and Education},
    title = {Statistical Computations at FreeStatistics.org, URL http://www.freestatistics.org/blog/date/2009/Nov/10/t1257855704a4urb6dhlv311cr.htm/},
    year = {2009},
}
@Manual{R,
    title = {R: A Language and Environment for Statistical Computing},
    author = {{R Development Core Team}},
    organization = {R Foundation for Statistical Computing},
    address = {Vienna, Austria},
    year = {2009},
    note = {{ISBN} 3-900051-07-0},
    url = {http://www.R-project.org},
}
| ||||||||||||||||||||||||||||||||||||||||||||
| Original text written by user: | ||||||||||||||||||||||||||||||||||||||||||||
| IsPrivate? | ||||||||||||||||||||||||||||||||||||||||||||
| No (this computation is public) | ||||||||||||||||||||||||||||||||||||||||||||
| User-defined keywords: | ||||||||||||||||||||||||||||||||||||||||||||
| Dataseries X: | ||||||||||||||||||||||||||||||||||||||||||||
| » Textbox « » Textfile « » CSV « | ||||||||||||||||||||||||||||||||||||||||||||
| 100 211.3043478 333.9130435 187.826087 254.7826087 121.7391304 113.9130435 140.8695652 142.6086957 173.9130435 121.7391304 113.9130435 115.6521739 155.6521739 256.5217391 217.3913043 230.4347826 171.3043478 155.6521739 133.0434783 140.8695652 169.5652174 183.4782609 173.9130435 176.5217391 176.5217391 306.9565217 247.826087 171.3043478 140.8695652 171.3043478 153.0434783 184.3478261 236.5217391 177.3913043 164.3478261 208.6956522 211.3043478 403.4782609 328.6956522 261.7391304 254.7826087 277.3913043 282.6086957 357.3913043 284.3478261 183.4782609 186.0869565 179.1304348 175.6521739 317.3913043 375.6521739 277.3913043 313.9130435 203.4782609 199.1304348 240.8695652 238.2608696 258.2608696 335.6521739 302.6086957 373.9130435 570.4347826 382.6086957 307.826087 435.6521739 306.0869565 250.4347826 350.4347826 426.0869565 477.3913043 437.3913043 334.7826087 305.2173913 571.3043478 523.4782609 426.9565217 360.8695652 267.826087 254.78260 etc... | ||||||||||||||||||||||||||||||||||||||||||||
| Output produced by software: | ||||||||||||||||||||||||||||||||||||||||||||
| Charts produced by software: |
| Parameters (Session): | par1 = 0 ; par2 = 0 ; | | Parameters (R input): | par1 = 12 ; par2 = 0 ; | | R code (references can be found in the software module): | par1 <- as.numeric(par1)
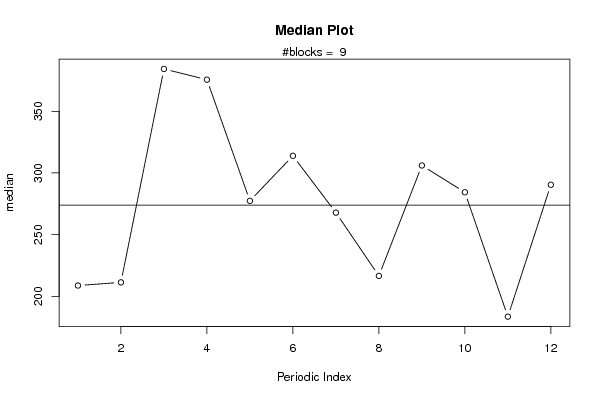
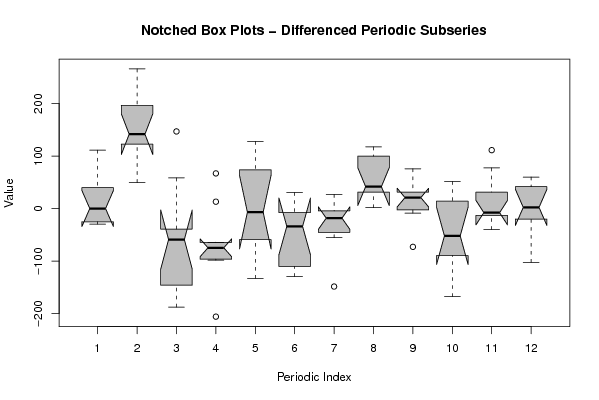
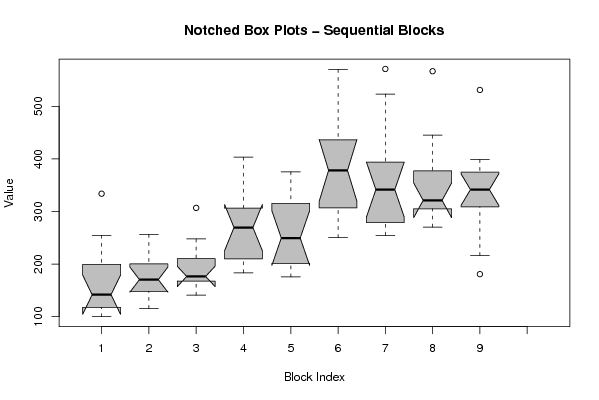
| (n <- length(x)) (np <- floor(n / par1)) arr <- array(NA,dim=c(par1,np+1)) darr <- array(NA,dim=c(par1,np+1)) ari <- array(0,dim=par1) dx <- diff(x) j <- 0 for (i in 1:n) { j = j + 1 ari[j] = ari[j] + 1 arr[j,ari[j]] <- x[i] darr[j,ari[j]] <- dx[i] if (j == par1) j = 0 } ari arr darr arr.mean <- array(NA,dim=par1) arr.median <- array(NA,dim=par1) arr.midrange <- array(NA,dim=par1) for (j in 1:par1) { arr.mean[j] <- mean(arr[j,],na.rm=TRUE) arr.median[j] <- median(arr[j,],na.rm=TRUE) arr.midrange[j] <- (quantile(arr[j,],0.75,na.rm=TRUE) + quantile(arr[j,],0.25,na.rm=TRUE)) / 2 } overall.mean <- mean(x) overall.median <- median(x) overall.midrange <- (quantile(x,0.75) + quantile(x,0.25)) / 2 bitmap(file='plot1.png') plot(arr.mean,type='b',ylab='mean',main='Mean Plot',xlab='Periodic Index') mtext(paste('#blocks = ',np)) abline(overall.mean,0) dev.off() bitmap(file='plot2.png') plot(arr.median,type='b',ylab='median',main='Median Plot',xlab='Periodic Index') mtext(paste('#blocks = ',np)) abline(overall.median,0) dev.off() bitmap(file='plot3.png') plot(arr.midrange,type='b',ylab='midrange',main='Midrange Plot',xlab='Periodic Index') mtext(paste('#blocks = ',np)) abline(overall.midrange,0) dev.off() bitmap(file='plot4.png') z <- data.frame(t(arr)) names(z) <- c(1:par1) (boxplot(z,notch=TRUE,col='grey',xlab='Periodic Index',ylab='Value',main='Notched Box Plots - Periodic Subseries')) dev.off() bitmap(file='plot4b.png') z <- data.frame(t(darr)) names(z) <- c(1:par1) (boxplot(z,notch=TRUE,col='grey',xlab='Periodic Index',ylab='Value',main='Notched Box Plots - Differenced Periodic Subseries')) dev.off() bitmap(file='plot5.png') z <- data.frame(arr) names(z) <- c(1:np) (boxplot(z,notch=TRUE,col='grey',xlab='Block Index',ylab='Value',main='Notched Box Plots - Sequential Blocks')) dev.off() bitmap(file='plot6.png') z <- data.frame(cbind(arr.mean,arr.median,arr.midrange)) names(z) <- list('mean','median','midrange') (boxplot(z,notch=TRUE,col='grey',ylab='Overall Central Tendency',main='Notched Box Plots')) dev.off() | Copyright
Software written by Ed van Stee & Patrick Wessa Disclaimer Information provided on this web site is provided "AS IS" without warranty of any kind, either express or implied, including, without limitation, warranties of merchantability, fitness for a particular purpose, and noninfringement. We use reasonable efforts to include accurate and timely information and periodically update the information, and software without notice. However, we make no warranties or representations as to the accuracy or completeness of such information (or software), and we assume no liability or responsibility for errors or omissions in the content of this web site, or any software bugs in online applications. Your use of this web site is AT YOUR OWN RISK. Under no circumstances and under no legal theory shall we be liable to you or any other person for any direct, indirect, special, incidental, exemplary, or consequential damages arising from your access to, or use of, this web site. Privacy Policy We may request personal information to be submitted to our servers in order to be able to:
We NEVER allow other companies to directly offer registered users information about their products and services. Banner references and hyperlinks of third parties NEVER contain any personal data of the visitor. We do NOT sell, nor transmit by any means, personal information, nor statistical data series uploaded by you to third parties.
We store a unique ANONYMOUS USER ID in the form of a small 'Cookie' on your computer. This allows us to track your progress when using this website which is necessary to create state-dependent features. The cookie is used for NO OTHER PURPOSE. At any time you may opt to disallow cookies from this website - this will not affect other features of this website. We examine cookies that are used by third-parties (banner and online ads) very closely: abuse from third-parties automatically results in termination of the advertising contract without refund. We have very good reason to believe that the cookies that are produced by third parties (banner ads) do NOT cause any privacy or security risk. FreeStatistics.org is safe. There is no need to download any software to use the applications and services contained in this website. Hence, your system's security is not compromised by their use, and your personal data - other than data you submit in the account application form, and the user-agent information that is transmitted by your browser - is never transmitted to our servers. As a general rule, we do not log on-line behavior of individuals (other than normal logging of webserver 'hits'). However, in cases of abuse, hacking, unauthorized access, Denial of Service attacks, illegal copying, hotlinking, non-compliance with international webstandards (such as robots.txt), or any other harmful behavior, our system engineers are empowered to log, track, identify, publish, and ban misbehaving individuals - even if this leads to ban entire blocks of IP addresses, or disclosing user's identity. | ||||||||||||||||||||||||||||||||