| *The author of this computation has been verified* | ||||||||||||||||||||||||||||||||||||||||||||
| R Software Module: /rwasp_meanplot.wasp (opens new window with default values) | ||||||||||||||||||||||||||||||||||||||||||||
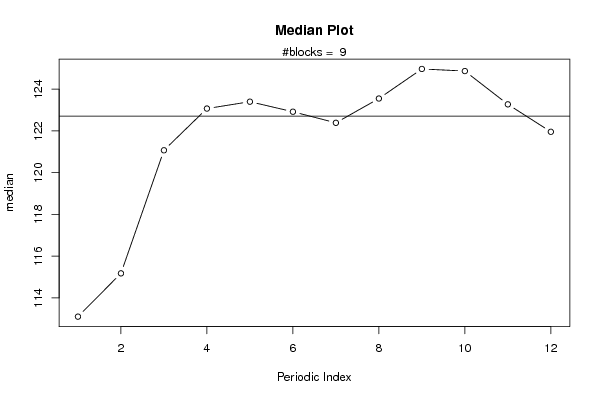
| Title produced by software: Mean Plot | ||||||||||||||||||||||||||||||||||||||||||||
| Date of computation: Wed, 11 Nov 2009 14:44:05 -0700 | ||||||||||||||||||||||||||||||||||||||||||||
| Cite this page as follows: | ||||||||||||||||||||||||||||||||||||||||||||
| Statistical Computations at FreeStatistics.org, Office for Research Development and Education, URL http://www.freestatistics.org/blog/date/2009/Nov/11/t1257975905st77gno053khord.htm/, Retrieved Wed, 11 Nov 2009 22:45:13 +0100 | ||||||||||||||||||||||||||||||||||||||||||||
| BibTeX entries for LaTeX users: | ||||||||||||||||||||||||||||||||||||||||||||
@Manual{KEY,
    author = {{YOUR NAME}},
    publisher = {Office for Research Development and Education},
    title = {Statistical Computations at FreeStatistics.org, URL http://www.freestatistics.org/blog/date/2009/Nov/11/t1257975905st77gno053khord.htm/},
    year = {2009},
}
@Manual{R,
    title = {R: A Language and Environment for Statistical Computing},
    author = {{R Development Core Team}},
    organization = {R Foundation for Statistical Computing},
    address = {Vienna, Austria},
    year = {2009},
    note = {{ISBN} 3-900051-07-0},
    url = {http://www.R-project.org},
}
| ||||||||||||||||||||||||||||||||||||||||||||
| Original text written by user: | ||||||||||||||||||||||||||||||||||||||||||||
| IsPrivate? | ||||||||||||||||||||||||||||||||||||||||||||
| No (this computation is public) | ||||||||||||||||||||||||||||||||||||||||||||
| User-defined keywords: | ||||||||||||||||||||||||||||||||||||||||||||
| Dataseries X: | ||||||||||||||||||||||||||||||||||||||||||||
| » Textbox « » Textfile « » CSV « | ||||||||||||||||||||||||||||||||||||||||||||
| 100 99.94940551 102.0743739 102.0237794 102.6309132 102.8838857 103.0103719 104.3258285 105.211232 104.7305844 104.174045 103.6933974 104.3258285 105.211232 105.3124209 105.5400961 106.7037693 106.6025803 105.008854 104.3258285 104.174045 103.4151278 102.3273463 101.8214015 103.5669112 103.8957754 104.5788009 105.0341513 105.6665823 105.6918796 105.7171768 105.843663 105.7930686 105.3883127 105.9701493 106.5013913 107.1338224 109.3599798 109.3599798 108.4239818 107.9433342 108.0951176 108.3986845 110.5489502 111.8138123 112.5474323 111.6620288 111.3837592 113.1039717 115.1783456 121.0726031 123.0710853 123.3999494 122.9193018 122.3880597 123.5517329 124.9683784 124.8671895 123.2734632 121.9580066 122.4892487 125.6767012 126.7644827 126.4356185 125.3478371 126.0055654 127.4475082 130.5843663 133.0887933 133.3417657 132.8358209 133.7971161 136.6304073 138.8818619 140.6526689 143.9160132 149.0260562 149.3296231 152.6182646 161.5987857 etc... | ||||||||||||||||||||||||||||||||||||||||||||
| Output produced by software: | ||||||||||||||||||||||||||||||||||||||||||||
| Charts produced by software: |
| Parameters (Session): | par1 = 12 ; | | Parameters (R input): | par1 = 12 ; | | R code (references can be found in the software module): | par1 <- as.numeric(par1)
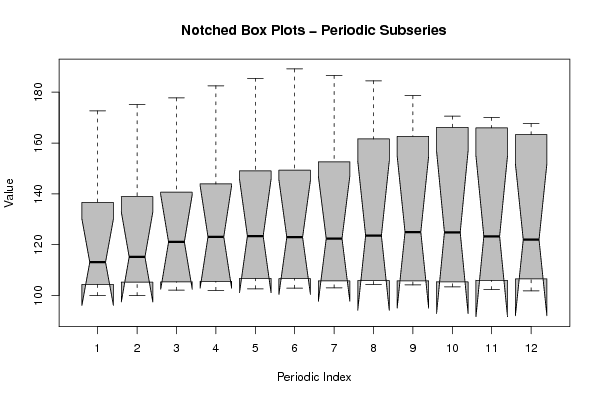
| (n <- length(x)) (np <- floor(n / par1)) arr <- array(NA,dim=c(par1,np+1)) darr <- array(NA,dim=c(par1,np+1)) ari <- array(0,dim=par1) dx <- diff(x) j <- 0 for (i in 1:n) { j = j + 1 ari[j] = ari[j] + 1 arr[j,ari[j]] <- x[i] darr[j,ari[j]] <- dx[i] if (j == par1) j = 0 } ari arr darr arr.mean <- array(NA,dim=par1) arr.median <- array(NA,dim=par1) arr.midrange <- array(NA,dim=par1) for (j in 1:par1) { arr.mean[j] <- mean(arr[j,],na.rm=TRUE) arr.median[j] <- median(arr[j,],na.rm=TRUE) arr.midrange[j] <- (quantile(arr[j,],0.75,na.rm=TRUE) + quantile(arr[j,],0.25,na.rm=TRUE)) / 2 } overall.mean <- mean(x) overall.median <- median(x) overall.midrange <- (quantile(x,0.75) + quantile(x,0.25)) / 2 bitmap(file='plot1.png') plot(arr.mean,type='b',ylab='mean',main='Mean Plot',xlab='Periodic Index') mtext(paste('#blocks = ',np)) abline(overall.mean,0) dev.off() bitmap(file='plot2.png') plot(arr.median,type='b',ylab='median',main='Median Plot',xlab='Periodic Index') mtext(paste('#blocks = ',np)) abline(overall.median,0) dev.off() bitmap(file='plot3.png') plot(arr.midrange,type='b',ylab='midrange',main='Midrange Plot',xlab='Periodic Index') mtext(paste('#blocks = ',np)) abline(overall.midrange,0) dev.off() bitmap(file='plot4.png') z <- data.frame(t(arr)) names(z) <- c(1:par1) (boxplot(z,notch=TRUE,col='grey',xlab='Periodic Index',ylab='Value',main='Notched Box Plots - Periodic Subseries')) dev.off() bitmap(file='plot4b.png') z <- data.frame(t(darr)) names(z) <- c(1:par1) (boxplot(z,notch=TRUE,col='grey',xlab='Periodic Index',ylab='Value',main='Notched Box Plots - Differenced Periodic Subseries')) dev.off() bitmap(file='plot5.png') z <- data.frame(arr) names(z) <- c(1:np) (boxplot(z,notch=TRUE,col='grey',xlab='Block Index',ylab='Value',main='Notched Box Plots - Sequential Blocks')) dev.off() bitmap(file='plot6.png') z <- data.frame(cbind(arr.mean,arr.median,arr.midrange)) names(z) <- list('mean','median','midrange') (boxplot(z,notch=TRUE,col='grey',ylab='Overall Central Tendency',main='Notched Box Plots')) dev.off() | Copyright
Software written by Ed van Stee & Patrick Wessa Disclaimer Information provided on this web site is provided "AS IS" without warranty of any kind, either express or implied, including, without limitation, warranties of merchantability, fitness for a particular purpose, and noninfringement. We use reasonable efforts to include accurate and timely information and periodically update the information, and software without notice. However, we make no warranties or representations as to the accuracy or completeness of such information (or software), and we assume no liability or responsibility for errors or omissions in the content of this web site, or any software bugs in online applications. Your use of this web site is AT YOUR OWN RISK. Under no circumstances and under no legal theory shall we be liable to you or any other person for any direct, indirect, special, incidental, exemplary, or consequential damages arising from your access to, or use of, this web site. Privacy Policy We may request personal information to be submitted to our servers in order to be able to:
We NEVER allow other companies to directly offer registered users information about their products and services. Banner references and hyperlinks of third parties NEVER contain any personal data of the visitor. We do NOT sell, nor transmit by any means, personal information, nor statistical data series uploaded by you to third parties.
We store a unique ANONYMOUS USER ID in the form of a small 'Cookie' on your computer. This allows us to track your progress when using this website which is necessary to create state-dependent features. The cookie is used for NO OTHER PURPOSE. At any time you may opt to disallow cookies from this website - this will not affect other features of this website. We examine cookies that are used by third-parties (banner and online ads) very closely: abuse from third-parties automatically results in termination of the advertising contract without refund. We have very good reason to believe that the cookies that are produced by third parties (banner ads) do NOT cause any privacy or security risk. FreeStatistics.org is safe. There is no need to download any software to use the applications and services contained in this website. Hence, your system's security is not compromised by their use, and your personal data - other than data you submit in the account application form, and the user-agent information that is transmitted by your browser - is never transmitted to our servers. As a general rule, we do not log on-line behavior of individuals (other than normal logging of webserver 'hits'). However, in cases of abuse, hacking, unauthorized access, Denial of Service attacks, illegal copying, hotlinking, non-compliance with international webstandards (such as robots.txt), or any other harmful behavior, our system engineers are empowered to log, track, identify, publish, and ban misbehaving individuals - even if this leads to ban entire blocks of IP addresses, or disclosing user's identity. | ||||||||||||||||||||||||||||||||