ws3- assumpties Y(t) * X(t) | ||||||||||||||||||||||||||||||||||||||||||||||||||||||||||||
| *Unverified author* | ||||||||||||||||||||||||||||||||||||||||||||||||||||||||||||
| R Software Module: rwasp_edauni.wasp (opens new window with default values) | ||||||||||||||||||||||||||||||||||||||||||||||||||||||||||||
| Title produced by software: Univariate Explorative Data Analysis | ||||||||||||||||||||||||||||||||||||||||||||||||||||||||||||
| Date of computation: Tue, 20 Oct 2009 14:33:15 -0600 | ||||||||||||||||||||||||||||||||||||||||||||||||||||||||||||
| Cite this page as follows: | ||||||||||||||||||||||||||||||||||||||||||||||||||||||||||||
| Statistical Computations at FreeStatistics.org, Office for Research Development and Education, URL http://www.freestatistics.org/blog/date/2009/Oct/20/t1256070846616sxst1cu9up05.htm/, Retrieved Tue, 20 Oct 2009 22:34:06 +0200 | ||||||||||||||||||||||||||||||||||||||||||||||||||||||||||||
| BibTeX entries for LaTeX users: | ||||||||||||||||||||||||||||||||||||||||||||||||||||||||||||
@Manual{KEY,
    author = {{YOUR NAME}},
    publisher = {Office for Research Development and Education},
    title = {Statistical Computations at FreeStatistics.org, URL http://www.freestatistics.org/blog/date/2009/Oct/20/t1256070846616sxst1cu9up05.htm/},
    year = {2009},
}
@Manual{R,
    title = {R: A Language and Environment for Statistical Computing},
    author = {{R Development Core Team}},
    organization = {R Foundation for Statistical Computing},
    address = {Vienna, Austria},
    year = {2009},
    note = {{ISBN} 3-900051-07-0},
    url = {http://www.R-project.org},
}
| ||||||||||||||||||||||||||||||||||||||||||||||||||||||||||||
| Original text written by user: | ||||||||||||||||||||||||||||||||||||||||||||||||||||||||||||
| IsPrivate? | ||||||||||||||||||||||||||||||||||||||||||||||||||||||||||||
| No (this computation is public) | ||||||||||||||||||||||||||||||||||||||||||||||||||||||||||||
| User-defined keywords: | ||||||||||||||||||||||||||||||||||||||||||||||||||||||||||||
| Dataseries X: | ||||||||||||||||||||||||||||||||||||||||||||||||||||||||||||
| » Textbox « » Textfile « » CSV « | ||||||||||||||||||||||||||||||||||||||||||||||||||||||||||||
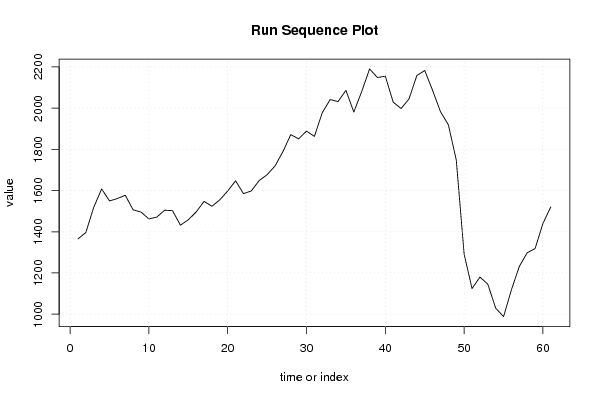
| 1365.556988 1396.46943 1518.569954 1607.900768 1549.87866 1561.198482 1577.38749 1506.526596 1495.708632 1462.537125 1471.210288 1504.872684 1502.475296 1432.13994 1458.364282 1496.310192 1547.634816 1524.06477 1555.18366 1597.905078 1647.33 1585.1968 1598.488416 1648.967865 1677.176787 1719.358518 1788.694303 1871.515746 1851.265584 1888.73541 1863.08319 1978.26934 2041.701254 2032.294131 2086.176168 1981.483364 2080.397952 2190.474282 2148.841876 2155.23811 2029.258968 1998.162276 2044.812738 2158.49025 2182.989354 2086.046125 1982.80941 1919.001325 1748.606717 1291.074986 1124.286528 1180.042158 1145.941362 1029.486555 988.05465 1118.9077 1231.78965 1298.035776 1318.383216 1440.668496 1521.07371 | ||||||||||||||||||||||||||||||||||||||||||||||||||||||||||||
| Output produced by software: | ||||||||||||||||||||||||||||||||||||||||||||||||||||||||||||
| Charts produced by software: |
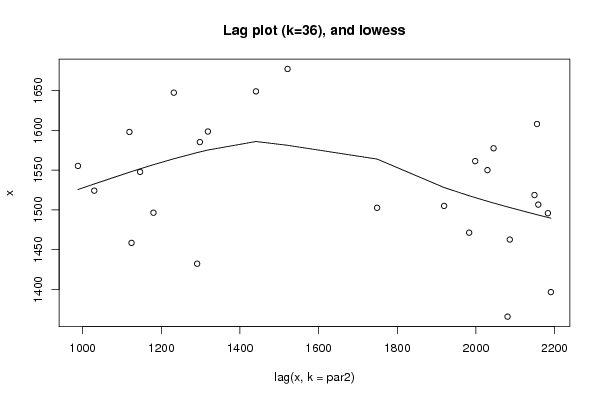
| Parameters (Session): | par1 = 1 ; par2 = 36 ; | | Parameters (R input): | par1 = 1 ; par2 = 36 ; | | R code (references can be found in the software module): | par1 <- as.numeric(par1)
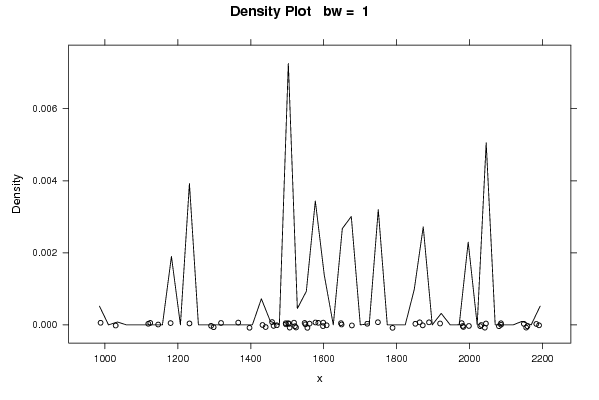
| par2 <- as.numeric(par2) x <- as.ts(x) library(lattice) bitmap(file='pic1.png') plot(x,type='l',main='Run Sequence Plot',xlab='time or index',ylab='value') grid() dev.off() bitmap(file='pic2.png') hist(x) grid() dev.off() bitmap(file='pic3.png') if (par1 > 0) { densityplot(~x,col='black',main=paste('Density Plot bw = ',par1),bw=par1) } else { densityplot(~x,col='black',main='Density Plot') } dev.off() bitmap(file='pic4.png') qqnorm(x) qqline(x) grid() dev.off() if (par2 > 0) { bitmap(file='lagplot1.png') dum <- cbind(lag(x,k=1),x) dum dum1 <- dum[2:length(x),] dum1 z <- as.data.frame(dum1) z plot(z,main='Lag plot (k=1), lowess, and regression line') lines(lowess(z)) abline(lm(z)) dev.off() if (par2 > 1) { bitmap(file='lagplotpar2.png') dum <- cbind(lag(x,k=par2),x) dum dum1 <- dum[(par2+1):length(x),] dum1 z <- as.data.frame(dum1) z mylagtitle <- 'Lag plot (k=' mylagtitle <- paste(mylagtitle,par2,sep='') mylagtitle <- paste(mylagtitle,'), and lowess',sep='') plot(z,main=mylagtitle) lines(lowess(z)) dev.off() } bitmap(file='pic5.png') acf(x,lag.max=par2,main='Autocorrelation Function') grid() dev.off() } summary(x) load(file='createtable') a<-table.start() a<-table.row.start(a) a<-table.element(a,'Descriptive Statistics',2,TRUE) a<-table.row.end(a) a<-table.row.start(a) a<-table.element(a,'# observations',header=TRUE) a<-table.element(a,length(x)) a<-table.row.end(a) a<-table.row.start(a) a<-table.element(a,'minimum',header=TRUE) a<-table.element(a,min(x)) a<-table.row.end(a) a<-table.row.start(a) a<-table.element(a,'Q1',header=TRUE) a<-table.element(a,quantile(x,0.25)) a<-table.row.end(a) a<-table.row.start(a) a<-table.element(a,'median',header=TRUE) a<-table.element(a,median(x)) a<-table.row.end(a) a<-table.row.start(a) a<-table.element(a,'mean',header=TRUE) a<-table.element(a,mean(x)) a<-table.row.end(a) a<-table.row.start(a) a<-table.element(a,'Q3',header=TRUE) a<-table.element(a,quantile(x,0.75)) a<-table.row.end(a) a<-table.row.start(a) a<-table.element(a,'maximum',header=TRUE) a<-table.element(a,max(x)) a<-table.row.end(a) a<-table.end(a) table.save(a,file='mytable.tab') | Copyright
Software written by Ed van Stee & Patrick Wessa Disclaimer Information provided on this web site is provided "AS IS" without warranty of any kind, either express or implied, including, without limitation, warranties of merchantability, fitness for a particular purpose, and noninfringement. We use reasonable efforts to include accurate and timely information and periodically update the information, and software without notice. However, we make no warranties or representations as to the accuracy or completeness of such information (or software), and we assume no liability or responsibility for errors or omissions in the content of this web site, or any software bugs in online applications. Your use of this web site is AT YOUR OWN RISK. Under no circumstances and under no legal theory shall we be liable to you or any other person for any direct, indirect, special, incidental, exemplary, or consequential damages arising from your access to, or use of, this web site. Privacy Policy We may request personal information to be submitted to our servers in order to be able to:
We NEVER allow other companies to directly offer registered users information about their products and services. Banner references and hyperlinks of third parties NEVER contain any personal data of the visitor. We do NOT sell, nor transmit by any means, personal information, nor statistical data series uploaded by you to third parties.
We store a unique ANONYMOUS USER ID in the form of a small 'Cookie' on your computer. This allows us to track your progress when using this website which is necessary to create state-dependent features. The cookie is used for NO OTHER PURPOSE. At any time you may opt to disallow cookies from this website - this will not affect other features of this website. We examine cookies that are used by third-parties (banner and online ads) very closely: abuse from third-parties automatically results in termination of the advertising contract without refund. We have very good reason to believe that the cookies that are produced by third parties (banner ads) do NOT cause any privacy or security risk. FreeStatistics.org is safe. There is no need to download any software to use the applications and services contained in this website. Hence, your system's security is not compromised by their use, and your personal data - other than data you submit in the account application form, and the user-agent information that is transmitted by your browser - is never transmitted to our servers. As a general rule, we do not log on-line behavior of individuals (other than normal logging of webserver 'hits'). However, in cases of abuse, hacking, unauthorized access, Denial of Service attacks, illegal copying, hotlinking, non-compliance with international webstandards (such as robots.txt), or any other harmful behavior, our system engineers are empowered to log, track, identify, publish, and ban misbehaving individuals - even if this leads to ban entire blocks of IP addresses, or disclosing user's identity. | ||||||||||||||||||||||||||||||||||||||||||||||||