EDA | ||||||||||||||||||||||||||||||||||||||||||||||||||||||||||||
| *The author of this computation has been verified* | ||||||||||||||||||||||||||||||||||||||||||||||||||||||||||||
| R Software Module: rwasp_edauni.wasp (opens new window with default values) | ||||||||||||||||||||||||||||||||||||||||||||||||||||||||||||
| Title produced by software: Univariate Explorative Data Analysis | ||||||||||||||||||||||||||||||||||||||||||||||||||||||||||||
| Date of computation: Mon, 26 Oct 2009 12:26:33 -0600 | ||||||||||||||||||||||||||||||||||||||||||||||||||||||||||||
| Cite this page as follows: | ||||||||||||||||||||||||||||||||||||||||||||||||||||||||||||
| Statistical Computations at FreeStatistics.org, Office for Research Development and Education, URL http://www.freestatistics.org/blog/date/2009/Oct/26/t1256581748gry93texywb6dyu.htm/, Retrieved Mon, 26 Oct 2009 19:29:16 +0100 | ||||||||||||||||||||||||||||||||||||||||||||||||||||||||||||
| BibTeX entries for LaTeX users: | ||||||||||||||||||||||||||||||||||||||||||||||||||||||||||||
@Manual{KEY,
    author = {{YOUR NAME}},
    publisher = {Office for Research Development and Education},
    title = {Statistical Computations at FreeStatistics.org, URL http://www.freestatistics.org/blog/date/2009/Oct/26/t1256581748gry93texywb6dyu.htm/},
    year = {2009},
}
@Manual{R,
    title = {R: A Language and Environment for Statistical Computing},
    author = {{R Development Core Team}},
    organization = {R Foundation for Statistical Computing},
    address = {Vienna, Austria},
    year = {2009},
    note = {{ISBN} 3-900051-07-0},
    url = {http://www.R-project.org},
}
| ||||||||||||||||||||||||||||||||||||||||||||||||||||||||||||
| Original text written by user: | ||||||||||||||||||||||||||||||||||||||||||||||||||||||||||||
| IsPrivate? | ||||||||||||||||||||||||||||||||||||||||||||||||||||||||||||
| No (this computation is public) | ||||||||||||||||||||||||||||||||||||||||||||||||||||||||||||
| User-defined keywords: | ||||||||||||||||||||||||||||||||||||||||||||||||||||||||||||
| EDA | ||||||||||||||||||||||||||||||||||||||||||||||||||||||||||||
| Dataseries X: | ||||||||||||||||||||||||||||||||||||||||||||||||||||||||||||
| » Textbox « » Textfile « » CSV « | ||||||||||||||||||||||||||||||||||||||||||||||||||||||||||||
| 376643 370037 358182 356625 348675 347652 368859 381303 367753 361112 350758 350754 357631 354425 346660 345181 342994 339946 361758 370490 373040 371009 354179 357361 363037 364153 363434 358410 356551 357445 379570 377613 376404 379665 378899 384098 392105 394149 392231 395590 392491 395893 418584 420585 420064 417696 409837 417869 426174 427853 429778 423952 422504 426529 440727 449002 451671 461854 454959 460866 460543 462768 462027 455748 455321 456149 472006 471654 471011 465436 458880 465030 468082 467356 463184 460486 462038 460849 476002 475863 470769 453286 443059 441660 444010 437582 427064 424117 416496 405611 431233 434217 417711 412099 404315 409339 412140 406280 398077 396995 385326 390094 412512 413263 400937 397363 397347 409383 418885 423560 428029 430001 424400 432721 455894 459146 445819 | ||||||||||||||||||||||||||||||||||||||||||||||||||||||||||||
| Output produced by software: | ||||||||||||||||||||||||||||||||||||||||||||||||||||||||||||
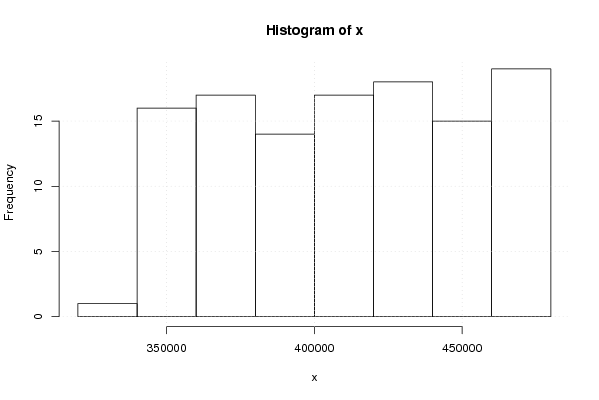
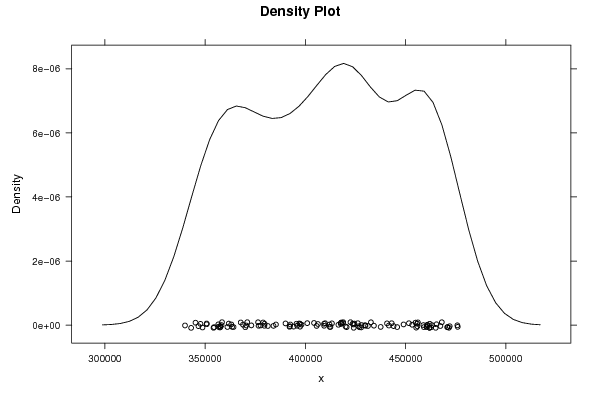
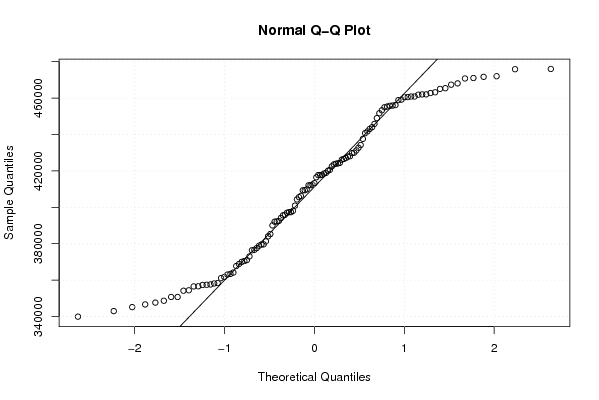
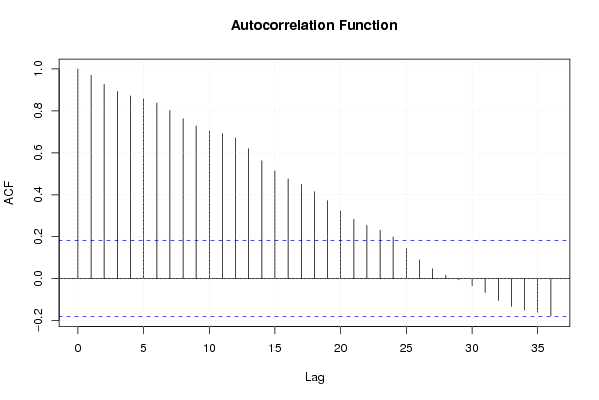
| Charts produced by software: |
| Parameters (Session): | par1 = 0 ; par2 = 36 ; | | Parameters (R input): | par1 = 0 ; par2 = 36 ; | | R code (references can be found in the software module): | par1 <- as.numeric(par1)
| par2 <- as.numeric(par2) x <- as.ts(x) library(lattice) bitmap(file='pic1.png') plot(x,type='l',main='Run Sequence Plot',xlab='time or index',ylab='value') grid() dev.off() bitmap(file='pic2.png') hist(x) grid() dev.off() bitmap(file='pic3.png') if (par1 > 0) { densityplot(~x,col='black',main=paste('Density Plot bw = ',par1),bw=par1) } else { densityplot(~x,col='black',main='Density Plot') } dev.off() bitmap(file='pic4.png') qqnorm(x) qqline(x) grid() dev.off() if (par2 > 0) { bitmap(file='lagplot1.png') dum <- cbind(lag(x,k=1),x) dum dum1 <- dum[2:length(x),] dum1 z <- as.data.frame(dum1) z plot(z,main='Lag plot (k=1), lowess, and regression line') lines(lowess(z)) abline(lm(z)) dev.off() if (par2 > 1) { bitmap(file='lagplotpar2.png') dum <- cbind(lag(x,k=par2),x) dum dum1 <- dum[(par2+1):length(x),] dum1 z <- as.data.frame(dum1) z mylagtitle <- 'Lag plot (k=' mylagtitle <- paste(mylagtitle,par2,sep='') mylagtitle <- paste(mylagtitle,'), and lowess',sep='') plot(z,main=mylagtitle) lines(lowess(z)) dev.off() } bitmap(file='pic5.png') acf(x,lag.max=par2,main='Autocorrelation Function') grid() dev.off() } summary(x) load(file='createtable') a<-table.start() a<-table.row.start(a) a<-table.element(a,'Descriptive Statistics',2,TRUE) a<-table.row.end(a) a<-table.row.start(a) a<-table.element(a,'# observations',header=TRUE) a<-table.element(a,length(x)) a<-table.row.end(a) a<-table.row.start(a) a<-table.element(a,'minimum',header=TRUE) a<-table.element(a,min(x)) a<-table.row.end(a) a<-table.row.start(a) a<-table.element(a,'Q1',header=TRUE) a<-table.element(a,quantile(x,0.25)) a<-table.row.end(a) a<-table.row.start(a) a<-table.element(a,'median',header=TRUE) a<-table.element(a,median(x)) a<-table.row.end(a) a<-table.row.start(a) a<-table.element(a,'mean',header=TRUE) a<-table.element(a,mean(x)) a<-table.row.end(a) a<-table.row.start(a) a<-table.element(a,'Q3',header=TRUE) a<-table.element(a,quantile(x,0.75)) a<-table.row.end(a) a<-table.row.start(a) a<-table.element(a,'maximum',header=TRUE) a<-table.element(a,max(x)) a<-table.row.end(a) a<-table.end(a) table.save(a,file='mytable.tab') | Copyright
Software written by Ed van Stee & Patrick Wessa Disclaimer Information provided on this web site is provided "AS IS" without warranty of any kind, either express or implied, including, without limitation, warranties of merchantability, fitness for a particular purpose, and noninfringement. We use reasonable efforts to include accurate and timely information and periodically update the information, and software without notice. However, we make no warranties or representations as to the accuracy or completeness of such information (or software), and we assume no liability or responsibility for errors or omissions in the content of this web site, or any software bugs in online applications. Your use of this web site is AT YOUR OWN RISK. Under no circumstances and under no legal theory shall we be liable to you or any other person for any direct, indirect, special, incidental, exemplary, or consequential damages arising from your access to, or use of, this web site. Privacy Policy We may request personal information to be submitted to our servers in order to be able to:
We NEVER allow other companies to directly offer registered users information about their products and services. Banner references and hyperlinks of third parties NEVER contain any personal data of the visitor. We do NOT sell, nor transmit by any means, personal information, nor statistical data series uploaded by you to third parties.
We store a unique ANONYMOUS USER ID in the form of a small 'Cookie' on your computer. This allows us to track your progress when using this website which is necessary to create state-dependent features. The cookie is used for NO OTHER PURPOSE. At any time you may opt to disallow cookies from this website - this will not affect other features of this website. We examine cookies that are used by third-parties (banner and online ads) very closely: abuse from third-parties automatically results in termination of the advertising contract without refund. We have very good reason to believe that the cookies that are produced by third parties (banner ads) do NOT cause any privacy or security risk. FreeStatistics.org is safe. There is no need to download any software to use the applications and services contained in this website. Hence, your system's security is not compromised by their use, and your personal data - other than data you submit in the account application form, and the user-agent information that is transmitted by your browser - is never transmitted to our servers. As a general rule, we do not log on-line behavior of individuals (other than normal logging of webserver 'hits'). However, in cases of abuse, hacking, unauthorized access, Denial of Service attacks, illegal copying, hotlinking, non-compliance with international webstandards (such as robots.txt), or any other harmful behavior, our system engineers are empowered to log, track, identify, publish, and ban misbehaving individuals - even if this leads to ban entire blocks of IP addresses, or disclosing user's identity. | ||||||||||||||||||||||||||||||||||||||||||||||||