| *The author of this computation has been verified* | ||||||||||||||||||||||||||||||
| R Software Module: /rwasp_linear_regression.wasp (opens new window with default values) | ||||||||||||||||||||||||||||||
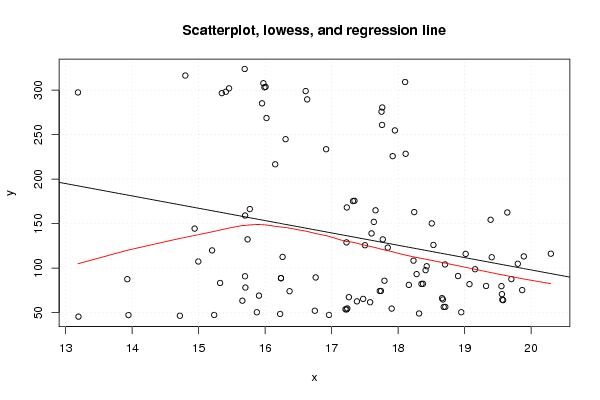
| Title produced by software: Linear Regression Graphical Model Validation | ||||||||||||||||||||||||||||||
| Date of computation: Fri, 17 Dec 2010 16:29:12 +0000 | ||||||||||||||||||||||||||||||
| Cite this page as follows: | ||||||||||||||||||||||||||||||
| Statistical Computations at FreeStatistics.org, Office for Research Development and Education, URL http://www.freestatistics.org/blog/date/2010/Dec/17/t12926032660jkm9745o4xoiqd.htm/, Retrieved Fri, 17 Dec 2010 17:27:55 +0100 | ||||||||||||||||||||||||||||||
| BibTeX entries for LaTeX users: | ||||||||||||||||||||||||||||||
@Manual{KEY,
    author = {{YOUR NAME}},
    publisher = {Office for Research Development and Education},
    title = {Statistical Computations at FreeStatistics.org, URL http://www.freestatistics.org/blog/date/2010/Dec/17/t12926032660jkm9745o4xoiqd.htm/},
    year = {2010},
}
@Manual{R,
    title = {R: A Language and Environment for Statistical Computing},
    author = {{R Development Core Team}},
    organization = {R Foundation for Statistical Computing},
    address = {Vienna, Austria},
    year = {2010},
    note = {{ISBN} 3-900051-07-0},
    url = {http://www.R-project.org},
}
| ||||||||||||||||||||||||||||||
| Original text written by user: | ||||||||||||||||||||||||||||||
| IsPrivate? | ||||||||||||||||||||||||||||||
| No (this computation is public) | ||||||||||||||||||||||||||||||
| User-defined keywords: | ||||||||||||||||||||||||||||||
| Dataseries X: | ||||||||||||||||||||||||||||||
| » Textbox « » Textfile « » CSV « | ||||||||||||||||||||||||||||||
| 13.193 15.234 14.718 16.961 13.945 15.876 16.226 18.316 16.748 17.904 17.209 18.950 17.225 18.710 17.236 18.687 17.580 19.568 17.381 19.580 17.260 18.661 15.658 18.674 15.908 17.475 17.725 19.562 16.368 19.555 17.743 19.867 15.703 19.324 18.162 19.074 15.323 19.704 18.375 18.352 13.927 17.795 16.761 18.902 16.239 19.158 18.279 15.698 16.239 18.431 18.414 19.801 14.995 18.706 18.232 19.409 16.263 19.017 20.298 19.891 15.203 17.845 17.502 18.532 15.737 17.770 17.224 17.601 14.940 18.507 17.635 19.392 15.699 17.661 18.243 19.643 15.770 17.344 17.229 17.322 16.152 17.919 16.918 18.114 16.308 17.759 16.021 17.952 15.954 17.762 16.610 17.751 15.458 18.106 15.990 15.349 13.185 15.409 16.007 16.633 14.800 15.974 15.693 | ||||||||||||||||||||||||||||||
| Dataseries Y: | ||||||||||||||||||||||||||||||
| » Textbox « » Textfile « » CSV « | ||||||||||||||||||||||||||||||
| 45,42946715 47,30890126 46,45641863 47,3698655 47,21193993 50,36128845 48,46762714 48,98376976 52,05486602 54,4900144 53,78154258 50,39349266 53,42125278 56,37086815 54,65045802 56,30443403 61,62567836 64,47747993 62,62799233 63,95944303 67,29379922 66,17531557 63,35044548 64,73553232 69,02983248 65,38533723 74,25980235 70,6765517 74,00536331 79,69624895 74,29508517 75,23141734 78,12084346 79,89684672 81,10600518 81,90173907 83,26140877 87,63561055 82,34316058 82,17568328 87,5273976 85,7646506 89,44224465 91,02960423 88,65177953 98,73311222 93,21265556 90,78122563 88,65177953 102,0613232 97,62922224 104,8501774 107,4114354 104,0886408 108,3004803 112,2068344 112,5130961 115,9068912 116,137225 113,1145975 119,8591079 122,9852011 125,6783881 125,9717097 132,2688646 132,2177364 128,8320534 138,9298575 144,3433282 150,1766286 151,8766262 154,2529855 158,998195 164,9009977 162,8670286 162,4671806 166,2743851 175,6203913 168,1232692 175, etc... | ||||||||||||||||||||||||||||||
| Output produced by software: | ||||||||||||||||||||||||||||||
| ||||||||||||||||||||||||||||||
| Charts produced by software: | ||||||||||||||||||||||||||||||
| ||||||||||||||||||||||||||||||
| Parameters (Session): | ||||||||||||||||||||||||||||||
| par1 = 1 ; par2 = 2 ; par3 = FALSE ; | ||||||||||||||||||||||||||||||
| Parameters (R input): | ||||||||||||||||||||||||||||||
| par1 = 0 ; par2 = 2 ; par3 = FALSE ; | ||||||||||||||||||||||||||||||
| R code (references can be found in the software module): | ||||||||||||||||||||||||||||||
| par1 <- as.numeric(par1)
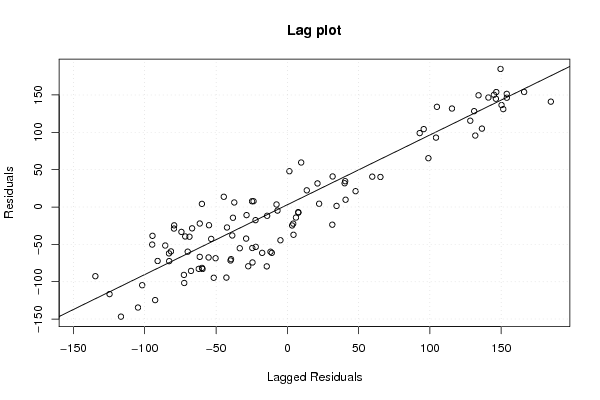
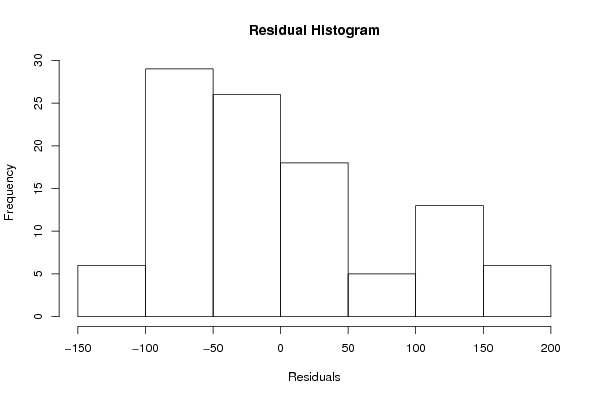
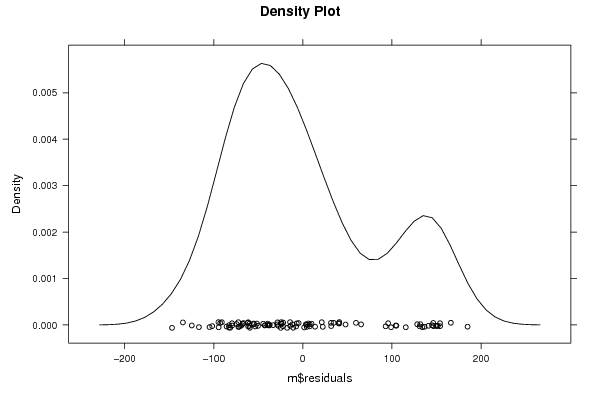
library(lattice) z <- as.data.frame(cbind(x,y)) m <- lm(y~x) summary(m) bitmap(file='test1.png') plot(z,main='Scatterplot, lowess, and regression line') lines(lowess(z),col='red') abline(m) grid() dev.off() bitmap(file='test2.png') m2 <- lm(m$fitted.values ~ x) summary(m2) z2 <- as.data.frame(cbind(x,m$fitted.values)) names(z2) <- list('x','Fitted') plot(z2,main='Scatterplot, lowess, and regression line') lines(lowess(z2),col='red') abline(m2) grid() dev.off() bitmap(file='test3.png') m3 <- lm(m$residuals ~ x) summary(m3) z3 <- as.data.frame(cbind(x,m$residuals)) names(z3) <- list('x','Residuals') plot(z3,main='Scatterplot, lowess, and regression line') lines(lowess(z3),col='red') abline(m3) grid() dev.off() bitmap(file='test4.png') m4 <- lm(m$fitted.values ~ m$residuals) summary(m4) z4 <- as.data.frame(cbind(m$residuals,m$fitted.values)) names(z4) <- list('Residuals','Fitted') plot(z4,main='Scatterplot, lowess, and regression line') lines(lowess(z4),col='red') abline(m4) grid() dev.off() bitmap(file='test5.png') myr <- as.ts(m$residuals) z5 <- as.data.frame(cbind(lag(myr,1),myr)) names(z5) <- list('Lagged Residuals','Residuals') plot(z5,main='Lag plot') m5 <- lm(z5) summary(m5) abline(m5) grid() dev.off() bitmap(file='test6.png') hist(m$residuals,main='Residual Histogram',xlab='Residuals') dev.off() bitmap(file='test7.png') if (par1 > 0) { densityplot(~m$residuals,col='black',main=paste('Density Plot bw = ',par1),bw=par1) } else { densityplot(~m$residuals,col='black',main='Density Plot') } dev.off() bitmap(file='test8.png') acf(m$residuals,main='Residual Autocorrelation Function') dev.off() bitmap(file='test9.png') qqnorm(x) qqline(x) grid() dev.off() load(file='createtable') a<-table.start() a<-table.row.start(a) a<-table.element(a,'Simple Linear Regression',5,TRUE) a<-table.row.end(a) a<-table.row.start(a) a<-table.element(a,'Statistics',1,TRUE) a<-table.element(a,'Estimate',1,TRUE) a<-table.element(a,'S.D.',1,TRUE) a<-table.element(a,'T-STAT (H0: coeff=0)',1,TRUE) a<-table.element(a,'P-value (two-sided)',1,TRUE) a<-table.row.end(a) a<-table.row.start(a) a<-table.element(a,'constant term',header=TRUE) a<-table.element(a,m$coefficients[[1]]) sd <- sqrt(vcov(m)[1,1]) a<-table.element(a,sd) tstat <- m$coefficients[[1]]/sd a<-table.element(a,tstat) pval <- 2*(1-pt(abs(tstat),length(x)-2)) a<-table.element(a,pval) a<-table.row.end(a) a<-table.row.start(a) a<-table.element(a,'slope',header=TRUE) a<-table.element(a,m$coefficients[[2]]) sd <- sqrt(vcov(m)[2,2]) a<-table.element(a,sd) tstat <- m$coefficients[[2]]/sd a<-table.element(a,tstat) pval <- 2*(1-pt(abs(tstat),length(x)-2)) a<-table.element(a,pval) a<-table.row.end(a) a<-table.end(a) table.save(a,file='mytable.tab') | ||||||||||||||||||||||||||||||


Copyright

This work is licensed under a
Creative Commons Attribution-Noncommercial-Share Alike 3.0 License.
Software written by Ed van Stee & Patrick Wessa
Disclaimer
Information provided on this web site is provided "AS IS" without warranty of any kind, either express or implied, including, without limitation, warranties of merchantability, fitness for a particular purpose, and noninfringement. We use reasonable efforts to include accurate and timely information and periodically update the information, and software without notice. However, we make no warranties or representations as to the accuracy or completeness of such information (or software), and we assume no liability or responsibility for errors or omissions in the content of this web site, or any software bugs in online applications. Your use of this web site is AT YOUR OWN RISK. Under no circumstances and under no legal theory shall we be liable to you or any other person for any direct, indirect, special, incidental, exemplary, or consequential damages arising from your access to, or use of, this web site.
Privacy Policy
We may request personal information to be submitted to our servers in order to be able to:
- personalize online software applications according to your needs
- enforce strict security rules with respect to the data that you upload (e.g. statistical data)
- manage user sessions of online applications
- alert you about important changes or upgrades in resources or applications
We NEVER allow other companies to directly offer registered users information about their products and services. Banner references and hyperlinks of third parties NEVER contain any personal data of the visitor.
We do NOT sell, nor transmit by any means, personal information, nor statistical data series uploaded by you to third parties.
We carefully protect your data from loss, misuse, alteration,
and destruction. However, at any time, and under any circumstance you
are solely responsible for managing your passwords, and keeping them
secret.
We store a unique ANONYMOUS USER ID in the form of a small 'Cookie' on your computer. This allows us to track your progress when using this website which is necessary to create state-dependent features. The cookie is used for NO OTHER PURPOSE. At any time you may opt to disallow cookies from this website - this will not affect other features of this website.
We examine cookies that are used by third-parties (banner and online ads) very closely: abuse from third-parties automatically results in termination of the advertising contract without refund. We have very good reason to believe that the cookies that are produced by third parties (banner ads) do NOT cause any privacy or security risk.
FreeStatistics.org is safe. There is no need to download any software to use the applications and services contained in this website. Hence, your system's security is not compromised by their use, and your personal data - other than data you submit in the account application form, and the user-agent information that is transmitted by your browser - is never transmitted to our servers.
As a general rule, we do not log on-line behavior of individuals (other than normal logging of webserver 'hits'). However, in cases of abuse, hacking, unauthorized access, Denial of Service attacks, illegal copying, hotlinking, non-compliance with international webstandards (such as robots.txt), or any other harmful behavior, our system engineers are empowered to log, track, identify, publish, and ban misbehaving individuals - even if this leads to ban entire blocks of IP addresses, or disclosing user's identity.