Resultaten afhankelijk van het jaar? | |||||||||||||||||||||
| *The author of this computation has been verified* | |||||||||||||||||||||
| R Software Module: /rwasp_meanplot.wasp (opens new window with default values) | |||||||||||||||||||||
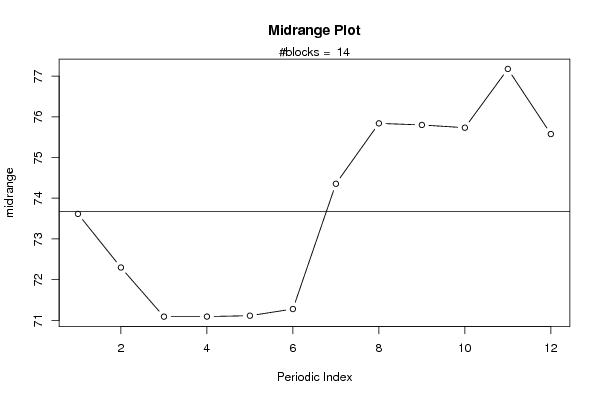
| Title produced by software: Mean Plot | |||||||||||||||||||||
| Date of computation: Thu, 25 Nov 2010 09:34:25 +0000 | |||||||||||||||||||||
| Cite this page as follows: | |||||||||||||||||||||
| Statistical Computations at FreeStatistics.org, Office for Research Development and Education, URL http://www.freestatistics.org/blog/date/2010/Nov/25/t1290677572efbpru2n7v8uzz7.htm/, Retrieved Thu, 25 Nov 2010 10:32:52 +0100 | |||||||||||||||||||||
| BibTeX entries for LaTeX users: | |||||||||||||||||||||
@Manual{KEY,
    author = {{YOUR NAME}},
    publisher = {Office for Research Development and Education},
    title = {Statistical Computations at FreeStatistics.org, URL http://www.freestatistics.org/blog/date/2010/Nov/25/t1290677572efbpru2n7v8uzz7.htm/},
    year = {2010},
}
@Manual{R,
    title = {R: A Language and Environment for Statistical Computing},
    author = {{R Development Core Team}},
    organization = {R Foundation for Statistical Computing},
    address = {Vienna, Austria},
    year = {2010},
    note = {{ISBN} 3-900051-07-0},
    url = {http://www.R-project.org},
}
| |||||||||||||||||||||
| Original text written by user: | |||||||||||||||||||||
| IsPrivate? | |||||||||||||||||||||
| No (this computation is public) | |||||||||||||||||||||
| User-defined keywords: | |||||||||||||||||||||
| Dataseries X: | |||||||||||||||||||||
| » Textbox « » Textfile « » CSV « | |||||||||||||||||||||
| 67.643 69.371 66.294 70.768 71.774 73.388 74.040 73.238 78.121 69.825 71.099 70.676 69.515 68.246 68.594 70.405 61.223 60.542 61.952 68.173 67.240 68.739 69.234 65.570 67.408 64.630 68.848 73.370 74.292 76.525 74.368 75.674 74.868 79.824 80.022 79.942 80.622 80.079 79.212 80.626 83.551 80.407 85.053 86.399 88.536 89.008 89.652 88.904 87.472 88.631 87.221 88.759 90.127 88.709 90.030 88.697 88.762 89.475 88.936 90.411 90.004 92.725 90.252 93.226 92.575 93.125 95.987 97.175 97.321 98.577 99.026 101.851 99.958 97.875 97.927 95.149 94.551 93.999 93.297 89.901 89.742 87.096 86.863 86.718 80.020 63.483 51.289 44.071 43.654 66.115 84.518 83.395 78.307 80.049 78.346 78.317 75.918 73.739 74.530 74.179 76.974 75.408 73.336 69.210 67.286 64.606 64.159 64.423 66.411 64.270 56.521 50.599 54.751 62.227 63.932 65.391 75.744 74.590 76.035 74.427 73.354 73.081 75.309 75.463 75.910 76.151 76.882 78.632 etc... | |||||||||||||||||||||
| Output produced by software: | |||||||||||||||||||||
| |||||||||||||||||||||
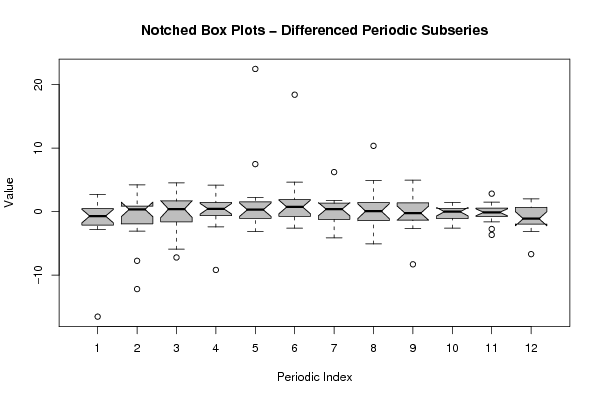
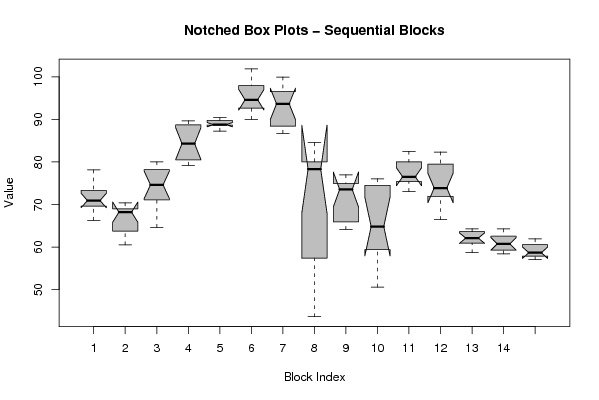
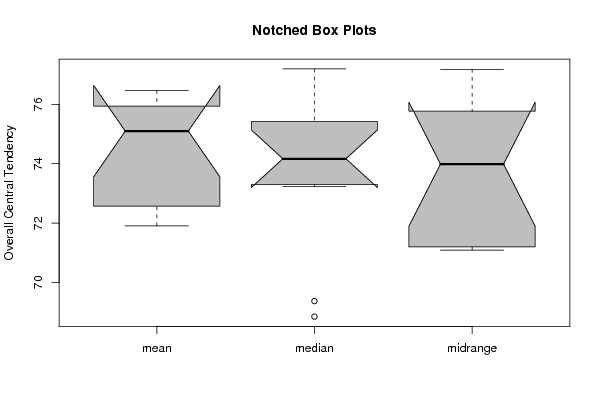
| Charts produced by software: | |||||||||||||||||||||
| |||||||||||||||||||||
| Parameters (Session): | |||||||||||||||||||||
| par1 = 12 ; | |||||||||||||||||||||
| Parameters (R input): | |||||||||||||||||||||
| par1 = 12 ; | |||||||||||||||||||||
| R code (references can be found in the software module): | |||||||||||||||||||||
| par1 <- as.numeric(par1)
(n <- length(x)) (np <- floor(n / par1)) arr <- array(NA,dim=c(par1,np+1)) darr <- array(NA,dim=c(par1,np+1)) ari <- array(0,dim=par1) dx <- diff(x) j <- 0 for (i in 1:n) { j = j + 1 ari[j] = ari[j] + 1 arr[j,ari[j]] <- x[i] darr[j,ari[j]] <- dx[i] if (j == par1) j = 0 } ari arr darr arr.mean <- array(NA,dim=par1) arr.median <- array(NA,dim=par1) arr.midrange <- array(NA,dim=par1) for (j in 1:par1) { arr.mean[j] <- mean(arr[j,],na.rm=TRUE) arr.median[j] <- median(arr[j,],na.rm=TRUE) arr.midrange[j] <- (quantile(arr[j,],0.75,na.rm=TRUE) + quantile(arr[j,],0.25,na.rm=TRUE)) / 2 } overall.mean <- mean(x) overall.median <- median(x) overall.midrange <- (quantile(x,0.75) + quantile(x,0.25)) / 2 bitmap(file='plot1.png') plot(arr.mean,type='b',ylab='mean',main='Mean Plot',xlab='Periodic Index') mtext(paste('#blocks = ',np)) abline(overall.mean,0) dev.off() bitmap(file='plot2.png') plot(arr.median,type='b',ylab='median',main='Median Plot',xlab='Periodic Index') mtext(paste('#blocks = ',np)) abline(overall.median,0) dev.off() bitmap(file='plot3.png') plot(arr.midrange,type='b',ylab='midrange',main='Midrange Plot',xlab='Periodic Index') mtext(paste('#blocks = ',np)) abline(overall.midrange,0) dev.off() bitmap(file='plot4.png') z <- data.frame(t(arr)) names(z) <- c(1:par1) (boxplot(z,notch=TRUE,col='grey',xlab='Periodic Index',ylab='Value',main='Notched Box Plots - Periodic Subseries')) dev.off() bitmap(file='plot4b.png') z <- data.frame(t(darr)) names(z) <- c(1:par1) (boxplot(z,notch=TRUE,col='grey',xlab='Periodic Index',ylab='Value',main='Notched Box Plots - Differenced Periodic Subseries')) dev.off() bitmap(file='plot5.png') z <- data.frame(arr) names(z) <- c(1:np) (boxplot(z,notch=TRUE,col='grey',xlab='Block Index',ylab='Value',main='Notched Box Plots - Sequential Blocks')) dev.off() bitmap(file='plot6.png') z <- data.frame(cbind(arr.mean,arr.median,arr.midrange)) names(z) <- list('mean','median','midrange') (boxplot(z,notch=TRUE,col='grey',ylab='Overall Central Tendency',main='Notched Box Plots')) dev.off() | |||||||||||||||||||||


Copyright

This work is licensed under a
Creative Commons Attribution-Noncommercial-Share Alike 3.0 License.
Software written by Ed van Stee & Patrick Wessa
Disclaimer
Information provided on this web site is provided "AS IS" without warranty of any kind, either express or implied, including, without limitation, warranties of merchantability, fitness for a particular purpose, and noninfringement. We use reasonable efforts to include accurate and timely information and periodically update the information, and software without notice. However, we make no warranties or representations as to the accuracy or completeness of such information (or software), and we assume no liability or responsibility for errors or omissions in the content of this web site, or any software bugs in online applications. Your use of this web site is AT YOUR OWN RISK. Under no circumstances and under no legal theory shall we be liable to you or any other person for any direct, indirect, special, incidental, exemplary, or consequential damages arising from your access to, or use of, this web site.
Privacy Policy
We may request personal information to be submitted to our servers in order to be able to:
- personalize online software applications according to your needs
- enforce strict security rules with respect to the data that you upload (e.g. statistical data)
- manage user sessions of online applications
- alert you about important changes or upgrades in resources or applications
We NEVER allow other companies to directly offer registered users information about their products and services. Banner references and hyperlinks of third parties NEVER contain any personal data of the visitor.
We do NOT sell, nor transmit by any means, personal information, nor statistical data series uploaded by you to third parties.
We carefully protect your data from loss, misuse, alteration,
and destruction. However, at any time, and under any circumstance you
are solely responsible for managing your passwords, and keeping them
secret.
We store a unique ANONYMOUS USER ID in the form of a small 'Cookie' on your computer. This allows us to track your progress when using this website which is necessary to create state-dependent features. The cookie is used for NO OTHER PURPOSE. At any time you may opt to disallow cookies from this website - this will not affect other features of this website.
We examine cookies that are used by third-parties (banner and online ads) very closely: abuse from third-parties automatically results in termination of the advertising contract without refund. We have very good reason to believe that the cookies that are produced by third parties (banner ads) do NOT cause any privacy or security risk.
FreeStatistics.org is safe. There is no need to download any software to use the applications and services contained in this website. Hence, your system's security is not compromised by their use, and your personal data - other than data you submit in the account application form, and the user-agent information that is transmitted by your browser - is never transmitted to our servers.
As a general rule, we do not log on-line behavior of individuals (other than normal logging of webserver 'hits'). However, in cases of abuse, hacking, unauthorized access, Denial of Service attacks, illegal copying, hotlinking, non-compliance with international webstandards (such as robots.txt), or any other harmful behavior, our system engineers are empowered to log, track, identify, publish, and ban misbehaving individuals - even if this leads to ban entire blocks of IP addresses, or disclosing user's identity.