Free Statistics

of Irreproducible Research!

Author's title

Author*The author of this computation has been verified*
R Software Modulerwasp_notchedbox1.wasp
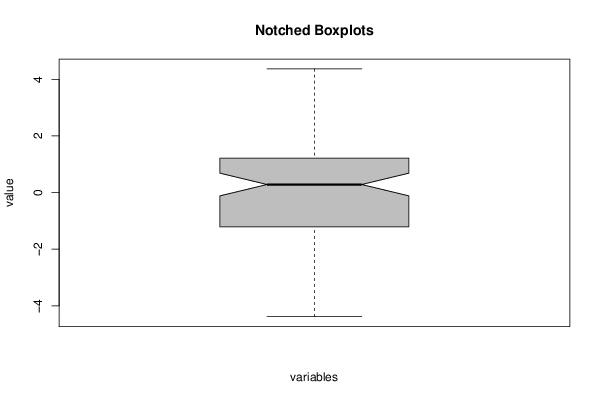
Title produced by softwareNotched Boxplots
Date of computationWed, 19 Dec 2012 10:17:30 -0500
Cite this page as followsStatistical Computations at FreeStatistics.org, Office for Research Development and Education, URL https://freestatistics.org/blog/index.php?v=date/2012/Dec/19/t1355930282ai0gsylkohan19s.htm/, Retrieved Sat, 27 Apr 2024 03:35:05 +0000
Statistical Computations at FreeStatistics.org, Office for Research Development and Education, URL https://freestatistics.org/blog/index.php?pk=202056, Retrieved Sat, 27 Apr 2024 03:35:05 +0000
QR Codes:

Original text written by user:
IsPrivate?No (this computation is public)
User-defined keywords
Estimated Impact84
Family? (F = Feedback message, R = changed R code, M = changed R Module, P = changed Parameters, D = changed Data)
-     [Multiple Regression] [] [2012-11-05 18:28:43] [0208c1f08efc8e25366206e954253d87]
- RMPD    [Notched Boxplots] [] [2012-12-19 15:17:30] [1fa8d8a5ead94b4e7273b6802fa6471c] [Current]
Feedback Forum

Post a new message
Dataseries X:
1.24466494604606
2.82977363992931
2.26319535788924
2.18368194404083
0.26742034348256
-1.15796156885885
-1.67278529587241
-0.830465587064943
0.28496454733518
-0.489702132602918
-0.636406036712408
-0.114028821375401
0.940420068174753
0.593600808300233
0.404283645441877
0.782636239818338
0.629388210145414
1.68696212329762
1.21820336272689
2.11440082228704
1.65068498439552
2.3206115836352
3.15084989873661
2.44328362551546
3.03540273604052
1.2261580660087
2.4197084687601
4.36724280128806
3.95290537082002
2.29080216885958
-0.50000970775731
-0.0647141460363467
0.0904352597301186
1.22398533646541
0.980553897759077
1.84867672093991
0.335366268658083
0.377132818876434
0.0948047439067162
-0.274964916110641
1.2123488114646
1.48572402191943
1.0988425368494
-0.0271044526676357
-0.345766950997311
-1.97781397785646
-3.45680309274367
-4.35886944424663
-2.53348673961923
-2.49189707938742
-2.26753007739411
-2.05937513813257
-2.02710100814685
-2.78566454905146
-3.15347721513337
-4.38294018322151
-2.73346239620514
-1.97279809916367
-0.248089453896406
-1.26382946621449
-2.87499267693056
-0.423682336045326
-0.63067120181195
0.399833202341462
-1.15042094867829
-0.138802841764461
0.367920733827636
2.08911185747178
1.18717716259545
0.98801914316492
1.10003069765619
3.23689578318309
2.59881881805529
1.05691907853307
0.633738683919753
0.530488285078915
1.15546871365578
0.934712310741072
0.598271936844634
0.380603527778247
-0.761115751090605
-0.483595329557089
-1.49419707526348
-2.91614586163368
-1.31394938618133
-1.06966846314574
-0.89624290561216
-1.87221432685003
-3.69686467066934
-3.31930223817469
-3.43821256451368


Summary of computational transaction
Raw Inputview raw input (R code)
Raw Outputview raw output of R engine
Computing time2 seconds
R Server'Sir Ronald Aylmer Fisher' @ fisher.wessa.net

\begin{tabular}{lllllllll}
\hline
Summary of computational transaction \tabularnewline
Raw Input & view raw input (R code)  \tabularnewline
Raw Output & view raw output of R engine  \tabularnewline
Computing time & 2 seconds \tabularnewline
R Server & 'Sir Ronald Aylmer Fisher' @ fisher.wessa.net \tabularnewline
\hline
\end{tabular}
%Source: https://freestatistics.org/blog/index.php?pk=202056&T=0

[TABLE]
[ROW][C]Summary of computational transaction[/C][/ROW]
[ROW][C]Raw Input[/C][C]view raw input (R code) [/C][/ROW]
[ROW][C]Raw Output[/C][C]view raw output of R engine [/C][/ROW]
[ROW][C]Computing time[/C][C]2 seconds[/C][/ROW]
[ROW][C]R Server[/C][C]'Sir Ronald Aylmer Fisher' @ fisher.wessa.net[/C][/ROW]
[/TABLE]
Source: https://freestatistics.org/blog/index.php?pk=202056&T=0

Globally Unique Identifier (entire table): ba.freestatistics.org/blog/index.php?pk=202056&T=0

As an alternative you can also use a QR Code:  

The GUIDs for individual cells are displayed in the table below:

Summary of computational transaction
Raw Inputview raw input (R code)
Raw Outputview raw output of R engine
Computing time2 seconds
R Server'Sir Ronald Aylmer Fisher' @ fisher.wessa.net


Boxplot statistics
Variablelower whiskerlower hingemedianupper hingeupper whisker
V1-4.38294018322151-1.210895517536670.284964547335181.215276087095754.36724280128806

\begin{tabular}{lllllllll}
\hline
Boxplot statistics \tabularnewline
Variable & lower whisker & lower hinge & median & upper hinge & upper whisker \tabularnewline
V1 & -4.38294018322151 & -1.21089551753667 & 0.28496454733518 & 1.21527608709575 & 4.36724280128806 \tabularnewline
\hline
\end{tabular}
%Source: https://freestatistics.org/blog/index.php?pk=202056&T=1

[TABLE]
[ROW][C]Boxplot statistics[/C][/ROW]
[ROW][C]Variable[/C][C]lower whisker[/C][C]lower hinge[/C][C]median[/C][C]upper hinge[/C][C]upper whisker[/C][/ROW]
[ROW][C]V1[/C][C]-4.38294018322151[/C][C]-1.21089551753667[/C][C]0.28496454733518[/C][C]1.21527608709575[/C][C]4.36724280128806[/C][/ROW]
[/TABLE]
Source: https://freestatistics.org/blog/index.php?pk=202056&T=1

Globally Unique Identifier (entire table): ba.freestatistics.org/blog/index.php?pk=202056&T=1

As an alternative you can also use a QR Code:  

The GUIDs for individual cells are displayed in the table below:

Boxplot statistics
Variablelower whiskerlower hingemedianupper hingeupper whisker
V1-4.38294018322151-1.210895517536670.284964547335181.215276087095754.36724280128806


Boxplot Notches
Variablelower boundmedianupper bound
V1-0.1168798395634080.284964547335180.686808934233768

\begin{tabular}{lllllllll}
\hline
Boxplot Notches \tabularnewline
Variable & lower bound & median & upper bound \tabularnewline
V1 & -0.116879839563408 & 0.28496454733518 & 0.686808934233768 \tabularnewline
\hline
\end{tabular}
%Source: https://freestatistics.org/blog/index.php?pk=202056&T=2

[TABLE]
[ROW][C]Boxplot Notches[/C][/ROW]
[ROW][C]Variable[/C][C]lower bound[/C][C]median[/C][C]upper bound[/C][/ROW]
[ROW][C]V1[/C][C]-0.116879839563408[/C][C]0.28496454733518[/C][C]0.686808934233768[/C][/ROW]
[/TABLE]
Source: https://freestatistics.org/blog/index.php?pk=202056&T=2

Globally Unique Identifier (entire table): ba.freestatistics.org/blog/index.php?pk=202056&T=2

As an alternative you can also use a QR Code:  

The GUIDs for individual cells are displayed in the table below:

Boxplot Notches
Variablelower boundmedianupper bound
V1-0.1168798395634080.284964547335180.686808934233768


Parameters (Session):
par1 = grey ;
Parameters (R input):
par1 = grey ;
R code (references can be found in the software module):
z <- as.data.frame(t(y))
bitmap(file='test1.png')
(r<-boxplot(z ,xlab=xlab,ylab=ylab,main=main,notch=TRUE,col=par1))
dev.off()
load(file='createtable')
a<-table.start()
a<-table.row.start(a)
a<-table.element(a,hyperlink('overview.htm','Boxplot statistics','Boxplot overview'),6,TRUE)
a<-table.row.end(a)
a<-table.row.start(a)
a<-table.element(a,'Variable',1,TRUE)
a<-table.element(a,hyperlink('lower_whisker.htm','lower whisker','definition of lower whisker'),1,TRUE)
a<-table.element(a,hyperlink('lower_hinge.htm','lower hinge','definition of lower hinge'),1,TRUE)
a<-table.element(a,hyperlink('central_tendency.htm','median','definitions about measures of central tendency'),1,TRUE)
a<-table.element(a,hyperlink('upper_hinge.htm','upper hinge','definition of upper hinge'),1,TRUE)
a<-table.element(a,hyperlink('upper_whisker.htm','upper whisker','definition of upper whisker'),1,TRUE)
a<-table.row.end(a)
for (i in 1:length(y[,1]))
{
a<-table.row.start(a)
a<-table.element(a,dimnames(t(x))[[2]][i],1,TRUE)
for (j in 1:5)
{
a<-table.element(a,r$stats[j,i])
}
a<-table.row.end(a)
}
a<-table.end(a)
table.save(a,file='mytable.tab')
a<-table.start()
a<-table.row.start(a)
a<-table.element(a,'Boxplot Notches',4,TRUE)
a<-table.row.end(a)
a<-table.row.start(a)
a<-table.element(a,'Variable',1,TRUE)
a<-table.element(a,'lower bound',1,TRUE)
a<-table.element(a,'median',1,TRUE)
a<-table.element(a,'upper bound',1,TRUE)
a<-table.row.end(a)
for (i in 1:length(y[,1]))
{
a<-table.row.start(a)
a<-table.element(a,dimnames(t(x))[[2]][i],1,TRUE)
a<-table.element(a,r$conf[1,i])
a<-table.element(a,r$stats[3,i])
a<-table.element(a,r$conf[2,i])
a<-table.row.end(a)
}
a<-table.end(a)
table.save(a,file='mytable1.tab')