Free Statistics

of Irreproducible Research!

Author's title

Author*Unverified author*
R Software Modulerwasp_autocorrelation.wasp
Title produced by software(Partial) Autocorrelation Function
Date of computationSat, 18 Oct 2014 17:21:58 +0100
Cite this page as followsStatistical Computations at FreeStatistics.org, Office for Research Development and Education, URL https://freestatistics.org/blog/index.php?v=date/2014/Oct/18/t1413649348z9t2obeeyphb9hq.htm/, Retrieved Fri, 01 Nov 2024 00:04:11 +0000
Statistical Computations at FreeStatistics.org, Office for Research Development and Education, URL https://freestatistics.org/blog/index.php?pk=243533, Retrieved Fri, 01 Nov 2024 00:04:11 +0000
QR Codes:

Original text written by user:
IsPrivate?No (this computation is public)
User-defined keywords
Estimated Impact162
Family? (F = Feedback message, R = changed R code, M = changed R Module, P = changed Parameters, D = changed Data)
-       [(Partial) Autocorrelation Function] [] [2014-10-18 16:21:58] [12dd06d3a2c25ae97856df636a27679f] [Current]
- RM      [(Partial) Autocorrelation Function] [] [2015-01-02 16:51:06] [e447d1deb50f041b765de28867e39482]
Feedback Forum

Post a new message
Dataseries X:
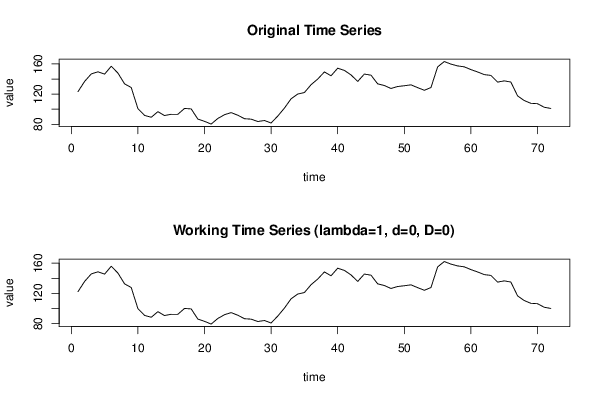
123,2
136,9
146,8
149,6
146,5
157
147,9
133,6
128,7
100,8
91,8
89,3
96,7
91,6
93,3
93,3
101
100,4
86,9
83,9
80,3
87,7
92,7
95,5
92
87,4
86,8
83,7
85
81,7
90,9
101,5
113,8
120,1
122,1
132,5
140
149,4
144,3
154,4
151,4
145,5
136,8
146,6
145,1
133,6
131,4
127,5
130,1
131,1
132,3
128,6
125,1
128,7
156,1
163,2
159,8
157,4
156,2
152,5
149,4
145,9
144,8
135,9
137,6
136
117,7
111,5
107,8
107,3
102,6
101


Summary of computational transaction
Raw Inputview raw input (R code)
Raw Outputview raw output of R engine
Computing time2 seconds
R Server'Sir Maurice George Kendall' @ kendall.wessa.net

\begin{tabular}{lllllllll}
\hline
Summary of computational transaction \tabularnewline
Raw Input & view raw input (R code)  \tabularnewline
Raw Output & view raw output of R engine  \tabularnewline
Computing time & 2 seconds \tabularnewline
R Server & 'Sir Maurice George Kendall' @ kendall.wessa.net \tabularnewline
\hline
\end{tabular}
%Source: https://freestatistics.org/blog/index.php?pk=243533&T=0

[TABLE]
[ROW][C]Summary of computational transaction[/C][/ROW]
[ROW][C]Raw Input[/C][C]view raw input (R code) [/C][/ROW]
[ROW][C]Raw Output[/C][C]view raw output of R engine [/C][/ROW]
[ROW][C]Computing time[/C][C]2 seconds[/C][/ROW]
[ROW][C]R Server[/C][C]'Sir Maurice George Kendall' @ kendall.wessa.net[/C][/ROW]
[/TABLE]
Source: https://freestatistics.org/blog/index.php?pk=243533&T=0

Globally Unique Identifier (entire table): ba.freestatistics.org/blog/index.php?pk=243533&T=0

As an alternative you can also use a QR Code:  

The GUIDs for individual cells are displayed in the table below:

Summary of computational transaction
Raw Inputview raw input (R code)
Raw Outputview raw output of R engine
Computing time2 seconds
R Server'Sir Maurice George Kendall' @ kendall.wessa.net


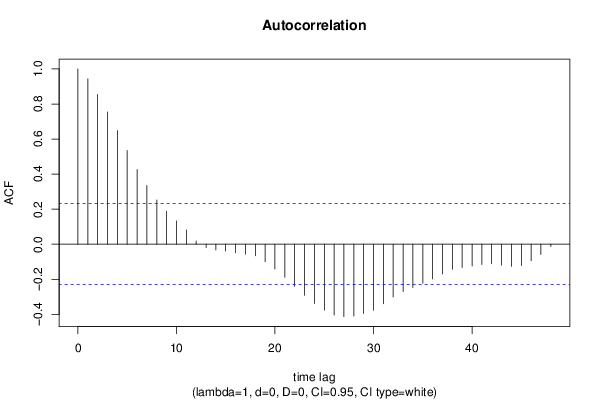
Autocorrelation Function
Time lag kACF(k)T-STATP-value
10.9435168.0060
20.8545757.25130
30.754346.40080
40.6488355.50550
50.5348354.53821.1e-05
60.4262813.61710.000275
70.3354672.84650.002877
80.2520822.1390.017914
90.1877861.59340.057724
100.1330691.12910.131297
110.0813350.69020.246158
120.018410.15620.438152
13-0.018422-0.15630.438112
14-0.032551-0.27620.391591
15-0.0391-0.33180.370511
16-0.048329-0.41010.341479
17-0.056549-0.47980.3164
18-0.065836-0.55860.289072
19-0.099789-0.84670.199974
20-0.1413-1.1990.117235
21-0.188808-1.60210.056757
22-0.23949-2.03210.022915
23-0.291489-2.47340.007872
24-0.338331-2.87080.002686
25-0.3759-3.18960.001055
26-0.403565-3.42440.00051
27-0.413221-3.50630.000393
28-0.409992-3.47890.000429
29-0.395062-3.35220.00064
30-0.376458-3.19440.00104
31-0.339476-2.88050.002613
32-0.300434-2.54930.006463
33-0.269789-2.28920.0125
34-0.247268-2.09810.019701
35-0.222597-1.88880.031473
36-0.197733-1.67780.048859
37-0.169413-1.43750.077451
38-0.143113-1.21440.11429
39-0.132437-1.12380.132422
40-0.12434-1.05510.147463
41-0.115334-0.97860.165516
42-0.111068-0.94240.174558
43-0.11929-1.01220.157414
44-0.126568-1.0740.143212
45-0.121195-1.02840.153609
46-0.09438-0.80080.21293
47-0.058846-0.49930.309536
48-0.013427-0.11390.454806

\begin{tabular}{lllllllll}
\hline
Autocorrelation Function \tabularnewline
Time lag k & ACF(k) & T-STAT & P-value \tabularnewline
1 & 0.943516 & 8.006 & 0 \tabularnewline
2 & 0.854575 & 7.2513 & 0 \tabularnewline
3 & 0.75434 & 6.4008 & 0 \tabularnewline
4 & 0.648835 & 5.5055 & 0 \tabularnewline
5 & 0.534835 & 4.5382 & 1.1e-05 \tabularnewline
6 & 0.426281 & 3.6171 & 0.000275 \tabularnewline
7 & 0.335467 & 2.8465 & 0.002877 \tabularnewline
8 & 0.252082 & 2.139 & 0.017914 \tabularnewline
9 & 0.187786 & 1.5934 & 0.057724 \tabularnewline
10 & 0.133069 & 1.1291 & 0.131297 \tabularnewline
11 & 0.081335 & 0.6902 & 0.246158 \tabularnewline
12 & 0.01841 & 0.1562 & 0.438152 \tabularnewline
13 & -0.018422 & -0.1563 & 0.438112 \tabularnewline
14 & -0.032551 & -0.2762 & 0.391591 \tabularnewline
15 & -0.0391 & -0.3318 & 0.370511 \tabularnewline
16 & -0.048329 & -0.4101 & 0.341479 \tabularnewline
17 & -0.056549 & -0.4798 & 0.3164 \tabularnewline
18 & -0.065836 & -0.5586 & 0.289072 \tabularnewline
19 & -0.099789 & -0.8467 & 0.199974 \tabularnewline
20 & -0.1413 & -1.199 & 0.117235 \tabularnewline
21 & -0.188808 & -1.6021 & 0.056757 \tabularnewline
22 & -0.23949 & -2.0321 & 0.022915 \tabularnewline
23 & -0.291489 & -2.4734 & 0.007872 \tabularnewline
24 & -0.338331 & -2.8708 & 0.002686 \tabularnewline
25 & -0.3759 & -3.1896 & 0.001055 \tabularnewline
26 & -0.403565 & -3.4244 & 0.00051 \tabularnewline
27 & -0.413221 & -3.5063 & 0.000393 \tabularnewline
28 & -0.409992 & -3.4789 & 0.000429 \tabularnewline
29 & -0.395062 & -3.3522 & 0.00064 \tabularnewline
30 & -0.376458 & -3.1944 & 0.00104 \tabularnewline
31 & -0.339476 & -2.8805 & 0.002613 \tabularnewline
32 & -0.300434 & -2.5493 & 0.006463 \tabularnewline
33 & -0.269789 & -2.2892 & 0.0125 \tabularnewline
34 & -0.247268 & -2.0981 & 0.019701 \tabularnewline
35 & -0.222597 & -1.8888 & 0.031473 \tabularnewline
36 & -0.197733 & -1.6778 & 0.048859 \tabularnewline
37 & -0.169413 & -1.4375 & 0.077451 \tabularnewline
38 & -0.143113 & -1.2144 & 0.11429 \tabularnewline
39 & -0.132437 & -1.1238 & 0.132422 \tabularnewline
40 & -0.12434 & -1.0551 & 0.147463 \tabularnewline
41 & -0.115334 & -0.9786 & 0.165516 \tabularnewline
42 & -0.111068 & -0.9424 & 0.174558 \tabularnewline
43 & -0.11929 & -1.0122 & 0.157414 \tabularnewline
44 & -0.126568 & -1.074 & 0.143212 \tabularnewline
45 & -0.121195 & -1.0284 & 0.153609 \tabularnewline
46 & -0.09438 & -0.8008 & 0.21293 \tabularnewline
47 & -0.058846 & -0.4993 & 0.309536 \tabularnewline
48 & -0.013427 & -0.1139 & 0.454806 \tabularnewline
\hline
\end{tabular}
%Source: https://freestatistics.org/blog/index.php?pk=243533&T=1

[TABLE]
[ROW][C]Autocorrelation Function[/C][/ROW]
[ROW][C]Time lag k[/C][C]ACF(k)[/C][C]T-STAT[/C][C]P-value[/C][/ROW]
[ROW][C]1[/C][C]0.943516[/C][C]8.006[/C][C]0[/C][/ROW]
[ROW][C]2[/C][C]0.854575[/C][C]7.2513[/C][C]0[/C][/ROW]
[ROW][C]3[/C][C]0.75434[/C][C]6.4008[/C][C]0[/C][/ROW]
[ROW][C]4[/C][C]0.648835[/C][C]5.5055[/C][C]0[/C][/ROW]
[ROW][C]5[/C][C]0.534835[/C][C]4.5382[/C][C]1.1e-05[/C][/ROW]
[ROW][C]6[/C][C]0.426281[/C][C]3.6171[/C][C]0.000275[/C][/ROW]
[ROW][C]7[/C][C]0.335467[/C][C]2.8465[/C][C]0.002877[/C][/ROW]
[ROW][C]8[/C][C]0.252082[/C][C]2.139[/C][C]0.017914[/C][/ROW]
[ROW][C]9[/C][C]0.187786[/C][C]1.5934[/C][C]0.057724[/C][/ROW]
[ROW][C]10[/C][C]0.133069[/C][C]1.1291[/C][C]0.131297[/C][/ROW]
[ROW][C]11[/C][C]0.081335[/C][C]0.6902[/C][C]0.246158[/C][/ROW]
[ROW][C]12[/C][C]0.01841[/C][C]0.1562[/C][C]0.438152[/C][/ROW]
[ROW][C]13[/C][C]-0.018422[/C][C]-0.1563[/C][C]0.438112[/C][/ROW]
[ROW][C]14[/C][C]-0.032551[/C][C]-0.2762[/C][C]0.391591[/C][/ROW]
[ROW][C]15[/C][C]-0.0391[/C][C]-0.3318[/C][C]0.370511[/C][/ROW]
[ROW][C]16[/C][C]-0.048329[/C][C]-0.4101[/C][C]0.341479[/C][/ROW]
[ROW][C]17[/C][C]-0.056549[/C][C]-0.4798[/C][C]0.3164[/C][/ROW]
[ROW][C]18[/C][C]-0.065836[/C][C]-0.5586[/C][C]0.289072[/C][/ROW]
[ROW][C]19[/C][C]-0.099789[/C][C]-0.8467[/C][C]0.199974[/C][/ROW]
[ROW][C]20[/C][C]-0.1413[/C][C]-1.199[/C][C]0.117235[/C][/ROW]
[ROW][C]21[/C][C]-0.188808[/C][C]-1.6021[/C][C]0.056757[/C][/ROW]
[ROW][C]22[/C][C]-0.23949[/C][C]-2.0321[/C][C]0.022915[/C][/ROW]
[ROW][C]23[/C][C]-0.291489[/C][C]-2.4734[/C][C]0.007872[/C][/ROW]
[ROW][C]24[/C][C]-0.338331[/C][C]-2.8708[/C][C]0.002686[/C][/ROW]
[ROW][C]25[/C][C]-0.3759[/C][C]-3.1896[/C][C]0.001055[/C][/ROW]
[ROW][C]26[/C][C]-0.403565[/C][C]-3.4244[/C][C]0.00051[/C][/ROW]
[ROW][C]27[/C][C]-0.413221[/C][C]-3.5063[/C][C]0.000393[/C][/ROW]
[ROW][C]28[/C][C]-0.409992[/C][C]-3.4789[/C][C]0.000429[/C][/ROW]
[ROW][C]29[/C][C]-0.395062[/C][C]-3.3522[/C][C]0.00064[/C][/ROW]
[ROW][C]30[/C][C]-0.376458[/C][C]-3.1944[/C][C]0.00104[/C][/ROW]
[ROW][C]31[/C][C]-0.339476[/C][C]-2.8805[/C][C]0.002613[/C][/ROW]
[ROW][C]32[/C][C]-0.300434[/C][C]-2.5493[/C][C]0.006463[/C][/ROW]
[ROW][C]33[/C][C]-0.269789[/C][C]-2.2892[/C][C]0.0125[/C][/ROW]
[ROW][C]34[/C][C]-0.247268[/C][C]-2.0981[/C][C]0.019701[/C][/ROW]
[ROW][C]35[/C][C]-0.222597[/C][C]-1.8888[/C][C]0.031473[/C][/ROW]
[ROW][C]36[/C][C]-0.197733[/C][C]-1.6778[/C][C]0.048859[/C][/ROW]
[ROW][C]37[/C][C]-0.169413[/C][C]-1.4375[/C][C]0.077451[/C][/ROW]
[ROW][C]38[/C][C]-0.143113[/C][C]-1.2144[/C][C]0.11429[/C][/ROW]
[ROW][C]39[/C][C]-0.132437[/C][C]-1.1238[/C][C]0.132422[/C][/ROW]
[ROW][C]40[/C][C]-0.12434[/C][C]-1.0551[/C][C]0.147463[/C][/ROW]
[ROW][C]41[/C][C]-0.115334[/C][C]-0.9786[/C][C]0.165516[/C][/ROW]
[ROW][C]42[/C][C]-0.111068[/C][C]-0.9424[/C][C]0.174558[/C][/ROW]
[ROW][C]43[/C][C]-0.11929[/C][C]-1.0122[/C][C]0.157414[/C][/ROW]
[ROW][C]44[/C][C]-0.126568[/C][C]-1.074[/C][C]0.143212[/C][/ROW]
[ROW][C]45[/C][C]-0.121195[/C][C]-1.0284[/C][C]0.153609[/C][/ROW]
[ROW][C]46[/C][C]-0.09438[/C][C]-0.8008[/C][C]0.21293[/C][/ROW]
[ROW][C]47[/C][C]-0.058846[/C][C]-0.4993[/C][C]0.309536[/C][/ROW]
[ROW][C]48[/C][C]-0.013427[/C][C]-0.1139[/C][C]0.454806[/C][/ROW]
[/TABLE]
Source: https://freestatistics.org/blog/index.php?pk=243533&T=1

Globally Unique Identifier (entire table): ba.freestatistics.org/blog/index.php?pk=243533&T=1

As an alternative you can also use a QR Code:  

The GUIDs for individual cells are displayed in the table below:

Autocorrelation Function
Time lag kACF(k)T-STATP-value
10.9435168.0060
20.8545757.25130
30.754346.40080
40.6488355.50550
50.5348354.53821.1e-05
60.4262813.61710.000275
70.3354672.84650.002877
80.2520822.1390.017914
90.1877861.59340.057724
100.1330691.12910.131297
110.0813350.69020.246158
120.018410.15620.438152
13-0.018422-0.15630.438112
14-0.032551-0.27620.391591
15-0.0391-0.33180.370511
16-0.048329-0.41010.341479
17-0.056549-0.47980.3164
18-0.065836-0.55860.289072
19-0.099789-0.84670.199974
20-0.1413-1.1990.117235
21-0.188808-1.60210.056757
22-0.23949-2.03210.022915
23-0.291489-2.47340.007872
24-0.338331-2.87080.002686
25-0.3759-3.18960.001055
26-0.403565-3.42440.00051
27-0.413221-3.50630.000393
28-0.409992-3.47890.000429
29-0.395062-3.35220.00064
30-0.376458-3.19440.00104
31-0.339476-2.88050.002613
32-0.300434-2.54930.006463
33-0.269789-2.28920.0125
34-0.247268-2.09810.019701
35-0.222597-1.88880.031473
36-0.197733-1.67780.048859
37-0.169413-1.43750.077451
38-0.143113-1.21440.11429
39-0.132437-1.12380.132422
40-0.12434-1.05510.147463
41-0.115334-0.97860.165516
42-0.111068-0.94240.174558
43-0.11929-1.01220.157414
44-0.126568-1.0740.143212
45-0.121195-1.02840.153609
46-0.09438-0.80080.21293
47-0.058846-0.49930.309536
48-0.013427-0.11390.454806


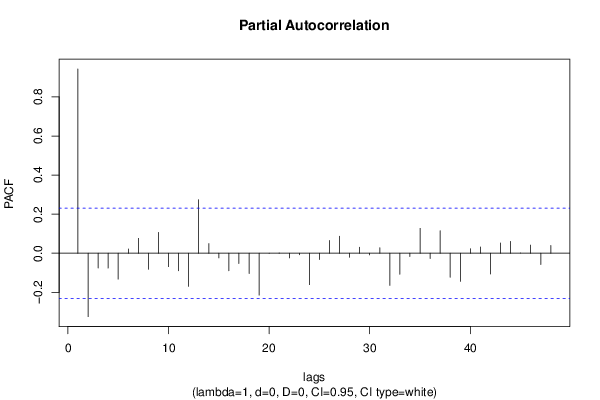
Partial Autocorrelation Function
Time lag kPACF(k)T-STATP-value
10.9435168.0060
2-0.324725-2.75540.00371
3-0.075455-0.64030.262019
4-0.07612-0.64590.2602
5-0.13276-1.12650.131846
60.0214250.18180.428128
70.0761180.64590.260203
8-0.081744-0.69360.245077
90.1066390.90490.184279
10-0.068743-0.58330.280756
11-0.090049-0.76410.223656
12-0.169727-1.44020.077075
130.2737122.32250.011518
140.0494140.41930.338127
15-0.023963-0.20330.419723
16-0.08939-0.75850.225315
17-0.052392-0.44460.328985
18-0.103533-0.87850.191294
19-0.214693-1.82170.036324
20-0.000253-0.00210.499147
210.0015840.01340.494657
22-0.023893-0.20270.419955
23-0.00812-0.06890.472631
24-0.160812-1.36450.088324
25-0.032073-0.27210.393144
260.0654510.55540.290182
270.0865780.73460.232472
28-0.02045-0.17350.431363
290.0304930.25870.398288
30-0.008601-0.0730.471011
310.0281370.23880.405988
32-0.164636-1.3970.083355
33-0.107719-0.9140.181877
34-0.016692-0.14160.44388
350.1274041.08110.141639
36-0.026952-0.22870.409877
370.1152970.97830.165594
38-0.122694-1.04110.150658
39-0.144319-1.22460.112362
400.0229540.19480.423061
410.0320910.27230.393087
42-0.106357-0.90250.184909
430.0526410.44670.328224
440.0605520.51380.304482
450.0005620.00480.498104
460.0415350.35240.362769
47-0.057701-0.48960.31295
480.0395660.33570.369026

\begin{tabular}{lllllllll}
\hline
Partial Autocorrelation Function \tabularnewline
Time lag k & PACF(k) & T-STAT & P-value \tabularnewline
1 & 0.943516 & 8.006 & 0 \tabularnewline
2 & -0.324725 & -2.7554 & 0.00371 \tabularnewline
3 & -0.075455 & -0.6403 & 0.262019 \tabularnewline
4 & -0.07612 & -0.6459 & 0.2602 \tabularnewline
5 & -0.13276 & -1.1265 & 0.131846 \tabularnewline
6 & 0.021425 & 0.1818 & 0.428128 \tabularnewline
7 & 0.076118 & 0.6459 & 0.260203 \tabularnewline
8 & -0.081744 & -0.6936 & 0.245077 \tabularnewline
9 & 0.106639 & 0.9049 & 0.184279 \tabularnewline
10 & -0.068743 & -0.5833 & 0.280756 \tabularnewline
11 & -0.090049 & -0.7641 & 0.223656 \tabularnewline
12 & -0.169727 & -1.4402 & 0.077075 \tabularnewline
13 & 0.273712 & 2.3225 & 0.011518 \tabularnewline
14 & 0.049414 & 0.4193 & 0.338127 \tabularnewline
15 & -0.023963 & -0.2033 & 0.419723 \tabularnewline
16 & -0.08939 & -0.7585 & 0.225315 \tabularnewline
17 & -0.052392 & -0.4446 & 0.328985 \tabularnewline
18 & -0.103533 & -0.8785 & 0.191294 \tabularnewline
19 & -0.214693 & -1.8217 & 0.036324 \tabularnewline
20 & -0.000253 & -0.0021 & 0.499147 \tabularnewline
21 & 0.001584 & 0.0134 & 0.494657 \tabularnewline
22 & -0.023893 & -0.2027 & 0.419955 \tabularnewline
23 & -0.00812 & -0.0689 & 0.472631 \tabularnewline
24 & -0.160812 & -1.3645 & 0.088324 \tabularnewline
25 & -0.032073 & -0.2721 & 0.393144 \tabularnewline
26 & 0.065451 & 0.5554 & 0.290182 \tabularnewline
27 & 0.086578 & 0.7346 & 0.232472 \tabularnewline
28 & -0.02045 & -0.1735 & 0.431363 \tabularnewline
29 & 0.030493 & 0.2587 & 0.398288 \tabularnewline
30 & -0.008601 & -0.073 & 0.471011 \tabularnewline
31 & 0.028137 & 0.2388 & 0.405988 \tabularnewline
32 & -0.164636 & -1.397 & 0.083355 \tabularnewline
33 & -0.107719 & -0.914 & 0.181877 \tabularnewline
34 & -0.016692 & -0.1416 & 0.44388 \tabularnewline
35 & 0.127404 & 1.0811 & 0.141639 \tabularnewline
36 & -0.026952 & -0.2287 & 0.409877 \tabularnewline
37 & 0.115297 & 0.9783 & 0.165594 \tabularnewline
38 & -0.122694 & -1.0411 & 0.150658 \tabularnewline
39 & -0.144319 & -1.2246 & 0.112362 \tabularnewline
40 & 0.022954 & 0.1948 & 0.423061 \tabularnewline
41 & 0.032091 & 0.2723 & 0.393087 \tabularnewline
42 & -0.106357 & -0.9025 & 0.184909 \tabularnewline
43 & 0.052641 & 0.4467 & 0.328224 \tabularnewline
44 & 0.060552 & 0.5138 & 0.304482 \tabularnewline
45 & 0.000562 & 0.0048 & 0.498104 \tabularnewline
46 & 0.041535 & 0.3524 & 0.362769 \tabularnewline
47 & -0.057701 & -0.4896 & 0.31295 \tabularnewline
48 & 0.039566 & 0.3357 & 0.369026 \tabularnewline
\hline
\end{tabular}
%Source: https://freestatistics.org/blog/index.php?pk=243533&T=2

[TABLE]
[ROW][C]Partial Autocorrelation Function[/C][/ROW]
[ROW][C]Time lag k[/C][C]PACF(k)[/C][C]T-STAT[/C][C]P-value[/C][/ROW]
[ROW][C]1[/C][C]0.943516[/C][C]8.006[/C][C]0[/C][/ROW]
[ROW][C]2[/C][C]-0.324725[/C][C]-2.7554[/C][C]0.00371[/C][/ROW]
[ROW][C]3[/C][C]-0.075455[/C][C]-0.6403[/C][C]0.262019[/C][/ROW]
[ROW][C]4[/C][C]-0.07612[/C][C]-0.6459[/C][C]0.2602[/C][/ROW]
[ROW][C]5[/C][C]-0.13276[/C][C]-1.1265[/C][C]0.131846[/C][/ROW]
[ROW][C]6[/C][C]0.021425[/C][C]0.1818[/C][C]0.428128[/C][/ROW]
[ROW][C]7[/C][C]0.076118[/C][C]0.6459[/C][C]0.260203[/C][/ROW]
[ROW][C]8[/C][C]-0.081744[/C][C]-0.6936[/C][C]0.245077[/C][/ROW]
[ROW][C]9[/C][C]0.106639[/C][C]0.9049[/C][C]0.184279[/C][/ROW]
[ROW][C]10[/C][C]-0.068743[/C][C]-0.5833[/C][C]0.280756[/C][/ROW]
[ROW][C]11[/C][C]-0.090049[/C][C]-0.7641[/C][C]0.223656[/C][/ROW]
[ROW][C]12[/C][C]-0.169727[/C][C]-1.4402[/C][C]0.077075[/C][/ROW]
[ROW][C]13[/C][C]0.273712[/C][C]2.3225[/C][C]0.011518[/C][/ROW]
[ROW][C]14[/C][C]0.049414[/C][C]0.4193[/C][C]0.338127[/C][/ROW]
[ROW][C]15[/C][C]-0.023963[/C][C]-0.2033[/C][C]0.419723[/C][/ROW]
[ROW][C]16[/C][C]-0.08939[/C][C]-0.7585[/C][C]0.225315[/C][/ROW]
[ROW][C]17[/C][C]-0.052392[/C][C]-0.4446[/C][C]0.328985[/C][/ROW]
[ROW][C]18[/C][C]-0.103533[/C][C]-0.8785[/C][C]0.191294[/C][/ROW]
[ROW][C]19[/C][C]-0.214693[/C][C]-1.8217[/C][C]0.036324[/C][/ROW]
[ROW][C]20[/C][C]-0.000253[/C][C]-0.0021[/C][C]0.499147[/C][/ROW]
[ROW][C]21[/C][C]0.001584[/C][C]0.0134[/C][C]0.494657[/C][/ROW]
[ROW][C]22[/C][C]-0.023893[/C][C]-0.2027[/C][C]0.419955[/C][/ROW]
[ROW][C]23[/C][C]-0.00812[/C][C]-0.0689[/C][C]0.472631[/C][/ROW]
[ROW][C]24[/C][C]-0.160812[/C][C]-1.3645[/C][C]0.088324[/C][/ROW]
[ROW][C]25[/C][C]-0.032073[/C][C]-0.2721[/C][C]0.393144[/C][/ROW]
[ROW][C]26[/C][C]0.065451[/C][C]0.5554[/C][C]0.290182[/C][/ROW]
[ROW][C]27[/C][C]0.086578[/C][C]0.7346[/C][C]0.232472[/C][/ROW]
[ROW][C]28[/C][C]-0.02045[/C][C]-0.1735[/C][C]0.431363[/C][/ROW]
[ROW][C]29[/C][C]0.030493[/C][C]0.2587[/C][C]0.398288[/C][/ROW]
[ROW][C]30[/C][C]-0.008601[/C][C]-0.073[/C][C]0.471011[/C][/ROW]
[ROW][C]31[/C][C]0.028137[/C][C]0.2388[/C][C]0.405988[/C][/ROW]
[ROW][C]32[/C][C]-0.164636[/C][C]-1.397[/C][C]0.083355[/C][/ROW]
[ROW][C]33[/C][C]-0.107719[/C][C]-0.914[/C][C]0.181877[/C][/ROW]
[ROW][C]34[/C][C]-0.016692[/C][C]-0.1416[/C][C]0.44388[/C][/ROW]
[ROW][C]35[/C][C]0.127404[/C][C]1.0811[/C][C]0.141639[/C][/ROW]
[ROW][C]36[/C][C]-0.026952[/C][C]-0.2287[/C][C]0.409877[/C][/ROW]
[ROW][C]37[/C][C]0.115297[/C][C]0.9783[/C][C]0.165594[/C][/ROW]
[ROW][C]38[/C][C]-0.122694[/C][C]-1.0411[/C][C]0.150658[/C][/ROW]
[ROW][C]39[/C][C]-0.144319[/C][C]-1.2246[/C][C]0.112362[/C][/ROW]
[ROW][C]40[/C][C]0.022954[/C][C]0.1948[/C][C]0.423061[/C][/ROW]
[ROW][C]41[/C][C]0.032091[/C][C]0.2723[/C][C]0.393087[/C][/ROW]
[ROW][C]42[/C][C]-0.106357[/C][C]-0.9025[/C][C]0.184909[/C][/ROW]
[ROW][C]43[/C][C]0.052641[/C][C]0.4467[/C][C]0.328224[/C][/ROW]
[ROW][C]44[/C][C]0.060552[/C][C]0.5138[/C][C]0.304482[/C][/ROW]
[ROW][C]45[/C][C]0.000562[/C][C]0.0048[/C][C]0.498104[/C][/ROW]
[ROW][C]46[/C][C]0.041535[/C][C]0.3524[/C][C]0.362769[/C][/ROW]
[ROW][C]47[/C][C]-0.057701[/C][C]-0.4896[/C][C]0.31295[/C][/ROW]
[ROW][C]48[/C][C]0.039566[/C][C]0.3357[/C][C]0.369026[/C][/ROW]
[/TABLE]
Source: https://freestatistics.org/blog/index.php?pk=243533&T=2

Globally Unique Identifier (entire table): ba.freestatistics.org/blog/index.php?pk=243533&T=2

As an alternative you can also use a QR Code:  

The GUIDs for individual cells are displayed in the table below:

Partial Autocorrelation Function
Time lag kPACF(k)T-STATP-value
10.9435168.0060
2-0.324725-2.75540.00371
3-0.075455-0.64030.262019
4-0.07612-0.64590.2602
5-0.13276-1.12650.131846
60.0214250.18180.428128
70.0761180.64590.260203
8-0.081744-0.69360.245077
90.1066390.90490.184279
10-0.068743-0.58330.280756
11-0.090049-0.76410.223656
12-0.169727-1.44020.077075
130.2737122.32250.011518
140.0494140.41930.338127
15-0.023963-0.20330.419723
16-0.08939-0.75850.225315
17-0.052392-0.44460.328985
18-0.103533-0.87850.191294
19-0.214693-1.82170.036324
20-0.000253-0.00210.499147
210.0015840.01340.494657
22-0.023893-0.20270.419955
23-0.00812-0.06890.472631
24-0.160812-1.36450.088324
25-0.032073-0.27210.393144
260.0654510.55540.290182
270.0865780.73460.232472
28-0.02045-0.17350.431363
290.0304930.25870.398288
30-0.008601-0.0730.471011
310.0281370.23880.405988
32-0.164636-1.3970.083355
33-0.107719-0.9140.181877
34-0.016692-0.14160.44388
350.1274041.08110.141639
36-0.026952-0.22870.409877
370.1152970.97830.165594
38-0.122694-1.04110.150658
39-0.144319-1.22460.112362
400.0229540.19480.423061
410.0320910.27230.393087
42-0.106357-0.90250.184909
430.0526410.44670.328224
440.0605520.51380.304482
450.0005620.00480.498104
460.0415350.35240.362769
47-0.057701-0.48960.31295
480.0395660.33570.369026


Parameters (Session):
par1 = 48 ; par2 = 1 ; par3 = 0 ; par4 = 0 ; par5 = 12 ; par6 = White Noise ; par7 = 0.95 ;
Parameters (R input):
par1 = 48 ; par2 = 1 ; par3 = 0 ; par4 = 0 ; par5 = 12 ; par6 = White Noise ; par7 = 0.95 ; par8 = ;
R code (references can be found in the software module):
if (par1 == 'Default') {
par1 = 10*log10(length(x))
} else {
par1 <- as.numeric(par1)
}
par2 <- as.numeric(par2)
par3 <- as.numeric(par3)
par4 <- as.numeric(par4)
par5 <- as.numeric(par5)
if (par6 == 'White Noise') par6 <- 'white' else par6 <- 'ma'
par7 <- as.numeric(par7)
if (par8 != '') par8 <- as.numeric(par8)
ox <- x
if (par8 == '') {
if (par2 == 0) {
x <- log(x)
} else {
x <- (x ^ par2 - 1) / par2
}
} else {
x <- log(x,base=par8)
}
if (par3 > 0) x <- diff(x,lag=1,difference=par3)
if (par4 > 0) x <- diff(x,lag=par5,difference=par4)
bitmap(file='picts.png')
op <- par(mfrow=c(2,1))
plot(ox,type='l',main='Original Time Series',xlab='time',ylab='value')
if (par8=='') {
mytitle <- paste('Working Time Series (lambda=',par2,', d=',par3,', D=',par4,')',sep='')
mysub <- paste('(lambda=',par2,', d=',par3,', D=',par4,', CI=', par7, ', CI type=',par6,')',sep='')
} else {
mytitle <- paste('Working Time Series (base=',par8,', d=',par3,', D=',par4,')',sep='')
mysub <- paste('(base=',par8,', d=',par3,', D=',par4,', CI=', par7, ', CI type=',par6,')',sep='')
}
plot(x,type='l', main=mytitle,xlab='time',ylab='value')
par(op)
dev.off()
bitmap(file='pic1.png')
racf <- acf(x, par1, main='Autocorrelation', xlab='time lag', ylab='ACF', ci.type=par6, ci=par7, sub=mysub)
dev.off()
bitmap(file='pic2.png')
rpacf <- pacf(x,par1,main='Partial Autocorrelation',xlab='lags',ylab='PACF',sub=mysub)
dev.off()
(myacf <- c(racf$acf))
(mypacf <- c(rpacf$acf))
lengthx <- length(x)
sqrtn <- sqrt(lengthx)
load(file='createtable')
a<-table.start()
a<-table.row.start(a)
a<-table.element(a,'Autocorrelation Function',4,TRUE)
a<-table.row.end(a)
a<-table.row.start(a)
a<-table.element(a,'Time lag k',header=TRUE)
a<-table.element(a,hyperlink('basics.htm','ACF(k)','click here for more information about the Autocorrelation Function'),header=TRUE)
a<-table.element(a,'T-STAT',header=TRUE)
a<-table.element(a,'P-value',header=TRUE)
a<-table.row.end(a)
for (i in 2:(par1+1)) {
a<-table.row.start(a)
a<-table.element(a,i-1,header=TRUE)
a<-table.element(a,round(myacf[i],6))
mytstat <- myacf[i]*sqrtn
a<-table.element(a,round(mytstat,4))
a<-table.element(a,round(1-pt(abs(mytstat),lengthx),6))
a<-table.row.end(a)
}
a<-table.end(a)
table.save(a,file='mytable.tab')
a<-table.start()
a<-table.row.start(a)
a<-table.element(a,'Partial Autocorrelation Function',4,TRUE)
a<-table.row.end(a)
a<-table.row.start(a)
a<-table.element(a,'Time lag k',header=TRUE)
a<-table.element(a,hyperlink('basics.htm','PACF(k)','click here for more information about the Partial Autocorrelation Function'),header=TRUE)
a<-table.element(a,'T-STAT',header=TRUE)
a<-table.element(a,'P-value',header=TRUE)
a<-table.row.end(a)
for (i in 1:par1) {
a<-table.row.start(a)
a<-table.element(a,i,header=TRUE)
a<-table.element(a,round(mypacf[i],6))
mytstat <- mypacf[i]*sqrtn
a<-table.element(a,round(mytstat,4))
a<-table.element(a,round(1-pt(abs(mytstat),lengthx),6))
a<-table.row.end(a)
}
a<-table.end(a)
table.save(a,file='mytable1.tab')