Free Statistics
of Irreproducible Research!
Description of Statistical Computation | |||||||||||||||||||||||||||||||||||||||||
|---|---|---|---|---|---|---|---|---|---|---|---|---|---|---|---|---|---|---|---|---|---|---|---|---|---|---|---|---|---|---|---|---|---|---|---|---|---|---|---|---|---|
| Author's title | |||||||||||||||||||||||||||||||||||||||||
| Author | *The author of this computation has been verified* | ||||||||||||||||||||||||||||||||||||||||
| R Software Module | rwasp_univariatedataseries.wasp | ||||||||||||||||||||||||||||||||||||||||
| Title produced by software | Univariate Data Series | ||||||||||||||||||||||||||||||||||||||||
| Date of computation | Fri, 17 Dec 2010 13:09:23 +0000 | ||||||||||||||||||||||||||||||||||||||||
| Cite this page as follows | Statistical Computations at FreeStatistics.org, Office for Research Development and Education, URL https://freestatistics.org/blog/index.php?v=date/2010/Dec/17/t1292591264g6byded9okcl9ou.htm/, Retrieved Tue, 10 Feb 2026 19:50:28 +0000 | ||||||||||||||||||||||||||||||||||||||||
| Statistical Computations at FreeStatistics.org, Office for Research Development and Education, URL https://freestatistics.org/blog/index.php?pk=111444, Retrieved Tue, 10 Feb 2026 19:50:28 +0000 | |||||||||||||||||||||||||||||||||||||||||
| QR Codes: | |||||||||||||||||||||||||||||||||||||||||
|
| |||||||||||||||||||||||||||||||||||||||||
| Original text written by user: | |||||||||||||||||||||||||||||||||||||||||
| IsPrivate? | No (this computation is public) | ||||||||||||||||||||||||||||||||||||||||
| User-defined keywords | |||||||||||||||||||||||||||||||||||||||||
| Estimated Impact | 367 | ||||||||||||||||||||||||||||||||||||||||
Tree of Dependent Computations | |||||||||||||||||||||||||||||||||||||||||
| Family? (F = Feedback message, R = changed R code, M = changed R Module, P = changed Parameters, D = changed Data) | |||||||||||||||||||||||||||||||||||||||||
| - [Univariate Data Series] [] [2009-10-12 09:03:04] [ebd107afac1bd6180acb277edd05815b] - MPD [Univariate Data Series] [Paper uitvoer bel...] [2010-11-30 11:19:39] [247f085ab5b7724f755ad01dc754a3e8] - R PD [Univariate Data Series] [Werkaanbod in Vla...] [2010-12-17 13:09:23] [a960f182d9e6e851e9aaba5921cd26a4] [Current] - P [Univariate Data Series] [Werkaanbod in Vla...] [2010-12-22 14:48:44] [18a20458ff88c9ba38344d123a9464bc] | |||||||||||||||||||||||||||||||||||||||||
| Feedback Forum | |||||||||||||||||||||||||||||||||||||||||
Post a new message | |||||||||||||||||||||||||||||||||||||||||
Dataset | |||||||||||||||||||||||||||||||||||||||||
| Dataseries X: | |||||||||||||||||||||||||||||||||||||||||
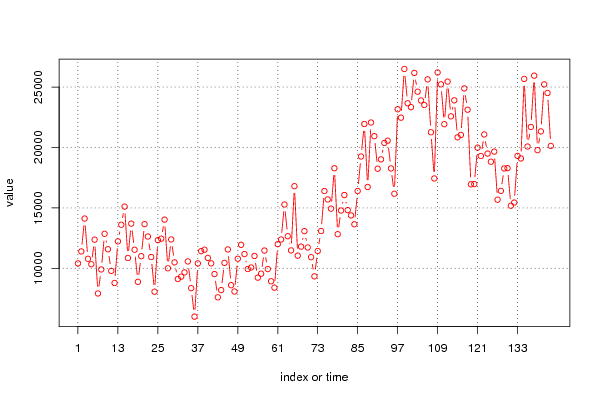
10406 11398 14117 10785 10334 12371 7918 9907 12855 11579 9788 8786 12231 13604 15107 10853 13698 11536 8879 11005 13656 12631 10931 8064 12332 12452 14029 10003 12388 10492 9114 9304 9660 10569 8356 5998 10408 11420 11538 10860 10412 9521 7602 8197 10449 11561 8603 8080 10792 11943 11179 9939 10065 11021 9226 9554 11468 9937 8928 8395 11996 12385 15277 12657 11482 16797 11047 11794 13077 11725 10921 9334 11431 13085 16394 15701 14936 18282 12824 14784 16061 14814 14375 13644 16397 19254 21943 16731 22065 20937 18242 19017 20372 20561 18267 16170 23163 22469 26500 23660 23339 26174 24617 23891 23516 25638 21258 17436 26210 25227 21928 25452 22578 23904 20842 21042 24890 23126 16951 16972 19985 19296 21078 19493 18821 19657 15678 16406 18264 18288 15179 15443 19306 19094 25673 20077 21698 25943 19778 21333 25222 24512 20126 | |||||||||||||||||||||||||||||||||||||||||
Tables (Output of Computation) | |||||||||||||||||||||||||||||||||||||||||
| |||||||||||||||||||||||||||||||||||||||||
Figures (Output of Computation) | |||||||||||||||||||||||||||||||||||||||||
Input Parameters & R Code | |||||||||||||||||||||||||||||||||||||||||
| Parameters (Session): | |||||||||||||||||||||||||||||||||||||||||
| par2 = http://arvastat.vdab.be/arvastat/index.htm ; par3 = Werkaanbod in Vlaanderen ; par4 = 12 ; | |||||||||||||||||||||||||||||||||||||||||
| Parameters (R input): | |||||||||||||||||||||||||||||||||||||||||
| par1 = ; par2 = http://arvastat.vdab.be/arvastat/index.htm ; par3 = Werkaanbod in Vlaanderen ; par4 = 12 ; | |||||||||||||||||||||||||||||||||||||||||
| R code (references can be found in the software module): | |||||||||||||||||||||||||||||||||||||||||
if (par4 != 'No season') { | |||||||||||||||||||||||||||||||||||||||||


