Free Statistics

of Irreproducible Research!

Author's title

Author*The author of this computation has been verified*
R Software Modulerwasp_autocorrelation.wasp
Title produced by software(Partial) Autocorrelation Function
Date of computationWed, 28 Nov 2012 09:20:32 -0500
Cite this page as followsStatistical Computations at FreeStatistics.org, Office for Research Development and Education, URL https://freestatistics.org/blog/index.php?v=date/2012/Nov/28/t13541125586omr86b78ukbqu5.htm/, Retrieved Thu, 31 Oct 2024 23:37:04 +0000
Statistical Computations at FreeStatistics.org, Office for Research Development and Education, URL https://freestatistics.org/blog/index.php?pk=194155, Retrieved Thu, 31 Oct 2024 23:37:04 +0000
QR Codes:

Original text written by user:
IsPrivate?No (this computation is public)
User-defined keywords
Estimated Impact137
Family? (F = Feedback message, R = changed R code, M = changed R Module, P = changed Parameters, D = changed Data)
-     [(Partial) Autocorrelation Function] [WS 8 autocorrelation] [2012-11-09 14:35:27] [8fc56f6caf42131500698d1cf21d4abb]
-   P     [(Partial) Autocorrelation Function] [Tijdreeksanalyse ...] [2012-11-28 14:20:32] [4c917d823355d00d361b7013e9f37760] [Current]
Feedback Forum

Post a new message
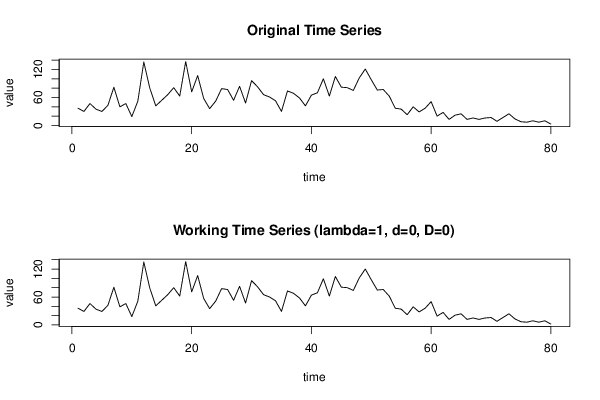
Dataseries X:
37
30
47
35
30
43
82
40
47
19
52
136
80
42
54
66
81
63
137
72
107
58
36
52
79
77
54
84
48
96
83
66
61
53
30
74
69
59
42
65
70
100
63
105
82
81
75
102
121
98
76
77
63
37
35
23
40
29
37
51
20
28
13
22
25
13
16
13
16
17
9
17
25
14
8
7
10
7
10
3


Summary of computational transaction
Raw Inputview raw input (R code)
Raw Outputview raw output of R engine
Computing time2 seconds
R Server'George Udny Yule' @ yule.wessa.net

\begin{tabular}{lllllllll}
\hline
Summary of computational transaction \tabularnewline
Raw Input & view raw input (R code)  \tabularnewline
Raw Output & view raw output of R engine  \tabularnewline
Computing time & 2 seconds \tabularnewline
R Server & 'George Udny Yule' @ yule.wessa.net \tabularnewline
\hline
\end{tabular}
%Source: https://freestatistics.org/blog/index.php?pk=194155&T=0

[TABLE]
[ROW][C]Summary of computational transaction[/C][/ROW]
[ROW][C]Raw Input[/C][C]view raw input (R code) [/C][/ROW]
[ROW][C]Raw Output[/C][C]view raw output of R engine [/C][/ROW]
[ROW][C]Computing time[/C][C]2 seconds[/C][/ROW]
[ROW][C]R Server[/C][C]'George Udny Yule' @ yule.wessa.net[/C][/ROW]
[/TABLE]
Source: https://freestatistics.org/blog/index.php?pk=194155&T=0

Globally Unique Identifier (entire table): ba.freestatistics.org/blog/index.php?pk=194155&T=0

As an alternative you can also use a QR Code:  

The GUIDs for individual cells are displayed in the table below:

Summary of computational transaction
Raw Inputview raw input (R code)
Raw Outputview raw output of R engine
Computing time2 seconds
R Server'George Udny Yule' @ yule.wessa.net


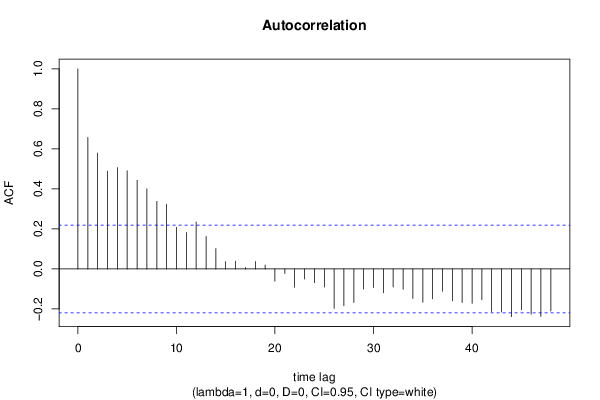
Autocorrelation Function
Time lag kACF(k)T-STATP-value
10.657735.88290
20.5793045.18151e-06
30.4889044.37291.8e-05
40.506734.53231e-05
50.4915024.39611.7e-05
60.4431783.96398e-05
70.4006313.58340.000291
80.3379353.02260.001683
90.3232242.8910.002471
100.2080891.86120.033194
110.1821211.62890.053629
120.2348922.10090.019397
130.1624851.45330.075025
140.1019050.91150.182393
150.0369550.33050.370929
160.038590.34520.365441
170.0075310.06740.473233
180.0374430.33490.369288
190.0199220.17820.429514
20-0.060646-0.54240.294514
21-0.022675-0.20280.419899
22-0.091149-0.81530.208672
23-0.050226-0.44920.327239
24-0.06846-0.61230.271028
25-0.089826-0.80340.212054
26-0.196982-1.76190.040957
27-0.18373-1.64330.052119
28-0.166928-1.49310.069679
29-0.099877-0.89330.187181
30-0.092915-0.83110.204208
31-0.119024-1.06460.145134
32-0.090145-0.80630.211236
33-0.100741-0.90110.185132
34-0.147007-1.31490.096154
35-0.166258-1.48710.070465
36-0.148472-1.3280.093982
37-0.111473-0.9970.160875
38-0.158507-1.41770.080077
39-0.167436-1.49760.069088
40-0.1718-1.53660.064166
41-0.154185-1.37910.085858
42-0.212997-1.90510.03018
43-0.215528-1.92770.028718
44-0.238327-2.13170.018052
45-0.203457-1.81980.036267
46-0.226162-2.02290.023215
47-0.236944-2.11930.018583
48-0.210006-1.87840.031988

\begin{tabular}{lllllllll}
\hline
Autocorrelation Function \tabularnewline
Time lag k & ACF(k) & T-STAT & P-value \tabularnewline
1 & 0.65773 & 5.8829 & 0 \tabularnewline
2 & 0.579304 & 5.1815 & 1e-06 \tabularnewline
3 & 0.488904 & 4.3729 & 1.8e-05 \tabularnewline
4 & 0.50673 & 4.5323 & 1e-05 \tabularnewline
5 & 0.491502 & 4.3961 & 1.7e-05 \tabularnewline
6 & 0.443178 & 3.9639 & 8e-05 \tabularnewline
7 & 0.400631 & 3.5834 & 0.000291 \tabularnewline
8 & 0.337935 & 3.0226 & 0.001683 \tabularnewline
9 & 0.323224 & 2.891 & 0.002471 \tabularnewline
10 & 0.208089 & 1.8612 & 0.033194 \tabularnewline
11 & 0.182121 & 1.6289 & 0.053629 \tabularnewline
12 & 0.234892 & 2.1009 & 0.019397 \tabularnewline
13 & 0.162485 & 1.4533 & 0.075025 \tabularnewline
14 & 0.101905 & 0.9115 & 0.182393 \tabularnewline
15 & 0.036955 & 0.3305 & 0.370929 \tabularnewline
16 & 0.03859 & 0.3452 & 0.365441 \tabularnewline
17 & 0.007531 & 0.0674 & 0.473233 \tabularnewline
18 & 0.037443 & 0.3349 & 0.369288 \tabularnewline
19 & 0.019922 & 0.1782 & 0.429514 \tabularnewline
20 & -0.060646 & -0.5424 & 0.294514 \tabularnewline
21 & -0.022675 & -0.2028 & 0.419899 \tabularnewline
22 & -0.091149 & -0.8153 & 0.208672 \tabularnewline
23 & -0.050226 & -0.4492 & 0.327239 \tabularnewline
24 & -0.06846 & -0.6123 & 0.271028 \tabularnewline
25 & -0.089826 & -0.8034 & 0.212054 \tabularnewline
26 & -0.196982 & -1.7619 & 0.040957 \tabularnewline
27 & -0.18373 & -1.6433 & 0.052119 \tabularnewline
28 & -0.166928 & -1.4931 & 0.069679 \tabularnewline
29 & -0.099877 & -0.8933 & 0.187181 \tabularnewline
30 & -0.092915 & -0.8311 & 0.204208 \tabularnewline
31 & -0.119024 & -1.0646 & 0.145134 \tabularnewline
32 & -0.090145 & -0.8063 & 0.211236 \tabularnewline
33 & -0.100741 & -0.9011 & 0.185132 \tabularnewline
34 & -0.147007 & -1.3149 & 0.096154 \tabularnewline
35 & -0.166258 & -1.4871 & 0.070465 \tabularnewline
36 & -0.148472 & -1.328 & 0.093982 \tabularnewline
37 & -0.111473 & -0.997 & 0.160875 \tabularnewline
38 & -0.158507 & -1.4177 & 0.080077 \tabularnewline
39 & -0.167436 & -1.4976 & 0.069088 \tabularnewline
40 & -0.1718 & -1.5366 & 0.064166 \tabularnewline
41 & -0.154185 & -1.3791 & 0.085858 \tabularnewline
42 & -0.212997 & -1.9051 & 0.03018 \tabularnewline
43 & -0.215528 & -1.9277 & 0.028718 \tabularnewline
44 & -0.238327 & -2.1317 & 0.018052 \tabularnewline
45 & -0.203457 & -1.8198 & 0.036267 \tabularnewline
46 & -0.226162 & -2.0229 & 0.023215 \tabularnewline
47 & -0.236944 & -2.1193 & 0.018583 \tabularnewline
48 & -0.210006 & -1.8784 & 0.031988 \tabularnewline
\hline
\end{tabular}
%Source: https://freestatistics.org/blog/index.php?pk=194155&T=1

[TABLE]
[ROW][C]Autocorrelation Function[/C][/ROW]
[ROW][C]Time lag k[/C][C]ACF(k)[/C][C]T-STAT[/C][C]P-value[/C][/ROW]
[ROW][C]1[/C][C]0.65773[/C][C]5.8829[/C][C]0[/C][/ROW]
[ROW][C]2[/C][C]0.579304[/C][C]5.1815[/C][C]1e-06[/C][/ROW]
[ROW][C]3[/C][C]0.488904[/C][C]4.3729[/C][C]1.8e-05[/C][/ROW]
[ROW][C]4[/C][C]0.50673[/C][C]4.5323[/C][C]1e-05[/C][/ROW]
[ROW][C]5[/C][C]0.491502[/C][C]4.3961[/C][C]1.7e-05[/C][/ROW]
[ROW][C]6[/C][C]0.443178[/C][C]3.9639[/C][C]8e-05[/C][/ROW]
[ROW][C]7[/C][C]0.400631[/C][C]3.5834[/C][C]0.000291[/C][/ROW]
[ROW][C]8[/C][C]0.337935[/C][C]3.0226[/C][C]0.001683[/C][/ROW]
[ROW][C]9[/C][C]0.323224[/C][C]2.891[/C][C]0.002471[/C][/ROW]
[ROW][C]10[/C][C]0.208089[/C][C]1.8612[/C][C]0.033194[/C][/ROW]
[ROW][C]11[/C][C]0.182121[/C][C]1.6289[/C][C]0.053629[/C][/ROW]
[ROW][C]12[/C][C]0.234892[/C][C]2.1009[/C][C]0.019397[/C][/ROW]
[ROW][C]13[/C][C]0.162485[/C][C]1.4533[/C][C]0.075025[/C][/ROW]
[ROW][C]14[/C][C]0.101905[/C][C]0.9115[/C][C]0.182393[/C][/ROW]
[ROW][C]15[/C][C]0.036955[/C][C]0.3305[/C][C]0.370929[/C][/ROW]
[ROW][C]16[/C][C]0.03859[/C][C]0.3452[/C][C]0.365441[/C][/ROW]
[ROW][C]17[/C][C]0.007531[/C][C]0.0674[/C][C]0.473233[/C][/ROW]
[ROW][C]18[/C][C]0.037443[/C][C]0.3349[/C][C]0.369288[/C][/ROW]
[ROW][C]19[/C][C]0.019922[/C][C]0.1782[/C][C]0.429514[/C][/ROW]
[ROW][C]20[/C][C]-0.060646[/C][C]-0.5424[/C][C]0.294514[/C][/ROW]
[ROW][C]21[/C][C]-0.022675[/C][C]-0.2028[/C][C]0.419899[/C][/ROW]
[ROW][C]22[/C][C]-0.091149[/C][C]-0.8153[/C][C]0.208672[/C][/ROW]
[ROW][C]23[/C][C]-0.050226[/C][C]-0.4492[/C][C]0.327239[/C][/ROW]
[ROW][C]24[/C][C]-0.06846[/C][C]-0.6123[/C][C]0.271028[/C][/ROW]
[ROW][C]25[/C][C]-0.089826[/C][C]-0.8034[/C][C]0.212054[/C][/ROW]
[ROW][C]26[/C][C]-0.196982[/C][C]-1.7619[/C][C]0.040957[/C][/ROW]
[ROW][C]27[/C][C]-0.18373[/C][C]-1.6433[/C][C]0.052119[/C][/ROW]
[ROW][C]28[/C][C]-0.166928[/C][C]-1.4931[/C][C]0.069679[/C][/ROW]
[ROW][C]29[/C][C]-0.099877[/C][C]-0.8933[/C][C]0.187181[/C][/ROW]
[ROW][C]30[/C][C]-0.092915[/C][C]-0.8311[/C][C]0.204208[/C][/ROW]
[ROW][C]31[/C][C]-0.119024[/C][C]-1.0646[/C][C]0.145134[/C][/ROW]
[ROW][C]32[/C][C]-0.090145[/C][C]-0.8063[/C][C]0.211236[/C][/ROW]
[ROW][C]33[/C][C]-0.100741[/C][C]-0.9011[/C][C]0.185132[/C][/ROW]
[ROW][C]34[/C][C]-0.147007[/C][C]-1.3149[/C][C]0.096154[/C][/ROW]
[ROW][C]35[/C][C]-0.166258[/C][C]-1.4871[/C][C]0.070465[/C][/ROW]
[ROW][C]36[/C][C]-0.148472[/C][C]-1.328[/C][C]0.093982[/C][/ROW]
[ROW][C]37[/C][C]-0.111473[/C][C]-0.997[/C][C]0.160875[/C][/ROW]
[ROW][C]38[/C][C]-0.158507[/C][C]-1.4177[/C][C]0.080077[/C][/ROW]
[ROW][C]39[/C][C]-0.167436[/C][C]-1.4976[/C][C]0.069088[/C][/ROW]
[ROW][C]40[/C][C]-0.1718[/C][C]-1.5366[/C][C]0.064166[/C][/ROW]
[ROW][C]41[/C][C]-0.154185[/C][C]-1.3791[/C][C]0.085858[/C][/ROW]
[ROW][C]42[/C][C]-0.212997[/C][C]-1.9051[/C][C]0.03018[/C][/ROW]
[ROW][C]43[/C][C]-0.215528[/C][C]-1.9277[/C][C]0.028718[/C][/ROW]
[ROW][C]44[/C][C]-0.238327[/C][C]-2.1317[/C][C]0.018052[/C][/ROW]
[ROW][C]45[/C][C]-0.203457[/C][C]-1.8198[/C][C]0.036267[/C][/ROW]
[ROW][C]46[/C][C]-0.226162[/C][C]-2.0229[/C][C]0.023215[/C][/ROW]
[ROW][C]47[/C][C]-0.236944[/C][C]-2.1193[/C][C]0.018583[/C][/ROW]
[ROW][C]48[/C][C]-0.210006[/C][C]-1.8784[/C][C]0.031988[/C][/ROW]
[/TABLE]
Source: https://freestatistics.org/blog/index.php?pk=194155&T=1

Globally Unique Identifier (entire table): ba.freestatistics.org/blog/index.php?pk=194155&T=1

As an alternative you can also use a QR Code:  

The GUIDs for individual cells are displayed in the table below:

Autocorrelation Function
Time lag kACF(k)T-STATP-value
10.657735.88290
20.5793045.18151e-06
30.4889044.37291.8e-05
40.506734.53231e-05
50.4915024.39611.7e-05
60.4431783.96398e-05
70.4006313.58340.000291
80.3379353.02260.001683
90.3232242.8910.002471
100.2080891.86120.033194
110.1821211.62890.053629
120.2348922.10090.019397
130.1624851.45330.075025
140.1019050.91150.182393
150.0369550.33050.370929
160.038590.34520.365441
170.0075310.06740.473233
180.0374430.33490.369288
190.0199220.17820.429514
20-0.060646-0.54240.294514
21-0.022675-0.20280.419899
22-0.091149-0.81530.208672
23-0.050226-0.44920.327239
24-0.06846-0.61230.271028
25-0.089826-0.80340.212054
26-0.196982-1.76190.040957
27-0.18373-1.64330.052119
28-0.166928-1.49310.069679
29-0.099877-0.89330.187181
30-0.092915-0.83110.204208
31-0.119024-1.06460.145134
32-0.090145-0.80630.211236
33-0.100741-0.90110.185132
34-0.147007-1.31490.096154
35-0.166258-1.48710.070465
36-0.148472-1.3280.093982
37-0.111473-0.9970.160875
38-0.158507-1.41770.080077
39-0.167436-1.49760.069088
40-0.1718-1.53660.064166
41-0.154185-1.37910.085858
42-0.212997-1.90510.03018
43-0.215528-1.92770.028718
44-0.238327-2.13170.018052
45-0.203457-1.81980.036267
46-0.226162-2.02290.023215
47-0.236944-2.11930.018583
48-0.210006-1.87840.031988


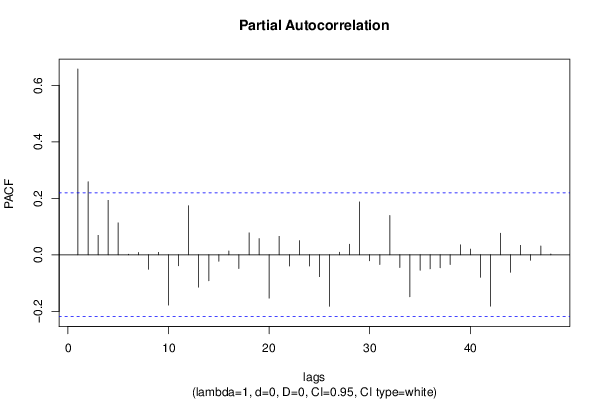
Partial Autocorrelation Function
Time lag kPACF(k)T-STATP-value
10.657735.88290
20.2585442.31250.011661
30.0686320.61390.270525
40.1925161.72190.044475
50.1128021.00890.158025
60.0017080.01530.493925
70.0082050.07340.470839
8-0.051643-0.46190.322699
90.0085670.07660.469557
10-0.178249-1.59430.057405
11-0.039062-0.34940.363861
120.1732741.54980.062567
13-0.114663-1.02560.154092
14-0.09203-0.82310.206438
15-0.022858-0.20440.419262
160.0130140.11640.453813
17-0.048731-0.43590.332056
180.0775350.69350.245004
190.0570250.510.305711
20-0.153564-1.37350.086715
210.0651570.58280.28084
22-0.040184-0.35940.360115
230.0501110.44820.327609
24-0.040122-0.35890.360322
25-0.077444-0.69270.245257
26-0.182484-1.63220.053285
270.0090050.08050.468005
280.037460.33510.369231
290.1870771.67330.049091
30-0.021009-0.18790.42571
31-0.03451-0.30870.379189
320.1391051.24420.108531
33-0.044886-0.40150.344572
34-0.148567-1.32880.093842
35-0.055117-0.4930.311687
36-0.049912-0.44640.328247
37-0.045862-0.41020.341376
38-0.034754-0.31080.378362
390.0350050.31310.377512
400.0199540.17850.429402
41-0.079747-0.71330.238875
42-0.181918-1.62710.053822
430.075930.67910.249505
44-0.062075-0.55520.29015
450.0332750.29760.383381
46-0.019511-0.17450.430952
470.0309860.27710.39119
480.0029220.02610.489607

\begin{tabular}{lllllllll}
\hline
Partial Autocorrelation Function \tabularnewline
Time lag k & PACF(k) & T-STAT & P-value \tabularnewline
1 & 0.65773 & 5.8829 & 0 \tabularnewline
2 & 0.258544 & 2.3125 & 0.011661 \tabularnewline
3 & 0.068632 & 0.6139 & 0.270525 \tabularnewline
4 & 0.192516 & 1.7219 & 0.044475 \tabularnewline
5 & 0.112802 & 1.0089 & 0.158025 \tabularnewline
6 & 0.001708 & 0.0153 & 0.493925 \tabularnewline
7 & 0.008205 & 0.0734 & 0.470839 \tabularnewline
8 & -0.051643 & -0.4619 & 0.322699 \tabularnewline
9 & 0.008567 & 0.0766 & 0.469557 \tabularnewline
10 & -0.178249 & -1.5943 & 0.057405 \tabularnewline
11 & -0.039062 & -0.3494 & 0.363861 \tabularnewline
12 & 0.173274 & 1.5498 & 0.062567 \tabularnewline
13 & -0.114663 & -1.0256 & 0.154092 \tabularnewline
14 & -0.09203 & -0.8231 & 0.206438 \tabularnewline
15 & -0.022858 & -0.2044 & 0.419262 \tabularnewline
16 & 0.013014 & 0.1164 & 0.453813 \tabularnewline
17 & -0.048731 & -0.4359 & 0.332056 \tabularnewline
18 & 0.077535 & 0.6935 & 0.245004 \tabularnewline
19 & 0.057025 & 0.51 & 0.305711 \tabularnewline
20 & -0.153564 & -1.3735 & 0.086715 \tabularnewline
21 & 0.065157 & 0.5828 & 0.28084 \tabularnewline
22 & -0.040184 & -0.3594 & 0.360115 \tabularnewline
23 & 0.050111 & 0.4482 & 0.327609 \tabularnewline
24 & -0.040122 & -0.3589 & 0.360322 \tabularnewline
25 & -0.077444 & -0.6927 & 0.245257 \tabularnewline
26 & -0.182484 & -1.6322 & 0.053285 \tabularnewline
27 & 0.009005 & 0.0805 & 0.468005 \tabularnewline
28 & 0.03746 & 0.3351 & 0.369231 \tabularnewline
29 & 0.187077 & 1.6733 & 0.049091 \tabularnewline
30 & -0.021009 & -0.1879 & 0.42571 \tabularnewline
31 & -0.03451 & -0.3087 & 0.379189 \tabularnewline
32 & 0.139105 & 1.2442 & 0.108531 \tabularnewline
33 & -0.044886 & -0.4015 & 0.344572 \tabularnewline
34 & -0.148567 & -1.3288 & 0.093842 \tabularnewline
35 & -0.055117 & -0.493 & 0.311687 \tabularnewline
36 & -0.049912 & -0.4464 & 0.328247 \tabularnewline
37 & -0.045862 & -0.4102 & 0.341376 \tabularnewline
38 & -0.034754 & -0.3108 & 0.378362 \tabularnewline
39 & 0.035005 & 0.3131 & 0.377512 \tabularnewline
40 & 0.019954 & 0.1785 & 0.429402 \tabularnewline
41 & -0.079747 & -0.7133 & 0.238875 \tabularnewline
42 & -0.181918 & -1.6271 & 0.053822 \tabularnewline
43 & 0.07593 & 0.6791 & 0.249505 \tabularnewline
44 & -0.062075 & -0.5552 & 0.29015 \tabularnewline
45 & 0.033275 & 0.2976 & 0.383381 \tabularnewline
46 & -0.019511 & -0.1745 & 0.430952 \tabularnewline
47 & 0.030986 & 0.2771 & 0.39119 \tabularnewline
48 & 0.002922 & 0.0261 & 0.489607 \tabularnewline
\hline
\end{tabular}
%Source: https://freestatistics.org/blog/index.php?pk=194155&T=2

[TABLE]
[ROW][C]Partial Autocorrelation Function[/C][/ROW]
[ROW][C]Time lag k[/C][C]PACF(k)[/C][C]T-STAT[/C][C]P-value[/C][/ROW]
[ROW][C]1[/C][C]0.65773[/C][C]5.8829[/C][C]0[/C][/ROW]
[ROW][C]2[/C][C]0.258544[/C][C]2.3125[/C][C]0.011661[/C][/ROW]
[ROW][C]3[/C][C]0.068632[/C][C]0.6139[/C][C]0.270525[/C][/ROW]
[ROW][C]4[/C][C]0.192516[/C][C]1.7219[/C][C]0.044475[/C][/ROW]
[ROW][C]5[/C][C]0.112802[/C][C]1.0089[/C][C]0.158025[/C][/ROW]
[ROW][C]6[/C][C]0.001708[/C][C]0.0153[/C][C]0.493925[/C][/ROW]
[ROW][C]7[/C][C]0.008205[/C][C]0.0734[/C][C]0.470839[/C][/ROW]
[ROW][C]8[/C][C]-0.051643[/C][C]-0.4619[/C][C]0.322699[/C][/ROW]
[ROW][C]9[/C][C]0.008567[/C][C]0.0766[/C][C]0.469557[/C][/ROW]
[ROW][C]10[/C][C]-0.178249[/C][C]-1.5943[/C][C]0.057405[/C][/ROW]
[ROW][C]11[/C][C]-0.039062[/C][C]-0.3494[/C][C]0.363861[/C][/ROW]
[ROW][C]12[/C][C]0.173274[/C][C]1.5498[/C][C]0.062567[/C][/ROW]
[ROW][C]13[/C][C]-0.114663[/C][C]-1.0256[/C][C]0.154092[/C][/ROW]
[ROW][C]14[/C][C]-0.09203[/C][C]-0.8231[/C][C]0.206438[/C][/ROW]
[ROW][C]15[/C][C]-0.022858[/C][C]-0.2044[/C][C]0.419262[/C][/ROW]
[ROW][C]16[/C][C]0.013014[/C][C]0.1164[/C][C]0.453813[/C][/ROW]
[ROW][C]17[/C][C]-0.048731[/C][C]-0.4359[/C][C]0.332056[/C][/ROW]
[ROW][C]18[/C][C]0.077535[/C][C]0.6935[/C][C]0.245004[/C][/ROW]
[ROW][C]19[/C][C]0.057025[/C][C]0.51[/C][C]0.305711[/C][/ROW]
[ROW][C]20[/C][C]-0.153564[/C][C]-1.3735[/C][C]0.086715[/C][/ROW]
[ROW][C]21[/C][C]0.065157[/C][C]0.5828[/C][C]0.28084[/C][/ROW]
[ROW][C]22[/C][C]-0.040184[/C][C]-0.3594[/C][C]0.360115[/C][/ROW]
[ROW][C]23[/C][C]0.050111[/C][C]0.4482[/C][C]0.327609[/C][/ROW]
[ROW][C]24[/C][C]-0.040122[/C][C]-0.3589[/C][C]0.360322[/C][/ROW]
[ROW][C]25[/C][C]-0.077444[/C][C]-0.6927[/C][C]0.245257[/C][/ROW]
[ROW][C]26[/C][C]-0.182484[/C][C]-1.6322[/C][C]0.053285[/C][/ROW]
[ROW][C]27[/C][C]0.009005[/C][C]0.0805[/C][C]0.468005[/C][/ROW]
[ROW][C]28[/C][C]0.03746[/C][C]0.3351[/C][C]0.369231[/C][/ROW]
[ROW][C]29[/C][C]0.187077[/C][C]1.6733[/C][C]0.049091[/C][/ROW]
[ROW][C]30[/C][C]-0.021009[/C][C]-0.1879[/C][C]0.42571[/C][/ROW]
[ROW][C]31[/C][C]-0.03451[/C][C]-0.3087[/C][C]0.379189[/C][/ROW]
[ROW][C]32[/C][C]0.139105[/C][C]1.2442[/C][C]0.108531[/C][/ROW]
[ROW][C]33[/C][C]-0.044886[/C][C]-0.4015[/C][C]0.344572[/C][/ROW]
[ROW][C]34[/C][C]-0.148567[/C][C]-1.3288[/C][C]0.093842[/C][/ROW]
[ROW][C]35[/C][C]-0.055117[/C][C]-0.493[/C][C]0.311687[/C][/ROW]
[ROW][C]36[/C][C]-0.049912[/C][C]-0.4464[/C][C]0.328247[/C][/ROW]
[ROW][C]37[/C][C]-0.045862[/C][C]-0.4102[/C][C]0.341376[/C][/ROW]
[ROW][C]38[/C][C]-0.034754[/C][C]-0.3108[/C][C]0.378362[/C][/ROW]
[ROW][C]39[/C][C]0.035005[/C][C]0.3131[/C][C]0.377512[/C][/ROW]
[ROW][C]40[/C][C]0.019954[/C][C]0.1785[/C][C]0.429402[/C][/ROW]
[ROW][C]41[/C][C]-0.079747[/C][C]-0.7133[/C][C]0.238875[/C][/ROW]
[ROW][C]42[/C][C]-0.181918[/C][C]-1.6271[/C][C]0.053822[/C][/ROW]
[ROW][C]43[/C][C]0.07593[/C][C]0.6791[/C][C]0.249505[/C][/ROW]
[ROW][C]44[/C][C]-0.062075[/C][C]-0.5552[/C][C]0.29015[/C][/ROW]
[ROW][C]45[/C][C]0.033275[/C][C]0.2976[/C][C]0.383381[/C][/ROW]
[ROW][C]46[/C][C]-0.019511[/C][C]-0.1745[/C][C]0.430952[/C][/ROW]
[ROW][C]47[/C][C]0.030986[/C][C]0.2771[/C][C]0.39119[/C][/ROW]
[ROW][C]48[/C][C]0.002922[/C][C]0.0261[/C][C]0.489607[/C][/ROW]
[/TABLE]
Source: https://freestatistics.org/blog/index.php?pk=194155&T=2

Globally Unique Identifier (entire table): ba.freestatistics.org/blog/index.php?pk=194155&T=2

As an alternative you can also use a QR Code:  

The GUIDs for individual cells are displayed in the table below:

Partial Autocorrelation Function
Time lag kPACF(k)T-STATP-value
10.657735.88290
20.2585442.31250.011661
30.0686320.61390.270525
40.1925161.72190.044475
50.1128021.00890.158025
60.0017080.01530.493925
70.0082050.07340.470839
8-0.051643-0.46190.322699
90.0085670.07660.469557
10-0.178249-1.59430.057405
11-0.039062-0.34940.363861
120.1732741.54980.062567
13-0.114663-1.02560.154092
14-0.09203-0.82310.206438
15-0.022858-0.20440.419262
160.0130140.11640.453813
17-0.048731-0.43590.332056
180.0775350.69350.245004
190.0570250.510.305711
20-0.153564-1.37350.086715
210.0651570.58280.28084
22-0.040184-0.35940.360115
230.0501110.44820.327609
24-0.040122-0.35890.360322
25-0.077444-0.69270.245257
26-0.182484-1.63220.053285
270.0090050.08050.468005
280.037460.33510.369231
290.1870771.67330.049091
30-0.021009-0.18790.42571
31-0.03451-0.30870.379189
320.1391051.24420.108531
33-0.044886-0.40150.344572
34-0.148567-1.32880.093842
35-0.055117-0.4930.311687
36-0.049912-0.44640.328247
37-0.045862-0.41020.341376
38-0.034754-0.31080.378362
390.0350050.31310.377512
400.0199540.17850.429402
41-0.079747-0.71330.238875
42-0.181918-1.62710.053822
430.075930.67910.249505
44-0.062075-0.55520.29015
450.0332750.29760.383381
46-0.019511-0.17450.430952
470.0309860.27710.39119
480.0029220.02610.489607


Parameters (Session):
par1 = 48 ; par2 = 1 ; par3 = 0 ; par4 = 0 ; par5 = 12 ; par6 = White Noise ; par7 = 0.95 ;
Parameters (R input):
par1 = 48 ; par2 = 1 ; par3 = 0 ; par4 = 0 ; par5 = 12 ; par6 = White Noise ; par7 = 0.95 ; par8 = ;
R code (references can be found in the software module):
if (par1 == 'Default') {
par1 = 10*log10(length(x))
} else {
par1 <- as.numeric(par1)
}
par2 <- as.numeric(par2)
par3 <- as.numeric(par3)
par4 <- as.numeric(par4)
par5 <- as.numeric(par5)
if (par6 == 'White Noise') par6 <- 'white' else par6 <- 'ma'
par7 <- as.numeric(par7)
if (par8 != '') par8 <- as.numeric(par8)
ox <- x
if (par8 == '') {
if (par2 == 0) {
x <- log(x)
} else {
x <- (x ^ par2 - 1) / par2
}
} else {
x <- log(x,base=par8)
}
if (par3 > 0) x <- diff(x,lag=1,difference=par3)
if (par4 > 0) x <- diff(x,lag=par5,difference=par4)
bitmap(file='picts.png')
op <- par(mfrow=c(2,1))
plot(ox,type='l',main='Original Time Series',xlab='time',ylab='value')
if (par8=='') {
mytitle <- paste('Working Time Series (lambda=',par2,', d=',par3,', D=',par4,')',sep='')
mysub <- paste('(lambda=',par2,', d=',par3,', D=',par4,', CI=', par7, ', CI type=',par6,')',sep='')
} else {
mytitle <- paste('Working Time Series (base=',par8,', d=',par3,', D=',par4,')',sep='')
mysub <- paste('(base=',par8,', d=',par3,', D=',par4,', CI=', par7, ', CI type=',par6,')',sep='')
}
plot(x,type='l', main=mytitle,xlab='time',ylab='value')
par(op)
dev.off()
bitmap(file='pic1.png')
racf <- acf(x, par1, main='Autocorrelation', xlab='time lag', ylab='ACF', ci.type=par6, ci=par7, sub=mysub)
dev.off()
bitmap(file='pic2.png')
rpacf <- pacf(x,par1,main='Partial Autocorrelation',xlab='lags',ylab='PACF',sub=mysub)
dev.off()
(myacf <- c(racf$acf))
(mypacf <- c(rpacf$acf))
lengthx <- length(x)
sqrtn <- sqrt(lengthx)
load(file='createtable')
a<-table.start()
a<-table.row.start(a)
a<-table.element(a,'Autocorrelation Function',4,TRUE)
a<-table.row.end(a)
a<-table.row.start(a)
a<-table.element(a,'Time lag k',header=TRUE)
a<-table.element(a,hyperlink('basics.htm','ACF(k)','click here for more information about the Autocorrelation Function'),header=TRUE)
a<-table.element(a,'T-STAT',header=TRUE)
a<-table.element(a,'P-value',header=TRUE)
a<-table.row.end(a)
for (i in 2:(par1+1)) {
a<-table.row.start(a)
a<-table.element(a,i-1,header=TRUE)
a<-table.element(a,round(myacf[i],6))
mytstat <- myacf[i]*sqrtn
a<-table.element(a,round(mytstat,4))
a<-table.element(a,round(1-pt(abs(mytstat),lengthx),6))
a<-table.row.end(a)
}
a<-table.end(a)
table.save(a,file='mytable.tab')
a<-table.start()
a<-table.row.start(a)
a<-table.element(a,'Partial Autocorrelation Function',4,TRUE)
a<-table.row.end(a)
a<-table.row.start(a)
a<-table.element(a,'Time lag k',header=TRUE)
a<-table.element(a,hyperlink('basics.htm','PACF(k)','click here for more information about the Partial Autocorrelation Function'),header=TRUE)
a<-table.element(a,'T-STAT',header=TRUE)
a<-table.element(a,'P-value',header=TRUE)
a<-table.row.end(a)
for (i in 1:par1) {
a<-table.row.start(a)
a<-table.element(a,i,header=TRUE)
a<-table.element(a,round(mypacf[i],6))
mytstat <- mypacf[i]*sqrtn
a<-table.element(a,round(mytstat,4))
a<-table.element(a,round(1-pt(abs(mytstat),lengthx),6))
a<-table.row.end(a)
}
a<-table.end(a)
table.save(a,file='mytable1.tab')