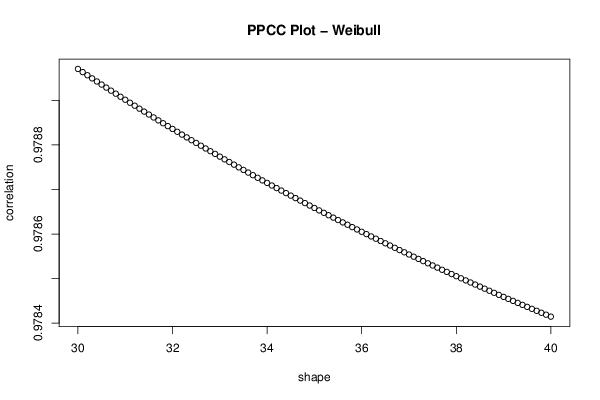
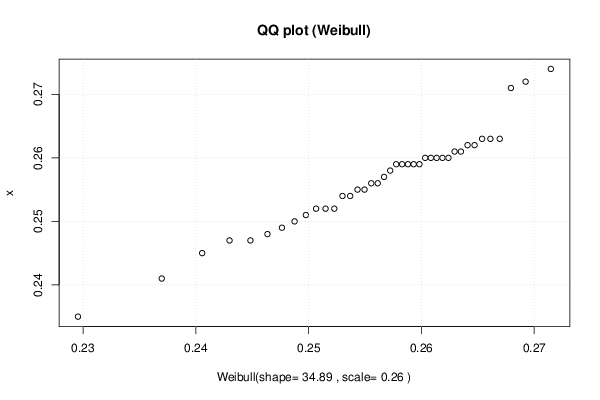
library(MASS)
PPCCWeibull <- function(shape, scale, x)
{
x <- sort(x)
pp <- ppoints(x)
cor(qweibull(pp, shape=shape, scale=scale), x)
}
par1 <- as.numeric(par1)
par2 <- as.numeric(par2)
if (par1 < 0.1) par1 <- 0.1
if (par1 > 50) par1 <- 50
if (par2 < 0.1) par2 <- 0.1
if (par2 > 50) par2 <- 50
par1h <- par1*10
par2h <- par2*10
sortx <- sort(x)
c <- array(NA,dim=c(par2h))
for (i in par1h:par2h)
{
c[i] <- cor(qweibull(ppoints(x), shape=i/10,scale=2),sortx)
}
bitmap(file='test1.png')
plot((par1h:par2h)/10,c[par1h:par2h],xlab='shape',ylab='correlation',main='PPCC Plot - Weibull')
dev.off()
f<-fitdistr(x, 'weibull')
f$estimate
f$sd
xlab <- paste('Weibull(shape=',round(f$estimate[[1]],2))
xlab <- paste(xlab,', scale=')
xlab <- paste(xlab,round(f$estimate[[2]],2))
xlab <- paste(xlab,')')
bitmap(file='test2.png')
qqplot(qweibull(ppoints(x), shape=f$estimate[[1]], scale=f$estimate[[2]]), x, main='QQ plot (Weibull)', xlab=xlab )
grid()
dev.off()
load(file='createtable')
a<-table.start()
a<-table.row.start(a)
a<-table.element(a,'Parameter',1,TRUE)
a<-table.element(a,'Estimated Value',1,TRUE)
a<-table.element(a,'Standard Deviation',1,TRUE)
a<-table.row.end(a)
a<-table.row.start(a)
a<-table.element(a,'shape',header=TRUE)
a<-table.element(a,f$estimate[1])
a<-table.element(a,f$sd[1])
a<-table.row.end(a)
a<-table.row.start(a)
a<-table.element(a,'scale',header=TRUE)
a<-table.element(a,f$estimate[2])
a<-table.element(a,f$sd[2])
a<-table.row.end(a)
a<-table.end(a)
table.save(a,file='mytable.tab')
|


