Free Statistics
of Irreproducible Research!
Description of Statistical Computation | ||||||||||||||||||||||||||||||
|---|---|---|---|---|---|---|---|---|---|---|---|---|---|---|---|---|---|---|---|---|---|---|---|---|---|---|---|---|---|---|
| Author's title | ||||||||||||||||||||||||||||||
| Author | *The author of this computation has been verified* | |||||||||||||||||||||||||||||
| R Software Module | rwasp_Distributional Plots.wasp | |||||||||||||||||||||||||||||
| Title produced by software | Histogram, QQplot and Density | |||||||||||||||||||||||||||||
| Date of computation | Mon, 21 Jan 2013 08:11:10 -0500 | |||||||||||||||||||||||||||||
| Cite this page as follows | Statistical Computations at FreeStatistics.org, Office for Research Development and Education, URL https://freestatistics.org/blog/index.php?v=date/2013/Jan/21/t1358773890m3iv5kyahku8rxc.htm/, Retrieved Mon, 27 Apr 2026 10:46:52 +0000 | |||||||||||||||||||||||||||||
| Statistical Computations at FreeStatistics.org, Office for Research Development and Education, URL https://freestatistics.org/blog/index.php?pk=205864, Retrieved Mon, 27 Apr 2026 10:46:52 +0000 | ||||||||||||||||||||||||||||||
| QR Codes: | ||||||||||||||||||||||||||||||
|
| ||||||||||||||||||||||||||||||
| Original text written by user: | ||||||||||||||||||||||||||||||
| IsPrivate? | No (this computation is public) | |||||||||||||||||||||||||||||
| User-defined keywords | ||||||||||||||||||||||||||||||
| Estimated Impact | 363 | |||||||||||||||||||||||||||||
Tree of Dependent Computations | ||||||||||||||||||||||||||||||
| Family? (F = Feedback message, R = changed R code, M = changed R Module, P = changed Parameters, D = changed Data) | ||||||||||||||||||||||||||||||
| - [Aston University Statistical Software] [Test of Two Means] [2009-11-10 17:16:17] [98fd0e87c3eb04e0cc2efde01dbafab6] - R P [Aston University Statistical Software] [Compare Two Means] [2009-11-11 08:09:40] [74be16979710d4c4e7c6647856088456] - D [Aston University Statistical Software] [PY2236 Week 6 dat...] [2009-11-11 12:53:10] [74be16979710d4c4e7c6647856088456] - P [T-Tests] [Week 9 PY2236] [2010-11-24 14:41:08] [74be16979710d4c4e7c6647856088456] - D [T-Tests] [PY2236 Week 9 Dat...] [2010-11-30 18:04:40] [74be16979710d4c4e7c6647856088456] - RM D [T-Tests] [PY2236 Week 9 Dat...] [2012-11-27 19:46:15] [74be16979710d4c4e7c6647856088456] - RMPD [Histogram, QQplot and Density] [P1cat] [2013-01-21 13:05:03] [3725c9bcdd215e9afeb5e268ec40865d] - R D [Histogram, QQplot and Density] [p1noncat] [2013-01-21 13:07:07] [3725c9bcdd215e9afeb5e268ec40865d] - D [Histogram, QQplot and Density] [part 2 cat] [2013-01-21 13:08:40] [3725c9bcdd215e9afeb5e268ec40865d] - D [Histogram, QQplot and Density] [p2 non cat] [2013-01-21 13:11:10] [9c9871bec7fca0615213f8a921560794] [Current] | ||||||||||||||||||||||||||||||
| Feedback Forum | ||||||||||||||||||||||||||||||
Post a new message | ||||||||||||||||||||||||||||||
Dataset | ||||||||||||||||||||||||||||||
| Dataseries X: | ||||||||||||||||||||||||||||||
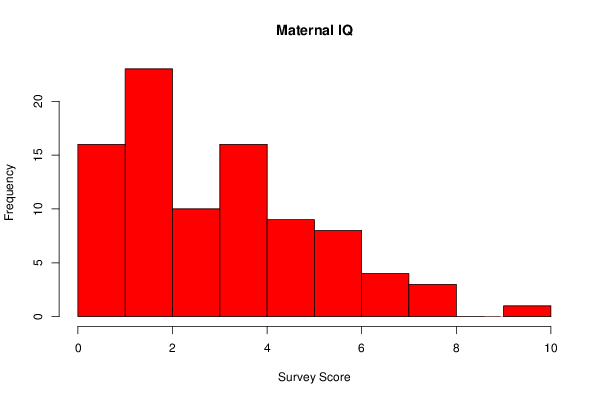
5 5 4 6 1 1 7 1 6 4 1 4 2 5 5 1 4 2 5 1 4 1 2 5 2 8 3 2 4 2 3 2 8 6 5 3 2 3 4 2 4 2 7 1 2 3 4 4 6 2 2 3 4 1 3 3 2 0 5 2 7 4 1 2 6 1 3 4 4 8 5 2 6 2 7 0 0 1 4 2 2 3 2 6 4 1 6 10 2 2 | ||||||||||||||||||||||||||||||
Tables (Output of Computation) | ||||||||||||||||||||||||||||||
| ||||||||||||||||||||||||||||||
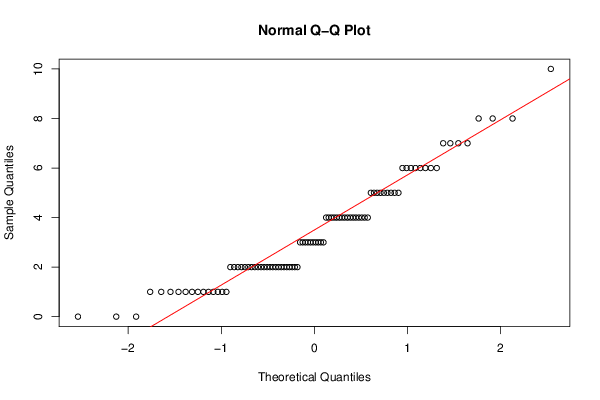
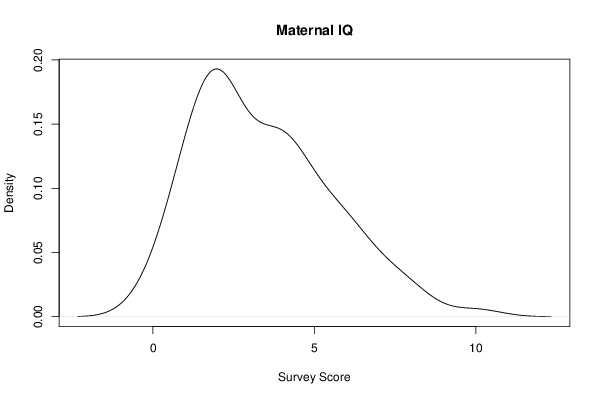
Figures (Output of Computation) | ||||||||||||||||||||||||||||||
Input Parameters & R Code | ||||||||||||||||||||||||||||||
| Parameters (Session): | ||||||||||||||||||||||||||||||
| par1 = 10 ; | ||||||||||||||||||||||||||||||
| Parameters (R input): | ||||||||||||||||||||||||||||||
| par1 = 10 ; | ||||||||||||||||||||||||||||||
| R code (references can be found in the software module): | ||||||||||||||||||||||||||||||
par1 <- '10' | ||||||||||||||||||||||||||||||