\begin{tabular}{lllllllll}
\hline
Summary of computational transaction \tabularnewline
Raw Input & view raw input (R code)  \tabularnewline
Raw Output & view raw output of R engine  \tabularnewline
Computing time & 1 seconds \tabularnewline
R Server & 'Gwilym Jenkins' @ 72.249.127.135 \tabularnewline
\hline
\end{tabular}
%Source: https://freestatistics.org/blog/index.php?pk=20959&T=0
[TABLE]
[ROW][C]Summary of computational transaction[/C][/ROW]
[ROW][C]Raw Input[/C][C]view raw input (R code) [/C][/ROW]
[ROW][C]Raw Output[/C][C]view raw output of R engine [/C][/ROW]
[ROW][C]Computing time[/C][C]1 seconds[/C][/ROW]
[ROW][C]R Server[/C][C]'Gwilym Jenkins' @ 72.249.127.135[/C][/ROW]
[/TABLE]
Source: https://freestatistics.org/blog/index.php?pk=20959&T=0
If you paste this QR Code into your document, anyone with a smartphone or tablet will be able to scan it and view this table in a browser.
If you paste this QR Code into your document, anyone with a smartphone or tablet will be able to scan it and view this table in a browser.
If you paste this QR Code into your document, anyone with a smartphone or tablet will be able to scan it and view this table in a browser.
If you paste this QR Code into your document, anyone with a smartphone or tablet will be able to scan it and view this table in a browser.
If you paste this QR Code into your document, anyone with a smartphone or tablet will be able to scan it and view this table in a browser.
| Boxplot statistics | | Variable | lower whisker | lower hinge | median | upper hinge | upper whisker | | total | 86 | 96.2 | 101.7 | 106 | 115.5 | | clothing | 66.5 | 80.6 | 87.3 | 94.1 | 109.7 | | afzet | 96.3 | 96.8 | 97.3 | 100 | 100.6 | | investeringen | 28.4 | 42.8 | 54.5 | 72 | 112 | c(4.704110133843, 4.5685062016165, 4.62399194022868, 4.66532410880784, 4.39444915467244, 4.55071400019203, 4.61512051684126, 4.69501088998788, 4.62790967295758, 4.50755735712109, 4.56642935767166, 4.56538931597625, 4.66343909411207, 4.63569939102291, 4.62497281328427, 4.65109911787649, 4.45434729625351, 4.52287494326126, 4.671893818031, 4.72384171570559, 4.62202730305451, 4.52178857704904, 4.57882621064849, 4.57471097850338, 4.65776263610726, 4.63181211693451, 4.58598736657132, 4.64918707140487, Boxplot Notches | | Variable | lower bound | median | upper bound | | total | 99.717476951119 | 101.7 | 103.682523048881 | | clothing | 84.5689733510313 | 87.3 | 90.0310266489687 | | afzet | 96.6526455350593 | 97.3 | 97.9473544649407 | | investeringen | 48.5928905074159 | 54.5 | 60.4071094925841 | c(4.6931810633108, 4.48413185761104, 4.54648118963941, 4.58802402715312, 4.45898767581001, 4.38949864951258, 4.64535197562092, 4.68398136641238, 4.5368913452348, 4.275276264727, 4.54435804659133, 4.55282370561588, 4.5685062016165, 4.51195780426591, 4.43556740160191, 4.45898767581001, 4.47733681447821, 4.31882055877009, 4.69774936728118, 4.63472898822964, 4.40793801645838, 4.21950770517611, 4.5685062016165, 4.54648118963941, 4.49980967033027, 4.47733681447821, 4.33204826486764, 4.41279829334063, 4.39937527300849, Boxplot Notches | | Variable | lower bound | median | upper bound | | total | 99.717476951119 | 101.7 | 103.682523048881 | | clothing | 84.5689733510313 | 87.3 | 90.0310266489687 | | afzet | 96.6526455350593 | 97.3 | 97.9473544649407 | | investeringen | 48.5928905074159 | 54.5 | 60.4071094925841 | c(4.60416968565451, 4.60316818331742, 4.60316818331742, 4.60816569496789, 4.60416968565451, 4.60416968565451, 4.60517018598809, 4.60616968632117, 4.60616968632117, 4.60716818865076, 4.60816569496789, 4.61115225766564, 4.60517018598809, 4.60616968632117, 4.60716818865076, 4.60517018598809, 4.60616968632117, 4.60616968632117, 4.60616968632117, 4.61015772749913, 4.61015772749913, 4.61015772749913, 4.56746831880408, 4.56746831880408, 4.57264699428253, 4.57264699428253, 4.57367951889672, 4.57264699428253, Boxplot Notches | | Variable | lower bound | median | upper bound | | total | 99.717476951119 | 101.7 | 103.682523048881 | | clothing | 84.5689733510313 | 87.3 | 90.0310266489687 | | afzet | 96.6526455350593 | 97.3 | 97.9473544649407 | | investeringen | 48.5928905074159 | 54.5 | 60.4071094925841 | c(4.28358656186063, 4.0842942263686, 4.45085282560373, 4.47960696301275, 4.13995507347415, 4.46590811865458, 4.37197629882038, 4.71849887129509, 4.37197629882038, 4.88355921152828, 3.69137633431252, 4.23410650459726, 4.0842942263686, 4.30135873160643, 4.05004430332552, 4.39568296112137, 3.8416005411316, 3.72328088083127, 4.26549281841793, 4.21803603456465, 4.27666611901606, 4.98017608661155, 3.68135118769314, 3.94931879017184, 4.30000279919529, 4.26127043353808, 4.10758978897212, 4.11087386417331, Boxplot Notches | | Variable | lower bound | median | upper bound | | total | 99.717476951119 | 101.7 | 103.682523048881 | | clothing | 84.5689733510313 | 87.3 | 90.0310266489687 | | afzet | 96.6526455350593 | 97.3 | 97.9473544649407 | | investeringen | 48.5928905074159 | 54.5 | 60.4071094925841 |
\begin{tabular}{lllllllll}
\hline
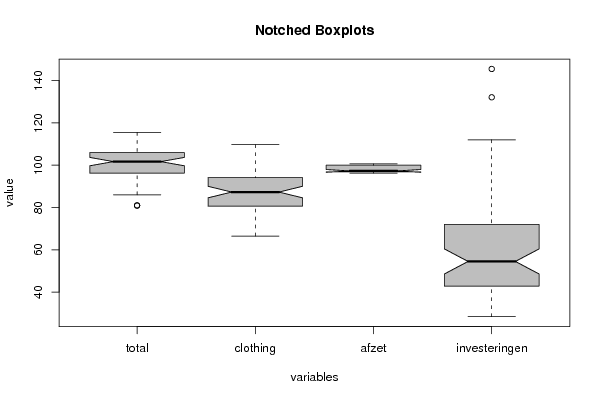
Boxplot statistics \tabularnewline
Variable & lower whisker & lower hinge & median & upper hinge & upper whisker \tabularnewline
total & 86 & 96.2 & 101.7 & 106 & 115.5 \tabularnewline
clothing & 66.5 & 80.6 & 87.3 & 94.1 & 109.7 \tabularnewline
afzet & 96.3 & 96.8 & 97.3 & 100 & 100.6 \tabularnewline
investeringen & 28.4 & 42.8 & 54.5 & 72 & 112 \tabularnewline
c(4.704110133843, 4.5685062016165, 4.62399194022868, 4.66532410880784, 4.39444915467244, 4.55071400019203, 4.61512051684126, 4.69501088998788, 4.62790967295758, 4.50755735712109, 4.56642935767166, 4.56538931597625, 4.66343909411207, 4.63569939102291, 4.62497281328427, 4.65109911787649, 4.45434729625351, 4.52287494326126, 4.671893818031, 4.72384171570559, 4.62202730305451, 4.52178857704904, 4.57882621064849, 4.57471097850338, 4.65776263610726, 4.63181211693451, 4.58598736657132, 4.64918707140487, Boxplot Notches \tabularnewline
Variable & lower bound & median & upper bound \tabularnewline
total & 99.717476951119 & 101.7 & 103.682523048881 \tabularnewline
clothing & 84.5689733510313 & 87.3 & 90.0310266489687 \tabularnewline
afzet & 96.6526455350593 & 97.3 & 97.9473544649407 \tabularnewline
investeringen & 48.5928905074159 & 54.5 & 60.4071094925841 \tabularnewline
c(4.6931810633108, 4.48413185761104, 4.54648118963941, 4.58802402715312, 4.45898767581001, 4.38949864951258, 4.64535197562092, 4.68398136641238, 4.5368913452348, 4.275276264727, 4.54435804659133, 4.55282370561588, 4.5685062016165, 4.51195780426591, 4.43556740160191, 4.45898767581001, 4.47733681447821, 4.31882055877009, 4.69774936728118, 4.63472898822964, 4.40793801645838, 4.21950770517611, 4.5685062016165, 4.54648118963941, 4.49980967033027, 4.47733681447821, 4.33204826486764, 4.41279829334063, 4.39937527300849, Boxplot Notches \tabularnewline
Variable & lower bound & median & upper bound \tabularnewline
total & 99.717476951119 & 101.7 & 103.682523048881 \tabularnewline
clothing & 84.5689733510313 & 87.3 & 90.0310266489687 \tabularnewline
afzet & 96.6526455350593 & 97.3 & 97.9473544649407 \tabularnewline
investeringen & 48.5928905074159 & 54.5 & 60.4071094925841 \tabularnewline
c(4.60416968565451, 4.60316818331742, 4.60316818331742, 4.60816569496789, 4.60416968565451, 4.60416968565451, 4.60517018598809, 4.60616968632117, 4.60616968632117, 4.60716818865076, 4.60816569496789, 4.61115225766564, 4.60517018598809, 4.60616968632117, 4.60716818865076, 4.60517018598809, 4.60616968632117, 4.60616968632117, 4.60616968632117, 4.61015772749913, 4.61015772749913, 4.61015772749913, 4.56746831880408, 4.56746831880408, 4.57264699428253, 4.57264699428253, 4.57367951889672, 4.57264699428253, Boxplot Notches \tabularnewline
Variable & lower bound & median & upper bound \tabularnewline
total & 99.717476951119 & 101.7 & 103.682523048881 \tabularnewline
clothing & 84.5689733510313 & 87.3 & 90.0310266489687 \tabularnewline
afzet & 96.6526455350593 & 97.3 & 97.9473544649407 \tabularnewline
investeringen & 48.5928905074159 & 54.5 & 60.4071094925841 \tabularnewline
c(4.28358656186063, 4.0842942263686, 4.45085282560373, 4.47960696301275, 4.13995507347415, 4.46590811865458, 4.37197629882038, 4.71849887129509, 4.37197629882038, 4.88355921152828, 3.69137633431252, 4.23410650459726, 4.0842942263686, 4.30135873160643, 4.05004430332552, 4.39568296112137, 3.8416005411316, 3.72328088083127, 4.26549281841793, 4.21803603456465, 4.27666611901606, 4.98017608661155, 3.68135118769314, 3.94931879017184, 4.30000279919529, 4.26127043353808, 4.10758978897212, 4.11087386417331, Boxplot Notches \tabularnewline
Variable & lower bound & median & upper bound \tabularnewline
total & 99.717476951119 & 101.7 & 103.682523048881 \tabularnewline
clothing & 84.5689733510313 & 87.3 & 90.0310266489687 \tabularnewline
afzet & 96.6526455350593 & 97.3 & 97.9473544649407 \tabularnewline
investeringen & 48.5928905074159 & 54.5 & 60.4071094925841 \tabularnewline
\hline
\end{tabular}
%Source: https://freestatistics.org/blog/index.php?pk=20959&T=1
[TABLE]
[ROW][C]Boxplot statistics[/C][/ROW]
[ROW][C]Variable[/C][C]lower whisker[/C][C]lower hinge[/C][C]median[/C][C]upper hinge[/C][C]upper whisker[/C][/ROW]
[ROW][C]total[/C][C]86[/C][C]96.2[/C][C]101.7[/C][C]106[/C][C]115.5[/C][/ROW]
[ROW][C]clothing[/C][C]66.5[/C][C]80.6[/C][C]87.3[/C][C]94.1[/C][C]109.7[/C][/ROW]
[ROW][C]afzet[/C][C]96.3[/C][C]96.8[/C][C]97.3[/C][C]100[/C][C]100.6[/C][/ROW]
[ROW][C]investeringen[/C][C]28.4[/C][C]42.8[/C][C]54.5[/C][C]72[/C][C]112[/C][/ROW]
c(4.704110133843, 4.5685062016165, 4.62399194022868, 4.66532410880784, 4.39444915467244, 4.55071400019203, 4.61512051684126, 4.69501088998788, 4.62790967295758, 4.50755735712109, 4.56642935767166, 4.56538931597625, 4.66343909411207, 4.63569939102291, 4.62497281328427, 4.65109911787649, 4.45434729625351, 4.52287494326126, 4.671893818031, 4.72384171570559, 4.62202730305451, 4.52178857704904, 4.57882621064849, 4.57471097850338, 4.65776263610726, 4.63181211693451, 4.58598736657132, 4.64918707140487, [C]Boxplot Notches[/C][/ROW]
[ROW][C]Variable[/C][C]lower bound[/C][C]median[/C][C]upper bound[/C][/ROW]
[ROW][C]total[/C][C]99.717476951119[/C][C]101.7[/C][C]103.682523048881[/C][/ROW]
[ROW][C]clothing[/C][C]84.5689733510313[/C][C]87.3[/C][C]90.0310266489687[/C][/ROW]
[ROW][C]afzet[/C][C]96.6526455350593[/C][C]97.3[/C][C]97.9473544649407[/C][/ROW]
[ROW][C]investeringen[/C][C]48.5928905074159[/C][C]54.5[/C][C]60.4071094925841[/C][/ROW]
 c(4.6931810633108, 4.48413185761104, 4.54648118963941, 4.58802402715312, 4.45898767581001, 4.38949864951258, 4.64535197562092, 4.68398136641238, 4.5368913452348, 4.275276264727, 4.54435804659133, 4.55282370561588, 4.5685062016165, 4.51195780426591, 4.43556740160191, 4.45898767581001, 4.47733681447821, 4.31882055877009, 4.69774936728118, 4.63472898822964, 4.40793801645838, 4.21950770517611, 4.5685062016165, 4.54648118963941, 4.49980967033027, 4.47733681447821, 4.33204826486764, 4.41279829334063, 4.39937527300849, [C]Boxplot Notches[/C][/ROW]
[ROW][C]Variable[/C][C]lower bound[/C][C]median[/C][C]upper bound[/C][/ROW]
[ROW][C]total[/C][C]99.717476951119[/C][C]101.7[/C][C]103.682523048881[/C][/ROW]
[ROW][C]clothing[/C][C]84.5689733510313[/C][C]87.3[/C][C]90.0310266489687[/C][/ROW]
[ROW][C]afzet[/C][C]96.6526455350593[/C][C]97.3[/C][C]97.9473544649407[/C][/ROW]
[ROW][C]investeringen[/C][C]48.5928905074159[/C][C]54.5[/C][C]60.4071094925841[/C][/ROW]
 c(4.60416968565451, 4.60316818331742, 4.60316818331742, 4.60816569496789, 4.60416968565451, 4.60416968565451, 4.60517018598809, 4.60616968632117, 4.60616968632117, 4.60716818865076, 4.60816569496789, 4.61115225766564, 4.60517018598809, 4.60616968632117, 4.60716818865076, 4.60517018598809, 4.60616968632117, 4.60616968632117, 4.60616968632117, 4.61015772749913, 4.61015772749913, 4.61015772749913, 4.56746831880408, 4.56746831880408, 4.57264699428253, 4.57264699428253, 4.57367951889672, 4.57264699428253, [C]Boxplot Notches[/C][/ROW]
[ROW][C]Variable[/C][C]lower bound[/C][C]median[/C][C]upper bound[/C][/ROW]
[ROW][C]total[/C][C]99.717476951119[/C][C]101.7[/C][C]103.682523048881[/C][/ROW]
[ROW][C]clothing[/C][C]84.5689733510313[/C][C]87.3[/C][C]90.0310266489687[/C][/ROW]
[ROW][C]afzet[/C][C]96.6526455350593[/C][C]97.3[/C][C]97.9473544649407[/C][/ROW]
[ROW][C]investeringen[/C][C]48.5928905074159[/C][C]54.5[/C][C]60.4071094925841[/C][/ROW]
 c(4.28358656186063, 4.0842942263686, 4.45085282560373, 4.47960696301275, 4.13995507347415, 4.46590811865458, 4.37197629882038, 4.71849887129509, 4.37197629882038, 4.88355921152828, 3.69137633431252, 4.23410650459726, 4.0842942263686, 4.30135873160643, 4.05004430332552, 4.39568296112137, 3.8416005411316, 3.72328088083127, 4.26549281841793, 4.21803603456465, 4.27666611901606, 4.98017608661155, 3.68135118769314, 3.94931879017184, 4.30000279919529, 4.26127043353808, 4.10758978897212, 4.11087386417331, [C]Boxplot Notches[/C][/ROW]
[ROW][C]Variable[/C][C]lower bound[/C][C]median[/C][C]upper bound[/C][/ROW]
[ROW][C]total[/C][C]99.717476951119[/C][C]101.7[/C][C]103.682523048881[/C][/ROW]
[ROW][C]clothing[/C][C]84.5689733510313[/C][C]87.3[/C][C]90.0310266489687[/C][/ROW]
[ROW][C]afzet[/C][C]96.6526455350593[/C][C]97.3[/C][C]97.9473544649407[/C][/ROW]
[ROW][C]investeringen[/C][C]48.5928905074159[/C][C]54.5[/C][C]60.4071094925841[/C][/ROW]
[/TABLE]
Source: https://freestatistics.org/blog/index.php?pk=20959&T=1
Globally Unique Identifier (entire table): ba.freestatistics.org/blog/index.php?pk=20959&T=1
As an alternative you can also use a QR Code:
The GUIDs for individual cells are displayed in the table below:
| Boxplot statistics | | Variable | lower whisker | lower hinge | median | upper hinge | upper whisker | | total | 86 | 96.2 | 101.7 | 106 | 115.5 | | clothing | 66.5 | 80.6 | 87.3 | 94.1 | 109.7 | | afzet | 96.3 | 96.8 | 97.3 | 100 | 100.6 | | investeringen | 28.4 | 42.8 | 54.5 | 72 | 112 | c(4.704110133843, 4.5685062016165, 4.62399194022868, 4.66532410880784, 4.39444915467244, 4.55071400019203, 4.61512051684126, 4.69501088998788, 4.62790967295758, 4.50755735712109, 4.56642935767166, 4.56538931597625, 4.66343909411207, 4.63569939102291, 4.62497281328427, 4.65109911787649, 4.45434729625351, 4.52287494326126, 4.671893818031, 4.72384171570559, 4.62202730305451, 4.52178857704904, 4.57882621064849, 4.57471097850338, 4.65776263610726, 4.63181211693451, 4.58598736657132, 4.64918707140487, Boxplot Notches | | Variable | lower bound | median | upper bound | | total | 99.717476951119 | 101.7 | 103.682523048881 | | clothing | 84.5689733510313 | 87.3 | 90.0310266489687 | | afzet | 96.6526455350593 | 97.3 | 97.9473544649407 | | investeringen | 48.5928905074159 | 54.5 | 60.4071094925841 | c(4.6931810633108, 4.48413185761104, 4.54648118963941, 4.58802402715312, 4.45898767581001, 4.38949864951258, 4.64535197562092, 4.68398136641238, 4.5368913452348, 4.275276264727, 4.54435804659133, 4.55282370561588, 4.5685062016165, 4.51195780426591, 4.43556740160191, 4.45898767581001, 4.47733681447821, 4.31882055877009, 4.69774936728118, 4.63472898822964, 4.40793801645838, 4.21950770517611, 4.5685062016165, 4.54648118963941, 4.49980967033027, 4.47733681447821, 4.33204826486764, 4.41279829334063, 4.39937527300849, Boxplot Notches | | Variable | lower bound | median | upper bound | | total | 99.717476951119 | 101.7 | 103.682523048881 | | clothing | 84.5689733510313 | 87.3 | 90.0310266489687 | | afzet | 96.6526455350593 | 97.3 | 97.9473544649407 | | investeringen | 48.5928905074159 | 54.5 | 60.4071094925841 | c(4.60416968565451, 4.60316818331742, 4.60316818331742, 4.60816569496789, 4.60416968565451, 4.60416968565451, 4.60517018598809, 4.60616968632117, 4.60616968632117, 4.60716818865076, 4.60816569496789, 4.61115225766564, 4.60517018598809, 4.60616968632117, 4.60716818865076, 4.60517018598809, 4.60616968632117, 4.60616968632117, 4.60616968632117, 4.61015772749913, 4.61015772749913, 4.61015772749913, 4.56746831880408, 4.56746831880408, 4.57264699428253, 4.57264699428253, 4.57367951889672, 4.57264699428253, Boxplot Notches | | Variable | lower bound | median | upper bound | | total | 99.717476951119 | 101.7 | 103.682523048881 | | clothing | 84.5689733510313 | 87.3 | 90.0310266489687 | | afzet | 96.6526455350593 | 97.3 | 97.9473544649407 | | investeringen | 48.5928905074159 | 54.5 | 60.4071094925841 | c(4.28358656186063, 4.0842942263686, 4.45085282560373, 4.47960696301275, 4.13995507347415, 4.46590811865458, 4.37197629882038, 4.71849887129509, 4.37197629882038, 4.88355921152828, 3.69137633431252, 4.23410650459726, 4.0842942263686, 4.30135873160643, 4.05004430332552, 4.39568296112137, 3.8416005411316, 3.72328088083127, 4.26549281841793, 4.21803603456465, 4.27666611901606, 4.98017608661155, 3.68135118769314, 3.94931879017184, 4.30000279919529, 4.26127043353808, 4.10758978897212, 4.11087386417331, Boxplot Notches | | Variable | lower bound | median | upper bound | | total | 99.717476951119 | 101.7 | 103.682523048881 | | clothing | 84.5689733510313 | 87.3 | 90.0310266489687 | | afzet | 96.6526455350593 | 97.3 | 97.9473544649407 | | investeringen | 48.5928905074159 | 54.5 | 60.4071094925841 |
If you paste this QR Code into your document, anyone with a smartphone or tablet will be able to scan it and view this table in a browser.
If you paste this QR Code into your document, anyone with a smartphone or tablet will be able to scan it and view this table in a browser.
If you paste this QR Code into your document, anyone with a smartphone or tablet will be able to scan it and view this table in a browser.
If you paste this QR Code into your document, anyone with a smartphone or tablet will be able to scan it and view this table in a browser.
If you paste this QR Code into your document, anyone with a smartphone or tablet will be able to scan it and view this table in a browser.
|