Free Statistics
of Irreproducible Research!
Description of Statistical Computation | |||||||||||||||||||||
|---|---|---|---|---|---|---|---|---|---|---|---|---|---|---|---|---|---|---|---|---|---|
| Author's title | |||||||||||||||||||||
| Author | *Unverified author* | ||||||||||||||||||||
| R Software Module | rwasp_meanplot.wasp | ||||||||||||||||||||
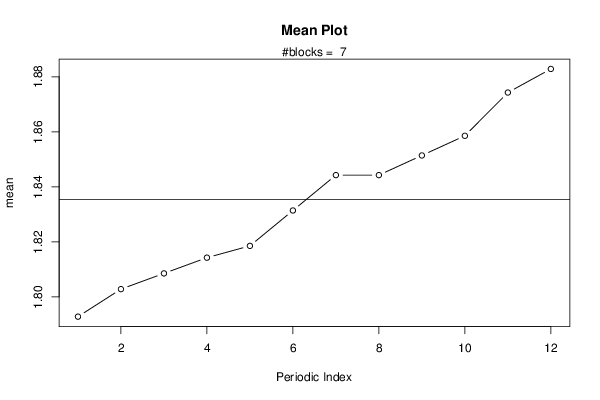
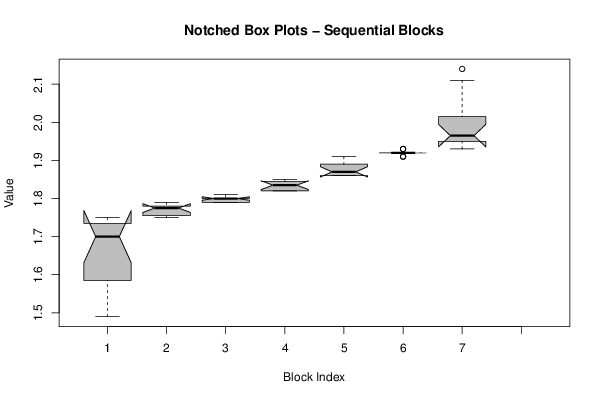
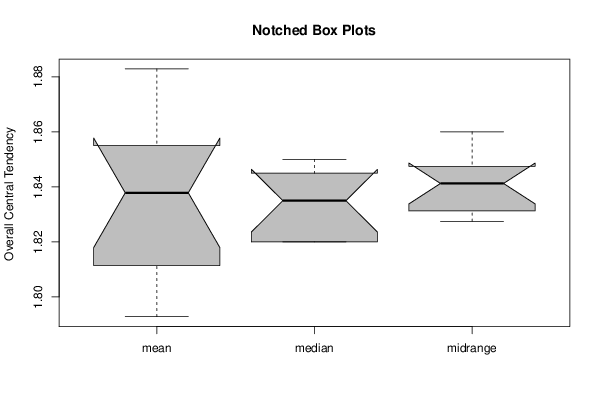
| Title produced by software | Mean Plot | ||||||||||||||||||||
| Date of computation | Fri, 20 Dec 2013 12:40:38 -0500 | ||||||||||||||||||||
| Cite this page as follows | Statistical Computations at FreeStatistics.org, Office for Research Development and Education, URL https://freestatistics.org/blog/index.php?v=date/2013/Dec/20/t1387561301xkrx25q9jtyvx5m.htm/, Retrieved Fri, 13 Feb 2026 04:06:23 +0000 | ||||||||||||||||||||
| Statistical Computations at FreeStatistics.org, Office for Research Development and Education, URL https://freestatistics.org/blog/index.php?pk=232479, Retrieved Fri, 13 Feb 2026 04:06:23 +0000 | |||||||||||||||||||||
| QR Codes: | |||||||||||||||||||||
|
| |||||||||||||||||||||
| Original text written by user: | |||||||||||||||||||||
| IsPrivate? | No (this computation is public) | ||||||||||||||||||||
| User-defined keywords | |||||||||||||||||||||
| Estimated Impact | 392 | ||||||||||||||||||||
Tree of Dependent Computations | |||||||||||||||||||||
| Family? (F = Feedback message, R = changed R code, M = changed R Module, P = changed Parameters, D = changed Data) | |||||||||||||||||||||
| - [Mean Plot] [] [2013-12-20 17:40:38] [2bef26084a4a59f589de449f00add791] [Current] | |||||||||||||||||||||
| Feedback Forum | |||||||||||||||||||||
Post a new message | |||||||||||||||||||||
Dataset | |||||||||||||||||||||
| Dataseries X: | |||||||||||||||||||||
1,49 1,55 1,57 1,6 1,61 1,68 1,72 1,72 1,73 1,74 1,74 1,75 1,75 1,75 1,75 1,76 1,76 1,77 1,78 1,78 1,78 1,78 1,78 1,79 1,79 1,79 1,79 1,79 1,79 1,8 1,8 1,8 1,8 1,8 1,81 1,81 1,82 1,82 1,82 1,82 1,83 1,83 1,84 1,84 1,84 1,85 1,85 1,85 1,86 1,86 1,86 1,86 1,87 1,87 1,87 1,87 1,88 1,9 1,9 1,91 1,91 1,91 1,92 1,92 1,92 1,92 1,92 1,92 1,92 1,92 1,93 1,93 1,93 1,94 1,95 1,95 1,95 1,95 1,98 1,98 2,01 2,02 2,11 2,14 | |||||||||||||||||||||
Tables (Output of Computation) | |||||||||||||||||||||
| |||||||||||||||||||||
Figures (Output of Computation) | |||||||||||||||||||||
Input Parameters & R Code | |||||||||||||||||||||
| Parameters (Session): | |||||||||||||||||||||
| par1 = 12 ; | |||||||||||||||||||||
| Parameters (R input): | |||||||||||||||||||||
| par1 = 12 ; | |||||||||||||||||||||
| R code (references can be found in the software module): | |||||||||||||||||||||
par1 <- as.numeric(par1) | |||||||||||||||||||||