\begin{tabular}{lllllllll}
\hline
Summary of computational transaction \tabularnewline
Raw Input & view raw input (R code)  \tabularnewline
Raw Output & view raw output of R engine  \tabularnewline
Computing time & 2 seconds \tabularnewline
R Server & 'Gwilym Jenkins' @ jenkins.wessa.net \tabularnewline
\hline
\end{tabular}
%Source: https://freestatistics.org/blog/index.php?pk=233482&T=0
[TABLE]
[ROW][C]Summary of computational transaction[/C][/ROW]
[ROW][C]Raw Input[/C][C]view raw input (R code) [/C][/ROW]
[ROW][C]Raw Output[/C][C]view raw output of R engine [/C][/ROW]
[ROW][C]Computing time[/C][C]2 seconds[/C][/ROW]
[ROW][C]R Server[/C][C]'Gwilym Jenkins' @ jenkins.wessa.net[/C][/ROW]
[/TABLE]
Source: https://freestatistics.org/blog/index.php?pk=233482&T=0
If you paste this QR Code into your document, anyone with a smartphone or tablet will be able to scan it and view this table in a browser.
If you paste this QR Code into your document, anyone with a smartphone or tablet will be able to scan it and view this table in a browser.
If you paste this QR Code into your document, anyone with a smartphone or tablet will be able to scan it and view this table in a browser.
If you paste this QR Code into your document, anyone with a smartphone or tablet will be able to scan it and view this table in a browser.
If you paste this QR Code into your document, anyone with a smartphone or tablet will be able to scan it and view this table in a browser.
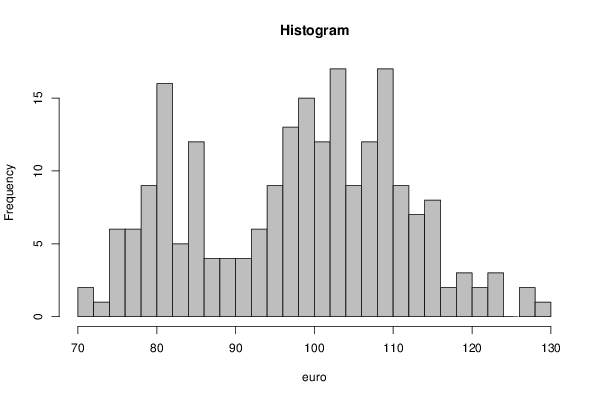
| Frequency Table (Histogram) | | Bins | Midpoint | Abs. Frequency | Rel. Frequency | Cumul. Rel. Freq. | Density | | [70,72[ | 71 | 2 | 0.009259 | 0.009259 | 0.00463 | | [72,74[ | 73 | 1 | 0.00463 | 0.013889 | 0.002315 | | [74,76[ | 75 | 6 | 0.027778 | 0.041667 | 0.013889 | | [76,78[ | 77 | 6 | 0.027778 | 0.069444 | 0.013889 | | [78,80[ | 79 | 9 | 0.041667 | 0.111111 | 0.020833 | | [80,82[ | 81 | 16 | 0.074074 | 0.185185 | 0.037037 | | [82,84[ | 83 | 5 | 0.023148 | 0.208333 | 0.011574 | | [84,86[ | 85 | 12 | 0.055556 | 0.263889 | 0.027778 | | [86,88[ | 87 | 4 | 0.018519 | 0.282407 | 0.009259 | | [88,90[ | 89 | 4 | 0.018519 | 0.300926 | 0.009259 | | [90,92[ | 91 | 4 | 0.018519 | 0.319444 | 0.009259 | | [92,94[ | 93 | 6 | 0.027778 | 0.347222 | 0.013889 | | [94,96[ | 95 | 9 | 0.041667 | 0.388889 | 0.020833 | | [96,98[ | 97 | 13 | 0.060185 | 0.449074 | 0.030093 | | [98,100[ | 99 | 15 | 0.069444 | 0.518519 | 0.034722 | | [100,102[ | 101 | 12 | 0.055556 | 0.574074 | 0.027778 | | [102,104[ | 103 | 17 | 0.078704 | 0.652778 | 0.039352 | | [104,106[ | 105 | 9 | 0.041667 | 0.694444 | 0.020833 | | [106,108[ | 107 | 12 | 0.055556 | 0.75 | 0.027778 | | [108,110[ | 109 | 17 | 0.078704 | 0.828704 | 0.039352 | | [110,112[ | 111 | 9 | 0.041667 | 0.87037 | 0.020833 | | [112,114[ | 113 | 7 | 0.032407 | 0.902778 | 0.016204 | | [114,116[ | 115 | 8 | 0.037037 | 0.939815 | 0.018519 | | [116,118[ | 117 | 2 | 0.009259 | 0.949074 | 0.00463 | | [118,120[ | 119 | 3 | 0.013889 | 0.962963 | 0.006944 | | [120,122[ | 121 | 2 | 0.009259 | 0.972222 | 0.00463 | | [122,124[ | 123 | 3 | 0.013889 | 0.986111 | 0.006944 | | [124,126[ | 125 | 0 | 0 | 0.986111 | 0 | | [126,128[ | 127 | 2 | 0.009259 | 0.99537 | 0.00463 | | [128,130] | 129 | 1 | 0.00463 | 1 | 0.002315 |
\begin{tabular}{lllllllll}
\hline
Frequency Table (Histogram) \tabularnewline
Bins & Midpoint & Abs. Frequency & Rel. Frequency & Cumul. Rel. Freq. & Density \tabularnewline
[70,72[ & 71 & 2 & 0.009259 & 0.009259 & 0.00463 \tabularnewline
[72,74[ & 73 & 1 & 0.00463 & 0.013889 & 0.002315 \tabularnewline
[74,76[ & 75 & 6 & 0.027778 & 0.041667 & 0.013889 \tabularnewline
[76,78[ & 77 & 6 & 0.027778 & 0.069444 & 0.013889 \tabularnewline
[78,80[ & 79 & 9 & 0.041667 & 0.111111 & 0.020833 \tabularnewline
[80,82[ & 81 & 16 & 0.074074 & 0.185185 & 0.037037 \tabularnewline
[82,84[ & 83 & 5 & 0.023148 & 0.208333 & 0.011574 \tabularnewline
[84,86[ & 85 & 12 & 0.055556 & 0.263889 & 0.027778 \tabularnewline
[86,88[ & 87 & 4 & 0.018519 & 0.282407 & 0.009259 \tabularnewline
[88,90[ & 89 & 4 & 0.018519 & 0.300926 & 0.009259 \tabularnewline
[90,92[ & 91 & 4 & 0.018519 & 0.319444 & 0.009259 \tabularnewline
[92,94[ & 93 & 6 & 0.027778 & 0.347222 & 0.013889 \tabularnewline
[94,96[ & 95 & 9 & 0.041667 & 0.388889 & 0.020833 \tabularnewline
[96,98[ & 97 & 13 & 0.060185 & 0.449074 & 0.030093 \tabularnewline
[98,100[ & 99 & 15 & 0.069444 & 0.518519 & 0.034722 \tabularnewline
[100,102[ & 101 & 12 & 0.055556 & 0.574074 & 0.027778 \tabularnewline
[102,104[ & 103 & 17 & 0.078704 & 0.652778 & 0.039352 \tabularnewline
[104,106[ & 105 & 9 & 0.041667 & 0.694444 & 0.020833 \tabularnewline
[106,108[ & 107 & 12 & 0.055556 & 0.75 & 0.027778 \tabularnewline
[108,110[ & 109 & 17 & 0.078704 & 0.828704 & 0.039352 \tabularnewline
[110,112[ & 111 & 9 & 0.041667 & 0.87037 & 0.020833 \tabularnewline
[112,114[ & 113 & 7 & 0.032407 & 0.902778 & 0.016204 \tabularnewline
[114,116[ & 115 & 8 & 0.037037 & 0.939815 & 0.018519 \tabularnewline
[116,118[ & 117 & 2 & 0.009259 & 0.949074 & 0.00463 \tabularnewline
[118,120[ & 119 & 3 & 0.013889 & 0.962963 & 0.006944 \tabularnewline
[120,122[ & 121 & 2 & 0.009259 & 0.972222 & 0.00463 \tabularnewline
[122,124[ & 123 & 3 & 0.013889 & 0.986111 & 0.006944 \tabularnewline
[124,126[ & 125 & 0 & 0 & 0.986111 & 0 \tabularnewline
[126,128[ & 127 & 2 & 0.009259 & 0.99537 & 0.00463 \tabularnewline
[128,130] & 129 & 1 & 0.00463 & 1 & 0.002315 \tabularnewline
\hline
\end{tabular}
%Source: https://freestatistics.org/blog/index.php?pk=233482&T=1
[TABLE]
[ROW][C]Frequency Table (Histogram)[/C][/ROW]
[ROW][C]Bins[/C][C]Midpoint[/C][C]Abs. Frequency[/C][C]Rel. Frequency[/C][C]Cumul. Rel. Freq.[/C][C]Density[/C][/ROW]
[ROW][C][70,72[[/C][C]71[/C][C]2[/C][C]0.009259[/C][C]0.009259[/C][C]0.00463[/C][/ROW]
[ROW][C][72,74[[/C][C]73[/C][C]1[/C][C]0.00463[/C][C]0.013889[/C][C]0.002315[/C][/ROW]
[ROW][C][74,76[[/C][C]75[/C][C]6[/C][C]0.027778[/C][C]0.041667[/C][C]0.013889[/C][/ROW]
[ROW][C][76,78[[/C][C]77[/C][C]6[/C][C]0.027778[/C][C]0.069444[/C][C]0.013889[/C][/ROW]
[ROW][C][78,80[[/C][C]79[/C][C]9[/C][C]0.041667[/C][C]0.111111[/C][C]0.020833[/C][/ROW]
[ROW][C][80,82[[/C][C]81[/C][C]16[/C][C]0.074074[/C][C]0.185185[/C][C]0.037037[/C][/ROW]
[ROW][C][82,84[[/C][C]83[/C][C]5[/C][C]0.023148[/C][C]0.208333[/C][C]0.011574[/C][/ROW]
[ROW][C][84,86[[/C][C]85[/C][C]12[/C][C]0.055556[/C][C]0.263889[/C][C]0.027778[/C][/ROW]
[ROW][C][86,88[[/C][C]87[/C][C]4[/C][C]0.018519[/C][C]0.282407[/C][C]0.009259[/C][/ROW]
[ROW][C][88,90[[/C][C]89[/C][C]4[/C][C]0.018519[/C][C]0.300926[/C][C]0.009259[/C][/ROW]
[ROW][C][90,92[[/C][C]91[/C][C]4[/C][C]0.018519[/C][C]0.319444[/C][C]0.009259[/C][/ROW]
[ROW][C][92,94[[/C][C]93[/C][C]6[/C][C]0.027778[/C][C]0.347222[/C][C]0.013889[/C][/ROW]
[ROW][C][94,96[[/C][C]95[/C][C]9[/C][C]0.041667[/C][C]0.388889[/C][C]0.020833[/C][/ROW]
[ROW][C][96,98[[/C][C]97[/C][C]13[/C][C]0.060185[/C][C]0.449074[/C][C]0.030093[/C][/ROW]
[ROW][C][98,100[[/C][C]99[/C][C]15[/C][C]0.069444[/C][C]0.518519[/C][C]0.034722[/C][/ROW]
[ROW][C][100,102[[/C][C]101[/C][C]12[/C][C]0.055556[/C][C]0.574074[/C][C]0.027778[/C][/ROW]
[ROW][C][102,104[[/C][C]103[/C][C]17[/C][C]0.078704[/C][C]0.652778[/C][C]0.039352[/C][/ROW]
[ROW][C][104,106[[/C][C]105[/C][C]9[/C][C]0.041667[/C][C]0.694444[/C][C]0.020833[/C][/ROW]
[ROW][C][106,108[[/C][C]107[/C][C]12[/C][C]0.055556[/C][C]0.75[/C][C]0.027778[/C][/ROW]
[ROW][C][108,110[[/C][C]109[/C][C]17[/C][C]0.078704[/C][C]0.828704[/C][C]0.039352[/C][/ROW]
[ROW][C][110,112[[/C][C]111[/C][C]9[/C][C]0.041667[/C][C]0.87037[/C][C]0.020833[/C][/ROW]
[ROW][C][112,114[[/C][C]113[/C][C]7[/C][C]0.032407[/C][C]0.902778[/C][C]0.016204[/C][/ROW]
[ROW][C][114,116[[/C][C]115[/C][C]8[/C][C]0.037037[/C][C]0.939815[/C][C]0.018519[/C][/ROW]
[ROW][C][116,118[[/C][C]117[/C][C]2[/C][C]0.009259[/C][C]0.949074[/C][C]0.00463[/C][/ROW]
[ROW][C][118,120[[/C][C]119[/C][C]3[/C][C]0.013889[/C][C]0.962963[/C][C]0.006944[/C][/ROW]
[ROW][C][120,122[[/C][C]121[/C][C]2[/C][C]0.009259[/C][C]0.972222[/C][C]0.00463[/C][/ROW]
[ROW][C][122,124[[/C][C]123[/C][C]3[/C][C]0.013889[/C][C]0.986111[/C][C]0.006944[/C][/ROW]
[ROW][C][124,126[[/C][C]125[/C][C]0[/C][C]0[/C][C]0.986111[/C][C]0[/C][/ROW]
[ROW][C][126,128[[/C][C]127[/C][C]2[/C][C]0.009259[/C][C]0.99537[/C][C]0.00463[/C][/ROW]
[ROW][C][128,130][/C][C]129[/C][C]1[/C][C]0.00463[/C][C]1[/C][C]0.002315[/C][/ROW]
[/TABLE]
Source: https://freestatistics.org/blog/index.php?pk=233482&T=1
Globally Unique Identifier (entire table): ba.freestatistics.org/blog/index.php?pk=233482&T=1
As an alternative you can also use a QR Code:
The GUIDs for individual cells are displayed in the table below:
| Frequency Table (Histogram) | | Bins | Midpoint | Abs. Frequency | Rel. Frequency | Cumul. Rel. Freq. | Density | | [70,72[ | 71 | 2 | 0.009259 | 0.009259 | 0.00463 | | [72,74[ | 73 | 1 | 0.00463 | 0.013889 | 0.002315 | | [74,76[ | 75 | 6 | 0.027778 | 0.041667 | 0.013889 | | [76,78[ | 77 | 6 | 0.027778 | 0.069444 | 0.013889 | | [78,80[ | 79 | 9 | 0.041667 | 0.111111 | 0.020833 | | [80,82[ | 81 | 16 | 0.074074 | 0.185185 | 0.037037 | | [82,84[ | 83 | 5 | 0.023148 | 0.208333 | 0.011574 | | [84,86[ | 85 | 12 | 0.055556 | 0.263889 | 0.027778 | | [86,88[ | 87 | 4 | 0.018519 | 0.282407 | 0.009259 | | [88,90[ | 89 | 4 | 0.018519 | 0.300926 | 0.009259 | | [90,92[ | 91 | 4 | 0.018519 | 0.319444 | 0.009259 | | [92,94[ | 93 | 6 | 0.027778 | 0.347222 | 0.013889 | | [94,96[ | 95 | 9 | 0.041667 | 0.388889 | 0.020833 | | [96,98[ | 97 | 13 | 0.060185 | 0.449074 | 0.030093 | | [98,100[ | 99 | 15 | 0.069444 | 0.518519 | 0.034722 | | [100,102[ | 101 | 12 | 0.055556 | 0.574074 | 0.027778 | | [102,104[ | 103 | 17 | 0.078704 | 0.652778 | 0.039352 | | [104,106[ | 105 | 9 | 0.041667 | 0.694444 | 0.020833 | | [106,108[ | 107 | 12 | 0.055556 | 0.75 | 0.027778 | | [108,110[ | 109 | 17 | 0.078704 | 0.828704 | 0.039352 | | [110,112[ | 111 | 9 | 0.041667 | 0.87037 | 0.020833 | | [112,114[ | 113 | 7 | 0.032407 | 0.902778 | 0.016204 | | [114,116[ | 115 | 8 | 0.037037 | 0.939815 | 0.018519 | | [116,118[ | 117 | 2 | 0.009259 | 0.949074 | 0.00463 | | [118,120[ | 119 | 3 | 0.013889 | 0.962963 | 0.006944 | | [120,122[ | 121 | 2 | 0.009259 | 0.972222 | 0.00463 | | [122,124[ | 123 | 3 | 0.013889 | 0.986111 | 0.006944 | | [124,126[ | 125 | 0 | 0 | 0.986111 | 0 | | [126,128[ | 127 | 2 | 0.009259 | 0.99537 | 0.00463 | | [128,130] | 129 | 1 | 0.00463 | 1 | 0.002315 |
If you paste this QR Code into your document, anyone with a smartphone or tablet will be able to scan it and view this table in a browser.
If you paste this QR Code into your document, anyone with a smartphone or tablet will be able to scan it and view this table in a browser.
If you paste this QR Code into your document, anyone with a smartphone or tablet will be able to scan it and view this table in a browser.
If you paste this QR Code into your document, anyone with a smartphone or tablet will be able to scan it and view this table in a browser.
If you paste this QR Code into your document, anyone with a smartphone or tablet will be able to scan it and view this table in a browser.
|