Free Statistics

of Irreproducible Research!

Author's title

Author*Unverified author*
R Software Modulerwasp_autocorrelation.wasp
Title produced by software(Partial) Autocorrelation Function
Date of computationSun, 17 Aug 2014 19:59:18 +0100
Cite this page as followsStatistical Computations at FreeStatistics.org, Office for Research Development and Education, URL https://freestatistics.org/blog/index.php?v=date/2014/Aug/17/t1408301994fmvyow2pxobfaob.htm/, Retrieved Thu, 31 Oct 2024 23:37:47 +0000
Statistical Computations at FreeStatistics.org, Office for Research Development and Education, URL https://freestatistics.org/blog/index.php?pk=235633, Retrieved Thu, 31 Oct 2024 23:37:47 +0000
QR Codes:

Original text written by user:
IsPrivate?No (this computation is public)
User-defined keywordsVan Reusel Raphaël
Estimated Impact129
Family? (F = Feedback message, R = changed R code, M = changed R Module, P = changed Parameters, D = changed Data)
-     [Harrell-Davis Quantiles] [Tijdreeks 1] [2014-08-17 17:04:09] [01050b0485b0192e33ca8050be87927f]
- RMP     [(Partial) Autocorrelation Function] [Tijdreeks 1] [2014-08-17 18:59:18] [bf566d88435d8cc6ce5d208f6f8dd684] [Current]
Feedback Forum

Post a new message
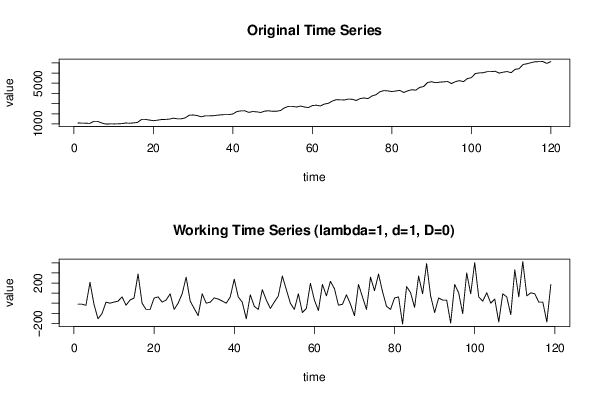
Dataseries X:
1095
1085
1075
1054
1261
1250
1095
992
1002
1002
1013
1033
1095
1075
1106
1157
1447
1447
1385
1323
1374
1436
1447
1478
1571
1509
1509
1602
1860
1881
1829
1705
1798
1798
1808
1860
1901
1922
1922
1984
2222
2284
2294
2139
2222
2191
2129
2263
2294
2242
2253
2325
2594
2728
2728
2666
2759
2666
2614
2811
2842
2769
2955
3028
3245
3389
3369
3358
3441
3431
3307
3493
3555
3493
3751
3875
4164
4278
4247
4185
4237
4299
4092
4257
4361
4319
4588
4681
5074
5146
5053
5105
5136
5167
4970
5156
5259
5156
5456
5549
5952
6014
6034
6138
6138
6179
5993
6086
6148
6034
6365
6427
6840
6913
7016
7109
7119
7130
6944
7130


Summary of computational transaction
Raw Inputview raw input (R code)
Raw Outputview raw output of R engine
Computing time1 seconds
R Server'Herman Ole Andreas Wold' @ wold.wessa.net

\begin{tabular}{lllllllll}
\hline
Summary of computational transaction \tabularnewline
Raw Input & view raw input (R code)  \tabularnewline
Raw Output & view raw output of R engine  \tabularnewline
Computing time & 1 seconds \tabularnewline
R Server & 'Herman Ole Andreas Wold' @ wold.wessa.net \tabularnewline
\hline
\end{tabular}
%Source: https://freestatistics.org/blog/index.php?pk=235633&T=0

[TABLE]
[ROW][C]Summary of computational transaction[/C][/ROW]
[ROW][C]Raw Input[/C][C]view raw input (R code) [/C][/ROW]
[ROW][C]Raw Output[/C][C]view raw output of R engine [/C][/ROW]
[ROW][C]Computing time[/C][C]1 seconds[/C][/ROW]
[ROW][C]R Server[/C][C]'Herman Ole Andreas Wold' @ wold.wessa.net[/C][/ROW]
[/TABLE]
Source: https://freestatistics.org/blog/index.php?pk=235633&T=0

Globally Unique Identifier (entire table): ba.freestatistics.org/blog/index.php?pk=235633&T=0

As an alternative you can also use a QR Code:  

The GUIDs for individual cells are displayed in the table below:

Summary of computational transaction
Raw Inputview raw input (R code)
Raw Outputview raw output of R engine
Computing time1 seconds
R Server'Herman Ole Andreas Wold' @ wold.wessa.net


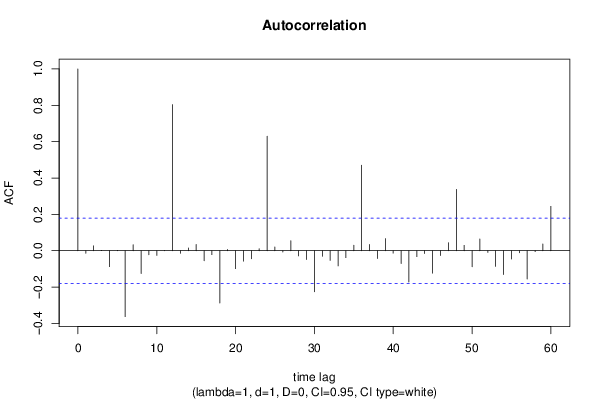
Autocorrelation Function
Time lag kACF(k)T-STATP-value
1-0.014589-0.15910.436911
20.0264330.28830.386792
30.001090.01190.495268
4-0.08756-0.95520.170714
50.0018220.01990.492086
6-0.362919-3.9596.4e-05
70.0331960.36210.358952
8-0.126036-1.37490.085874
9-0.022528-0.24580.403148
10-0.025962-0.28320.388753
110.0012790.01390.494448
120.8037428.76780
13-0.013886-0.15150.439925
140.0145940.15920.436891
150.0341870.37290.354931
16-0.055737-0.6080.272166
17-0.021593-0.23550.407094
18-0.288251-3.14450.001051
190.0067130.07320.470875
20-0.098684-1.07650.141938
21-0.057471-0.62690.26595
22-0.044182-0.4820.315357
230.0108780.11870.452872
240.6293896.86580
250.019970.21780.41396
26-0.007005-0.07640.46961
270.0545380.59490.276506
28-0.028722-0.31330.377291
29-0.048277-0.52660.299711
30-0.225805-2.46320.0076
31-0.030183-0.32930.371271
32-0.053373-0.58220.280756
33-0.08366-0.91260.181643
34-0.038206-0.41680.338795
350.0304250.33190.370275
360.4700025.12711e-06
370.0338830.36960.356163
38-0.04328-0.47210.318852
390.0664480.72490.234981
40-0.01336-0.14570.442189
41-0.070206-0.76590.22264
42-0.172512-1.88190.031147
43-0.032886-0.35870.36021
44-0.015116-0.16490.434653
45-0.123376-1.34590.090451
46-0.026316-0.28710.387276
470.0441030.48110.315661
480.3372653.67910.000176
490.0292640.31920.375054
50-0.088817-0.96890.167286
510.0641410.69970.242743
52-0.009414-0.10270.459188
53-0.086306-0.94150.174181
54-0.130681-1.42560.078307
55-0.04584-0.50010.308979
56-0.011303-0.12330.451038
57-0.155532-1.69670.046188
58-0.005022-0.05480.478203
590.0372070.40590.342779
600.2439752.66150.004428

\begin{tabular}{lllllllll}
\hline
Autocorrelation Function \tabularnewline
Time lag k & ACF(k) & T-STAT & P-value \tabularnewline
1 & -0.014589 & -0.1591 & 0.436911 \tabularnewline
2 & 0.026433 & 0.2883 & 0.386792 \tabularnewline
3 & 0.00109 & 0.0119 & 0.495268 \tabularnewline
4 & -0.08756 & -0.9552 & 0.170714 \tabularnewline
5 & 0.001822 & 0.0199 & 0.492086 \tabularnewline
6 & -0.362919 & -3.959 & 6.4e-05 \tabularnewline
7 & 0.033196 & 0.3621 & 0.358952 \tabularnewline
8 & -0.126036 & -1.3749 & 0.085874 \tabularnewline
9 & -0.022528 & -0.2458 & 0.403148 \tabularnewline
10 & -0.025962 & -0.2832 & 0.388753 \tabularnewline
11 & 0.001279 & 0.0139 & 0.494448 \tabularnewline
12 & 0.803742 & 8.7678 & 0 \tabularnewline
13 & -0.013886 & -0.1515 & 0.439925 \tabularnewline
14 & 0.014594 & 0.1592 & 0.436891 \tabularnewline
15 & 0.034187 & 0.3729 & 0.354931 \tabularnewline
16 & -0.055737 & -0.608 & 0.272166 \tabularnewline
17 & -0.021593 & -0.2355 & 0.407094 \tabularnewline
18 & -0.288251 & -3.1445 & 0.001051 \tabularnewline
19 & 0.006713 & 0.0732 & 0.470875 \tabularnewline
20 & -0.098684 & -1.0765 & 0.141938 \tabularnewline
21 & -0.057471 & -0.6269 & 0.26595 \tabularnewline
22 & -0.044182 & -0.482 & 0.315357 \tabularnewline
23 & 0.010878 & 0.1187 & 0.452872 \tabularnewline
24 & 0.629389 & 6.8658 & 0 \tabularnewline
25 & 0.01997 & 0.2178 & 0.41396 \tabularnewline
26 & -0.007005 & -0.0764 & 0.46961 \tabularnewline
27 & 0.054538 & 0.5949 & 0.276506 \tabularnewline
28 & -0.028722 & -0.3133 & 0.377291 \tabularnewline
29 & -0.048277 & -0.5266 & 0.299711 \tabularnewline
30 & -0.225805 & -2.4632 & 0.0076 \tabularnewline
31 & -0.030183 & -0.3293 & 0.371271 \tabularnewline
32 & -0.053373 & -0.5822 & 0.280756 \tabularnewline
33 & -0.08366 & -0.9126 & 0.181643 \tabularnewline
34 & -0.038206 & -0.4168 & 0.338795 \tabularnewline
35 & 0.030425 & 0.3319 & 0.370275 \tabularnewline
36 & 0.470002 & 5.1271 & 1e-06 \tabularnewline
37 & 0.033883 & 0.3696 & 0.356163 \tabularnewline
38 & -0.04328 & -0.4721 & 0.318852 \tabularnewline
39 & 0.066448 & 0.7249 & 0.234981 \tabularnewline
40 & -0.01336 & -0.1457 & 0.442189 \tabularnewline
41 & -0.070206 & -0.7659 & 0.22264 \tabularnewline
42 & -0.172512 & -1.8819 & 0.031147 \tabularnewline
43 & -0.032886 & -0.3587 & 0.36021 \tabularnewline
44 & -0.015116 & -0.1649 & 0.434653 \tabularnewline
45 & -0.123376 & -1.3459 & 0.090451 \tabularnewline
46 & -0.026316 & -0.2871 & 0.387276 \tabularnewline
47 & 0.044103 & 0.4811 & 0.315661 \tabularnewline
48 & 0.337265 & 3.6791 & 0.000176 \tabularnewline
49 & 0.029264 & 0.3192 & 0.375054 \tabularnewline
50 & -0.088817 & -0.9689 & 0.167286 \tabularnewline
51 & 0.064141 & 0.6997 & 0.242743 \tabularnewline
52 & -0.009414 & -0.1027 & 0.459188 \tabularnewline
53 & -0.086306 & -0.9415 & 0.174181 \tabularnewline
54 & -0.130681 & -1.4256 & 0.078307 \tabularnewline
55 & -0.04584 & -0.5001 & 0.308979 \tabularnewline
56 & -0.011303 & -0.1233 & 0.451038 \tabularnewline
57 & -0.155532 & -1.6967 & 0.046188 \tabularnewline
58 & -0.005022 & -0.0548 & 0.478203 \tabularnewline
59 & 0.037207 & 0.4059 & 0.342779 \tabularnewline
60 & 0.243975 & 2.6615 & 0.004428 \tabularnewline
\hline
\end{tabular}
%Source: https://freestatistics.org/blog/index.php?pk=235633&T=1

[TABLE]
[ROW][C]Autocorrelation Function[/C][/ROW]
[ROW][C]Time lag k[/C][C]ACF(k)[/C][C]T-STAT[/C][C]P-value[/C][/ROW]
[ROW][C]1[/C][C]-0.014589[/C][C]-0.1591[/C][C]0.436911[/C][/ROW]
[ROW][C]2[/C][C]0.026433[/C][C]0.2883[/C][C]0.386792[/C][/ROW]
[ROW][C]3[/C][C]0.00109[/C][C]0.0119[/C][C]0.495268[/C][/ROW]
[ROW][C]4[/C][C]-0.08756[/C][C]-0.9552[/C][C]0.170714[/C][/ROW]
[ROW][C]5[/C][C]0.001822[/C][C]0.0199[/C][C]0.492086[/C][/ROW]
[ROW][C]6[/C][C]-0.362919[/C][C]-3.959[/C][C]6.4e-05[/C][/ROW]
[ROW][C]7[/C][C]0.033196[/C][C]0.3621[/C][C]0.358952[/C][/ROW]
[ROW][C]8[/C][C]-0.126036[/C][C]-1.3749[/C][C]0.085874[/C][/ROW]
[ROW][C]9[/C][C]-0.022528[/C][C]-0.2458[/C][C]0.403148[/C][/ROW]
[ROW][C]10[/C][C]-0.025962[/C][C]-0.2832[/C][C]0.388753[/C][/ROW]
[ROW][C]11[/C][C]0.001279[/C][C]0.0139[/C][C]0.494448[/C][/ROW]
[ROW][C]12[/C][C]0.803742[/C][C]8.7678[/C][C]0[/C][/ROW]
[ROW][C]13[/C][C]-0.013886[/C][C]-0.1515[/C][C]0.439925[/C][/ROW]
[ROW][C]14[/C][C]0.014594[/C][C]0.1592[/C][C]0.436891[/C][/ROW]
[ROW][C]15[/C][C]0.034187[/C][C]0.3729[/C][C]0.354931[/C][/ROW]
[ROW][C]16[/C][C]-0.055737[/C][C]-0.608[/C][C]0.272166[/C][/ROW]
[ROW][C]17[/C][C]-0.021593[/C][C]-0.2355[/C][C]0.407094[/C][/ROW]
[ROW][C]18[/C][C]-0.288251[/C][C]-3.1445[/C][C]0.001051[/C][/ROW]
[ROW][C]19[/C][C]0.006713[/C][C]0.0732[/C][C]0.470875[/C][/ROW]
[ROW][C]20[/C][C]-0.098684[/C][C]-1.0765[/C][C]0.141938[/C][/ROW]
[ROW][C]21[/C][C]-0.057471[/C][C]-0.6269[/C][C]0.26595[/C][/ROW]
[ROW][C]22[/C][C]-0.044182[/C][C]-0.482[/C][C]0.315357[/C][/ROW]
[ROW][C]23[/C][C]0.010878[/C][C]0.1187[/C][C]0.452872[/C][/ROW]
[ROW][C]24[/C][C]0.629389[/C][C]6.8658[/C][C]0[/C][/ROW]
[ROW][C]25[/C][C]0.01997[/C][C]0.2178[/C][C]0.41396[/C][/ROW]
[ROW][C]26[/C][C]-0.007005[/C][C]-0.0764[/C][C]0.46961[/C][/ROW]
[ROW][C]27[/C][C]0.054538[/C][C]0.5949[/C][C]0.276506[/C][/ROW]
[ROW][C]28[/C][C]-0.028722[/C][C]-0.3133[/C][C]0.377291[/C][/ROW]
[ROW][C]29[/C][C]-0.048277[/C][C]-0.5266[/C][C]0.299711[/C][/ROW]
[ROW][C]30[/C][C]-0.225805[/C][C]-2.4632[/C][C]0.0076[/C][/ROW]
[ROW][C]31[/C][C]-0.030183[/C][C]-0.3293[/C][C]0.371271[/C][/ROW]
[ROW][C]32[/C][C]-0.053373[/C][C]-0.5822[/C][C]0.280756[/C][/ROW]
[ROW][C]33[/C][C]-0.08366[/C][C]-0.9126[/C][C]0.181643[/C][/ROW]
[ROW][C]34[/C][C]-0.038206[/C][C]-0.4168[/C][C]0.338795[/C][/ROW]
[ROW][C]35[/C][C]0.030425[/C][C]0.3319[/C][C]0.370275[/C][/ROW]
[ROW][C]36[/C][C]0.470002[/C][C]5.1271[/C][C]1e-06[/C][/ROW]
[ROW][C]37[/C][C]0.033883[/C][C]0.3696[/C][C]0.356163[/C][/ROW]
[ROW][C]38[/C][C]-0.04328[/C][C]-0.4721[/C][C]0.318852[/C][/ROW]
[ROW][C]39[/C][C]0.066448[/C][C]0.7249[/C][C]0.234981[/C][/ROW]
[ROW][C]40[/C][C]-0.01336[/C][C]-0.1457[/C][C]0.442189[/C][/ROW]
[ROW][C]41[/C][C]-0.070206[/C][C]-0.7659[/C][C]0.22264[/C][/ROW]
[ROW][C]42[/C][C]-0.172512[/C][C]-1.8819[/C][C]0.031147[/C][/ROW]
[ROW][C]43[/C][C]-0.032886[/C][C]-0.3587[/C][C]0.36021[/C][/ROW]
[ROW][C]44[/C][C]-0.015116[/C][C]-0.1649[/C][C]0.434653[/C][/ROW]
[ROW][C]45[/C][C]-0.123376[/C][C]-1.3459[/C][C]0.090451[/C][/ROW]
[ROW][C]46[/C][C]-0.026316[/C][C]-0.2871[/C][C]0.387276[/C][/ROW]
[ROW][C]47[/C][C]0.044103[/C][C]0.4811[/C][C]0.315661[/C][/ROW]
[ROW][C]48[/C][C]0.337265[/C][C]3.6791[/C][C]0.000176[/C][/ROW]
[ROW][C]49[/C][C]0.029264[/C][C]0.3192[/C][C]0.375054[/C][/ROW]
[ROW][C]50[/C][C]-0.088817[/C][C]-0.9689[/C][C]0.167286[/C][/ROW]
[ROW][C]51[/C][C]0.064141[/C][C]0.6997[/C][C]0.242743[/C][/ROW]
[ROW][C]52[/C][C]-0.009414[/C][C]-0.1027[/C][C]0.459188[/C][/ROW]
[ROW][C]53[/C][C]-0.086306[/C][C]-0.9415[/C][C]0.174181[/C][/ROW]
[ROW][C]54[/C][C]-0.130681[/C][C]-1.4256[/C][C]0.078307[/C][/ROW]
[ROW][C]55[/C][C]-0.04584[/C][C]-0.5001[/C][C]0.308979[/C][/ROW]
[ROW][C]56[/C][C]-0.011303[/C][C]-0.1233[/C][C]0.451038[/C][/ROW]
[ROW][C]57[/C][C]-0.155532[/C][C]-1.6967[/C][C]0.046188[/C][/ROW]
[ROW][C]58[/C][C]-0.005022[/C][C]-0.0548[/C][C]0.478203[/C][/ROW]
[ROW][C]59[/C][C]0.037207[/C][C]0.4059[/C][C]0.342779[/C][/ROW]
[ROW][C]60[/C][C]0.243975[/C][C]2.6615[/C][C]0.004428[/C][/ROW]
[/TABLE]
Source: https://freestatistics.org/blog/index.php?pk=235633&T=1

Globally Unique Identifier (entire table): ba.freestatistics.org/blog/index.php?pk=235633&T=1

As an alternative you can also use a QR Code:  

The GUIDs for individual cells are displayed in the table below:

Autocorrelation Function
Time lag kACF(k)T-STATP-value
1-0.014589-0.15910.436911
20.0264330.28830.386792
30.001090.01190.495268
4-0.08756-0.95520.170714
50.0018220.01990.492086
6-0.362919-3.9596.4e-05
70.0331960.36210.358952
8-0.126036-1.37490.085874
9-0.022528-0.24580.403148
10-0.025962-0.28320.388753
110.0012790.01390.494448
120.8037428.76780
13-0.013886-0.15150.439925
140.0145940.15920.436891
150.0341870.37290.354931
16-0.055737-0.6080.272166
17-0.021593-0.23550.407094
18-0.288251-3.14450.001051
190.0067130.07320.470875
20-0.098684-1.07650.141938
21-0.057471-0.62690.26595
22-0.044182-0.4820.315357
230.0108780.11870.452872
240.6293896.86580
250.019970.21780.41396
26-0.007005-0.07640.46961
270.0545380.59490.276506
28-0.028722-0.31330.377291
29-0.048277-0.52660.299711
30-0.225805-2.46320.0076
31-0.030183-0.32930.371271
32-0.053373-0.58220.280756
33-0.08366-0.91260.181643
34-0.038206-0.41680.338795
350.0304250.33190.370275
360.4700025.12711e-06
370.0338830.36960.356163
38-0.04328-0.47210.318852
390.0664480.72490.234981
40-0.01336-0.14570.442189
41-0.070206-0.76590.22264
42-0.172512-1.88190.031147
43-0.032886-0.35870.36021
44-0.015116-0.16490.434653
45-0.123376-1.34590.090451
46-0.026316-0.28710.387276
470.0441030.48110.315661
480.3372653.67910.000176
490.0292640.31920.375054
50-0.088817-0.96890.167286
510.0641410.69970.242743
52-0.009414-0.10270.459188
53-0.086306-0.94150.174181
54-0.130681-1.42560.078307
55-0.04584-0.50010.308979
56-0.011303-0.12330.451038
57-0.155532-1.69670.046188
58-0.005022-0.05480.478203
590.0372070.40590.342779
600.2439752.66150.004428


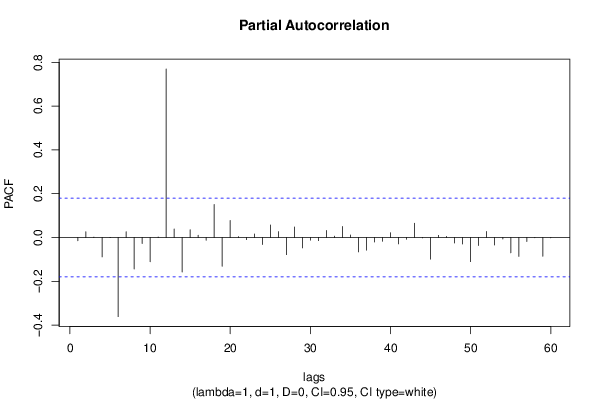
Partial Autocorrelation Function
Time lag kPACF(k)T-STATP-value
1-0.014589-0.15910.436911
20.0262250.28610.387655
30.001850.02020.491968
4-0.088291-0.96310.168714
5-0.000753-0.00820.49673
6-0.361209-3.94036.9e-05
70.0266920.29120.385711
8-0.143877-1.56950.059591
9-0.026985-0.29440.384495
10-0.110731-1.20790.114734
110.0024690.02690.48928
120.7697998.39750
130.0391330.42690.335115
14-0.157391-1.71690.044297
150.0360010.39270.347611
160.0104080.11350.454899
17-0.012328-0.13450.446623
180.1506931.64390.051421
19-0.131019-1.42920.077776
200.077770.84840.198967
210.0041850.04560.481833
22-0.009584-0.10450.458457
230.0161740.17640.430123
24-0.031437-0.34290.366126
250.0573350.62540.266437
260.0270460.2950.384238
27-0.07805-0.85140.198121
280.0478890.52240.301178
29-0.047251-0.51540.303599
30-0.011927-0.13010.448351
31-0.014199-0.15490.438584
320.0325590.35520.361541
330.0063550.06930.472426
340.050140.5470.292716
350.0117960.12870.448916
36-0.065659-0.71630.237619
37-0.057494-0.62720.265869
38-0.020439-0.2230.411971
39-0.01708-0.18630.426256
400.0218680.23850.405934
41-0.029119-0.31770.375653
42-0.007458-0.08140.467648
430.0654830.71430.23821
44-0.001578-0.01720.493146
45-0.098592-1.07550.142162
460.0101250.11040.456119
470.0052350.05710.477276
48-0.02491-0.27170.393147
49-0.029872-0.32590.372551
50-0.110039-1.20040.116188
51-0.036567-0.39890.345341
520.0279630.3050.380433
53-0.033949-0.37030.355893
54-0.006466-0.07050.471943
55-0.069894-0.76250.223647
56-0.086084-0.93910.174801
57-0.018061-0.1970.422073
58-0.001077-0.01180.495322
59-0.085227-0.92970.177201
60-0.001383-0.01510.493993

\begin{tabular}{lllllllll}
\hline
Partial Autocorrelation Function \tabularnewline
Time lag k & PACF(k) & T-STAT & P-value \tabularnewline
1 & -0.014589 & -0.1591 & 0.436911 \tabularnewline
2 & 0.026225 & 0.2861 & 0.387655 \tabularnewline
3 & 0.00185 & 0.0202 & 0.491968 \tabularnewline
4 & -0.088291 & -0.9631 & 0.168714 \tabularnewline
5 & -0.000753 & -0.0082 & 0.49673 \tabularnewline
6 & -0.361209 & -3.9403 & 6.9e-05 \tabularnewline
7 & 0.026692 & 0.2912 & 0.385711 \tabularnewline
8 & -0.143877 & -1.5695 & 0.059591 \tabularnewline
9 & -0.026985 & -0.2944 & 0.384495 \tabularnewline
10 & -0.110731 & -1.2079 & 0.114734 \tabularnewline
11 & 0.002469 & 0.0269 & 0.48928 \tabularnewline
12 & 0.769799 & 8.3975 & 0 \tabularnewline
13 & 0.039133 & 0.4269 & 0.335115 \tabularnewline
14 & -0.157391 & -1.7169 & 0.044297 \tabularnewline
15 & 0.036001 & 0.3927 & 0.347611 \tabularnewline
16 & 0.010408 & 0.1135 & 0.454899 \tabularnewline
17 & -0.012328 & -0.1345 & 0.446623 \tabularnewline
18 & 0.150693 & 1.6439 & 0.051421 \tabularnewline
19 & -0.131019 & -1.4292 & 0.077776 \tabularnewline
20 & 0.07777 & 0.8484 & 0.198967 \tabularnewline
21 & 0.004185 & 0.0456 & 0.481833 \tabularnewline
22 & -0.009584 & -0.1045 & 0.458457 \tabularnewline
23 & 0.016174 & 0.1764 & 0.430123 \tabularnewline
24 & -0.031437 & -0.3429 & 0.366126 \tabularnewline
25 & 0.057335 & 0.6254 & 0.266437 \tabularnewline
26 & 0.027046 & 0.295 & 0.384238 \tabularnewline
27 & -0.07805 & -0.8514 & 0.198121 \tabularnewline
28 & 0.047889 & 0.5224 & 0.301178 \tabularnewline
29 & -0.047251 & -0.5154 & 0.303599 \tabularnewline
30 & -0.011927 & -0.1301 & 0.448351 \tabularnewline
31 & -0.014199 & -0.1549 & 0.438584 \tabularnewline
32 & 0.032559 & 0.3552 & 0.361541 \tabularnewline
33 & 0.006355 & 0.0693 & 0.472426 \tabularnewline
34 & 0.05014 & 0.547 & 0.292716 \tabularnewline
35 & 0.011796 & 0.1287 & 0.448916 \tabularnewline
36 & -0.065659 & -0.7163 & 0.237619 \tabularnewline
37 & -0.057494 & -0.6272 & 0.265869 \tabularnewline
38 & -0.020439 & -0.223 & 0.411971 \tabularnewline
39 & -0.01708 & -0.1863 & 0.426256 \tabularnewline
40 & 0.021868 & 0.2385 & 0.405934 \tabularnewline
41 & -0.029119 & -0.3177 & 0.375653 \tabularnewline
42 & -0.007458 & -0.0814 & 0.467648 \tabularnewline
43 & 0.065483 & 0.7143 & 0.23821 \tabularnewline
44 & -0.001578 & -0.0172 & 0.493146 \tabularnewline
45 & -0.098592 & -1.0755 & 0.142162 \tabularnewline
46 & 0.010125 & 0.1104 & 0.456119 \tabularnewline
47 & 0.005235 & 0.0571 & 0.477276 \tabularnewline
48 & -0.02491 & -0.2717 & 0.393147 \tabularnewline
49 & -0.029872 & -0.3259 & 0.372551 \tabularnewline
50 & -0.110039 & -1.2004 & 0.116188 \tabularnewline
51 & -0.036567 & -0.3989 & 0.345341 \tabularnewline
52 & 0.027963 & 0.305 & 0.380433 \tabularnewline
53 & -0.033949 & -0.3703 & 0.355893 \tabularnewline
54 & -0.006466 & -0.0705 & 0.471943 \tabularnewline
55 & -0.069894 & -0.7625 & 0.223647 \tabularnewline
56 & -0.086084 & -0.9391 & 0.174801 \tabularnewline
57 & -0.018061 & -0.197 & 0.422073 \tabularnewline
58 & -0.001077 & -0.0118 & 0.495322 \tabularnewline
59 & -0.085227 & -0.9297 & 0.177201 \tabularnewline
60 & -0.001383 & -0.0151 & 0.493993 \tabularnewline
\hline
\end{tabular}
%Source: https://freestatistics.org/blog/index.php?pk=235633&T=2

[TABLE]
[ROW][C]Partial Autocorrelation Function[/C][/ROW]
[ROW][C]Time lag k[/C][C]PACF(k)[/C][C]T-STAT[/C][C]P-value[/C][/ROW]
[ROW][C]1[/C][C]-0.014589[/C][C]-0.1591[/C][C]0.436911[/C][/ROW]
[ROW][C]2[/C][C]0.026225[/C][C]0.2861[/C][C]0.387655[/C][/ROW]
[ROW][C]3[/C][C]0.00185[/C][C]0.0202[/C][C]0.491968[/C][/ROW]
[ROW][C]4[/C][C]-0.088291[/C][C]-0.9631[/C][C]0.168714[/C][/ROW]
[ROW][C]5[/C][C]-0.000753[/C][C]-0.0082[/C][C]0.49673[/C][/ROW]
[ROW][C]6[/C][C]-0.361209[/C][C]-3.9403[/C][C]6.9e-05[/C][/ROW]
[ROW][C]7[/C][C]0.026692[/C][C]0.2912[/C][C]0.385711[/C][/ROW]
[ROW][C]8[/C][C]-0.143877[/C][C]-1.5695[/C][C]0.059591[/C][/ROW]
[ROW][C]9[/C][C]-0.026985[/C][C]-0.2944[/C][C]0.384495[/C][/ROW]
[ROW][C]10[/C][C]-0.110731[/C][C]-1.2079[/C][C]0.114734[/C][/ROW]
[ROW][C]11[/C][C]0.002469[/C][C]0.0269[/C][C]0.48928[/C][/ROW]
[ROW][C]12[/C][C]0.769799[/C][C]8.3975[/C][C]0[/C][/ROW]
[ROW][C]13[/C][C]0.039133[/C][C]0.4269[/C][C]0.335115[/C][/ROW]
[ROW][C]14[/C][C]-0.157391[/C][C]-1.7169[/C][C]0.044297[/C][/ROW]
[ROW][C]15[/C][C]0.036001[/C][C]0.3927[/C][C]0.347611[/C][/ROW]
[ROW][C]16[/C][C]0.010408[/C][C]0.1135[/C][C]0.454899[/C][/ROW]
[ROW][C]17[/C][C]-0.012328[/C][C]-0.1345[/C][C]0.446623[/C][/ROW]
[ROW][C]18[/C][C]0.150693[/C][C]1.6439[/C][C]0.051421[/C][/ROW]
[ROW][C]19[/C][C]-0.131019[/C][C]-1.4292[/C][C]0.077776[/C][/ROW]
[ROW][C]20[/C][C]0.07777[/C][C]0.8484[/C][C]0.198967[/C][/ROW]
[ROW][C]21[/C][C]0.004185[/C][C]0.0456[/C][C]0.481833[/C][/ROW]
[ROW][C]22[/C][C]-0.009584[/C][C]-0.1045[/C][C]0.458457[/C][/ROW]
[ROW][C]23[/C][C]0.016174[/C][C]0.1764[/C][C]0.430123[/C][/ROW]
[ROW][C]24[/C][C]-0.031437[/C][C]-0.3429[/C][C]0.366126[/C][/ROW]
[ROW][C]25[/C][C]0.057335[/C][C]0.6254[/C][C]0.266437[/C][/ROW]
[ROW][C]26[/C][C]0.027046[/C][C]0.295[/C][C]0.384238[/C][/ROW]
[ROW][C]27[/C][C]-0.07805[/C][C]-0.8514[/C][C]0.198121[/C][/ROW]
[ROW][C]28[/C][C]0.047889[/C][C]0.5224[/C][C]0.301178[/C][/ROW]
[ROW][C]29[/C][C]-0.047251[/C][C]-0.5154[/C][C]0.303599[/C][/ROW]
[ROW][C]30[/C][C]-0.011927[/C][C]-0.1301[/C][C]0.448351[/C][/ROW]
[ROW][C]31[/C][C]-0.014199[/C][C]-0.1549[/C][C]0.438584[/C][/ROW]
[ROW][C]32[/C][C]0.032559[/C][C]0.3552[/C][C]0.361541[/C][/ROW]
[ROW][C]33[/C][C]0.006355[/C][C]0.0693[/C][C]0.472426[/C][/ROW]
[ROW][C]34[/C][C]0.05014[/C][C]0.547[/C][C]0.292716[/C][/ROW]
[ROW][C]35[/C][C]0.011796[/C][C]0.1287[/C][C]0.448916[/C][/ROW]
[ROW][C]36[/C][C]-0.065659[/C][C]-0.7163[/C][C]0.237619[/C][/ROW]
[ROW][C]37[/C][C]-0.057494[/C][C]-0.6272[/C][C]0.265869[/C][/ROW]
[ROW][C]38[/C][C]-0.020439[/C][C]-0.223[/C][C]0.411971[/C][/ROW]
[ROW][C]39[/C][C]-0.01708[/C][C]-0.1863[/C][C]0.426256[/C][/ROW]
[ROW][C]40[/C][C]0.021868[/C][C]0.2385[/C][C]0.405934[/C][/ROW]
[ROW][C]41[/C][C]-0.029119[/C][C]-0.3177[/C][C]0.375653[/C][/ROW]
[ROW][C]42[/C][C]-0.007458[/C][C]-0.0814[/C][C]0.467648[/C][/ROW]
[ROW][C]43[/C][C]0.065483[/C][C]0.7143[/C][C]0.23821[/C][/ROW]
[ROW][C]44[/C][C]-0.001578[/C][C]-0.0172[/C][C]0.493146[/C][/ROW]
[ROW][C]45[/C][C]-0.098592[/C][C]-1.0755[/C][C]0.142162[/C][/ROW]
[ROW][C]46[/C][C]0.010125[/C][C]0.1104[/C][C]0.456119[/C][/ROW]
[ROW][C]47[/C][C]0.005235[/C][C]0.0571[/C][C]0.477276[/C][/ROW]
[ROW][C]48[/C][C]-0.02491[/C][C]-0.2717[/C][C]0.393147[/C][/ROW]
[ROW][C]49[/C][C]-0.029872[/C][C]-0.3259[/C][C]0.372551[/C][/ROW]
[ROW][C]50[/C][C]-0.110039[/C][C]-1.2004[/C][C]0.116188[/C][/ROW]
[ROW][C]51[/C][C]-0.036567[/C][C]-0.3989[/C][C]0.345341[/C][/ROW]
[ROW][C]52[/C][C]0.027963[/C][C]0.305[/C][C]0.380433[/C][/ROW]
[ROW][C]53[/C][C]-0.033949[/C][C]-0.3703[/C][C]0.355893[/C][/ROW]
[ROW][C]54[/C][C]-0.006466[/C][C]-0.0705[/C][C]0.471943[/C][/ROW]
[ROW][C]55[/C][C]-0.069894[/C][C]-0.7625[/C][C]0.223647[/C][/ROW]
[ROW][C]56[/C][C]-0.086084[/C][C]-0.9391[/C][C]0.174801[/C][/ROW]
[ROW][C]57[/C][C]-0.018061[/C][C]-0.197[/C][C]0.422073[/C][/ROW]
[ROW][C]58[/C][C]-0.001077[/C][C]-0.0118[/C][C]0.495322[/C][/ROW]
[ROW][C]59[/C][C]-0.085227[/C][C]-0.9297[/C][C]0.177201[/C][/ROW]
[ROW][C]60[/C][C]-0.001383[/C][C]-0.0151[/C][C]0.493993[/C][/ROW]
[/TABLE]
Source: https://freestatistics.org/blog/index.php?pk=235633&T=2

Globally Unique Identifier (entire table): ba.freestatistics.org/blog/index.php?pk=235633&T=2

As an alternative you can also use a QR Code:  

The GUIDs for individual cells are displayed in the table below:

Partial Autocorrelation Function
Time lag kPACF(k)T-STATP-value
1-0.014589-0.15910.436911
20.0262250.28610.387655
30.001850.02020.491968
4-0.088291-0.96310.168714
5-0.000753-0.00820.49673
6-0.361209-3.94036.9e-05
70.0266920.29120.385711
8-0.143877-1.56950.059591
9-0.026985-0.29440.384495
10-0.110731-1.20790.114734
110.0024690.02690.48928
120.7697998.39750
130.0391330.42690.335115
14-0.157391-1.71690.044297
150.0360010.39270.347611
160.0104080.11350.454899
17-0.012328-0.13450.446623
180.1506931.64390.051421
19-0.131019-1.42920.077776
200.077770.84840.198967
210.0041850.04560.481833
22-0.009584-0.10450.458457
230.0161740.17640.430123
24-0.031437-0.34290.366126
250.0573350.62540.266437
260.0270460.2950.384238
27-0.07805-0.85140.198121
280.0478890.52240.301178
29-0.047251-0.51540.303599
30-0.011927-0.13010.448351
31-0.014199-0.15490.438584
320.0325590.35520.361541
330.0063550.06930.472426
340.050140.5470.292716
350.0117960.12870.448916
36-0.065659-0.71630.237619
37-0.057494-0.62720.265869
38-0.020439-0.2230.411971
39-0.01708-0.18630.426256
400.0218680.23850.405934
41-0.029119-0.31770.375653
42-0.007458-0.08140.467648
430.0654830.71430.23821
44-0.001578-0.01720.493146
45-0.098592-1.07550.142162
460.0101250.11040.456119
470.0052350.05710.477276
48-0.02491-0.27170.393147
49-0.029872-0.32590.372551
50-0.110039-1.20040.116188
51-0.036567-0.39890.345341
520.0279630.3050.380433
53-0.033949-0.37030.355893
54-0.006466-0.07050.471943
55-0.069894-0.76250.223647
56-0.086084-0.93910.174801
57-0.018061-0.1970.422073
58-0.001077-0.01180.495322
59-0.085227-0.92970.177201
60-0.001383-0.01510.493993


Parameters (Session):
par1 = 48 ; par2 = 1 ; par3 = 0 ; par4 = 0 ; par5 = 12 ; par6 = White Noise ; par7 = 0.95 ;
Parameters (R input):
par1 = 60 ; par2 = 1 ; par3 = 1 ; par4 = 0 ; par5 = 12 ; par6 = White Noise ; par7 = 0.95 ; par8 = ;
R code (references can be found in the software module):
par8 <- ''
par7 <- '0.95'
par6 <- 'White Noise'
par5 <- '12'
par4 <- '0'
par3 <- '0'
par2 <- '1'
par1 <- '60'
if (par1 == 'Default') {
par1 = 10*log10(length(x))
} else {
par1 <- as.numeric(par1)
}
par2 <- as.numeric(par2)
par3 <- as.numeric(par3)
par4 <- as.numeric(par4)
par5 <- as.numeric(par5)
if (par6 == 'White Noise') par6 <- 'white' else par6 <- 'ma'
par7 <- as.numeric(par7)
if (par8 != '') par8 <- as.numeric(par8)
ox <- x
if (par8 == '') {
if (par2 == 0) {
x <- log(x)
} else {
x <- (x ^ par2 - 1) / par2
}
} else {
x <- log(x,base=par8)
}
if (par3 > 0) x <- diff(x,lag=1,difference=par3)
if (par4 > 0) x <- diff(x,lag=par5,difference=par4)
bitmap(file='picts.png')
op <- par(mfrow=c(2,1))
plot(ox,type='l',main='Original Time Series',xlab='time',ylab='value')
if (par8=='') {
mytitle <- paste('Working Time Series (lambda=',par2,', d=',par3,', D=',par4,')',sep='')
mysub <- paste('(lambda=',par2,', d=',par3,', D=',par4,', CI=', par7, ', CI type=',par6,')',sep='')
} else {
mytitle <- paste('Working Time Series (base=',par8,', d=',par3,', D=',par4,')',sep='')
mysub <- paste('(base=',par8,', d=',par3,', D=',par4,', CI=', par7, ', CI type=',par6,')',sep='')
}
plot(x,type='l', main=mytitle,xlab='time',ylab='value')
par(op)
dev.off()
bitmap(file='pic1.png')
racf <- acf(x, par1, main='Autocorrelation', xlab='time lag', ylab='ACF', ci.type=par6, ci=par7, sub=mysub)
dev.off()
bitmap(file='pic2.png')
rpacf <- pacf(x,par1,main='Partial Autocorrelation',xlab='lags',ylab='PACF',sub=mysub)
dev.off()
(myacf <- c(racf$acf))
(mypacf <- c(rpacf$acf))
lengthx <- length(x)
sqrtn <- sqrt(lengthx)
load(file='createtable')
a<-table.start()
a<-table.row.start(a)
a<-table.element(a,'Autocorrelation Function',4,TRUE)
a<-table.row.end(a)
a<-table.row.start(a)
a<-table.element(a,'Time lag k',header=TRUE)
a<-table.element(a,hyperlink('basics.htm','ACF(k)','click here for more information about the Autocorrelation Function'),header=TRUE)
a<-table.element(a,'T-STAT',header=TRUE)
a<-table.element(a,'P-value',header=TRUE)
a<-table.row.end(a)
for (i in 2:(par1+1)) {
a<-table.row.start(a)
a<-table.element(a,i-1,header=TRUE)
a<-table.element(a,round(myacf[i],6))
mytstat <- myacf[i]*sqrtn
a<-table.element(a,round(mytstat,4))
a<-table.element(a,round(1-pt(abs(mytstat),lengthx),6))
a<-table.row.end(a)
}
a<-table.end(a)
table.save(a,file='mytable.tab')
a<-table.start()
a<-table.row.start(a)
a<-table.element(a,'Partial Autocorrelation Function',4,TRUE)
a<-table.row.end(a)
a<-table.row.start(a)
a<-table.element(a,'Time lag k',header=TRUE)
a<-table.element(a,hyperlink('basics.htm','PACF(k)','click here for more information about the Partial Autocorrelation Function'),header=TRUE)
a<-table.element(a,'T-STAT',header=TRUE)
a<-table.element(a,'P-value',header=TRUE)
a<-table.row.end(a)
for (i in 1:par1) {
a<-table.row.start(a)
a<-table.element(a,i,header=TRUE)
a<-table.element(a,round(mypacf[i],6))
mytstat <- mypacf[i]*sqrtn
a<-table.element(a,round(mytstat,4))
a<-table.element(a,round(1-pt(abs(mytstat),lengthx),6))
a<-table.row.end(a)
}
a<-table.end(a)
table.save(a,file='mytable1.tab')