Free Statistics

of Irreproducible Research!

Author's title

Author*The author of this computation has been verified*
R Software Modulerwasp_multipleregression.wasp
Title produced by softwareMultiple Regression
Date of computationFri, 11 Dec 2015 12:18:51 +0000
Cite this page as followsStatistical Computations at FreeStatistics.org, Office for Research Development and Education, URL https://freestatistics.org/blog/index.php?v=date/2015/Dec/11/t1449836592ntd3bdjobzg6d0j.htm/, Retrieved Fri, 01 Nov 2024 00:02:37 +0000
Statistical Computations at FreeStatistics.org, Office for Research Development and Education, URL https://freestatistics.org/blog/index.php?pk=285909, Retrieved Fri, 01 Nov 2024 00:02:37 +0000
QR Codes:

Original text written by user:
IsPrivate?No (this computation is public)
User-defined keywords
Estimated Impact130
Family? (F = Feedback message, R = changed R code, M = changed R Module, P = changed Parameters, D = changed Data)
-       [Multiple Regression] [V_A Computation 4] [2015-12-11 12:18:51] [e73b7cd66085b2a8dc50e64bc3434afa] [Current]
Feedback Forum

Post a new message
Dataseries X:
-5 -6 33 5 15
-1 -3 24 6 17
-2 -4 24 6 13
-5 -7 31 5 12
-4 -7 25 5 13
-6 -7 28 3 10
-2 -3 24 5 14
-2 0 25 5 13
-2 -5 16 5 10
-2 -3 17 3 11
2 3 11 6 12
1 2 12 6 7
-8 -7 39 4 11
-1 -1 19 6 9
1 0 14 5 13
-1 -3 15 4 12
2 4 7 5 5
2 2 12 5 13
1 3 12 4 11
-1 0 14 3 8
-2 -10 9 2 8
-2 -10 8 3 8
-1 -9 4 2 8
-8 -22 7 -1 0
-4 -16 3 0 3
-6 -18 5 -2 0
-3 -14 0 1 -1
-3 -12 -2 -2 -1
-7 -17 6 -2 -4
-9 -23 11 -2 1
-11 -28 9 -6 -1
-13 -31 17 -4 0
-11 -21 21 -2 -1
-9 -19 21 0 6
-17 -22 41 -5 0
-22 -22 57 -4 -3
-25 -25 65 -5 -3
-20 -16 68 -1 4
-24 -22 73 -2 1
-24 -21 71 -4 0
-22 -10 71 -1 -4
-19 -7 70 1 -2
-18 -5 69 1 3
-17 -4 65 -2 2
-11 7 57 1 5
-11 6 57 1 6
-12 3 57 3 6
-10 10 55 3 3
-15 0 65 1 4
-15 -2 65 1 7
-15 -1 64 0 5
-13 2 60 2 6
-8 8 43 2 1
-13 -6 47 -1 3
-9 -4 40 1 6
-7 4 31 0 0
-4 7 27 1 3
-4 3 24 1 4
-2 3 23 3 7
0 8 17 2 6
-2 3 16 0 6
-3 -3 15 0 6
1 4 8 3 6
-2 -5 5 -2 2
-1 -1 6 0 2
1 5 5 1 2
-3 0 12 -1 3
-4 -6 8 -2 -1
-9 -13 17 -1 -4
-9 -15 22 -1 4
-7 -8 24 1 5
-14 -20 36 -2 3
-12 -10 31 -5 -1
-16 -22 34 -5 -4
-20 -25 47 -6 0
-12 -10 33 -4 -1
-12 -8 35 -3 -1
-10 -9 31 -3 3
-10 -5 35 -1 2
-13 -7 39 -2 -4
-16 -11 46 -3 -3
-14 -11 40 -3 -1
-17 -16 50 -3 3
-24 -28 62 -5 -2
-25 -27 57 -5 -10
-23 -23 59 -3 -7
-17 -10 52 -3 -4
-24 -22 63 -3 -7
-20 -15 56 -4 -4
-19 -14 55 -2 -3
-18 -12 54 -4 -1
-16 -10 48 -5 -2
-12 1 39 -4 -7
-7 9 40 1 3
-6 7 38 3 3
-6 9 34 2 1
-5 7 32 3 2
-4 12 32 2 3
-4 10 30 4 1
-8 7 35 0 -3
-9 4 35 -1 -3
-6 5 30 1 -2
-7 5 30 1 -3
-10 -1 40 2 1
-11 -5 32 -1 -6
-11 -6 33 0 -4
-12 -9 31 -3 -4
-14 -15 27 -6 -8
-12 -10 26 -5 -5
-9 -5 24 -3 -4
-5 2 18 -1 -1
-6 -1 21 -3 1
-6 0 24 -1 2
-3 4 17 -1 4
-2 8 15 -1 1
-6 -1 19 -1 -1
-6 -4 13 -6 0
-10 -10 28 -3 -1
-8 -6 21 -3 -1
-4 -2 14 -2 1


Summary of computational transaction
Raw Inputview raw input (R code)
Raw Outputview raw output of R engine
Computing time5 seconds
R Server'George Udny Yule' @ yule.wessa.net

\begin{tabular}{lllllllll}
\hline
Summary of computational transaction \tabularnewline
Raw Input & view raw input (R code)  \tabularnewline
Raw Output & view raw output of R engine  \tabularnewline
Computing time & 5 seconds \tabularnewline
R Server & 'George Udny Yule' @ yule.wessa.net \tabularnewline
\hline
\end{tabular}
%Source: https://freestatistics.org/blog/index.php?pk=285909&T=0

[TABLE]
[ROW][C]Summary of computational transaction[/C][/ROW]
[ROW][C]Raw Input[/C][C]view raw input (R code) [/C][/ROW]
[ROW][C]Raw Output[/C][C]view raw output of R engine [/C][/ROW]
[ROW][C]Computing time[/C][C]5 seconds[/C][/ROW]
[ROW][C]R Server[/C][C]'George Udny Yule' @ yule.wessa.net[/C][/ROW]
[/TABLE]
Source: https://freestatistics.org/blog/index.php?pk=285909&T=0

Globally Unique Identifier (entire table): ba.freestatistics.org/blog/index.php?pk=285909&T=0

As an alternative you can also use a QR Code:  

The GUIDs for individual cells are displayed in the table below:

Summary of computational transaction
Raw Inputview raw input (R code)
Raw Outputview raw output of R engine
Computing time5 seconds
R Server'George Udny Yule' @ yule.wessa.net


Multiple Linear Regression - Estimated Regression Equation
consumentenvertrouwen[t] = -0.0126134 + 0.248929vooruitz_economie[t] -0.252415vooruitz_werkloosh[t] + 0.26335vooruitz_finan[t] + 0.237139vooruitz_sparen[t] + e[t]

\begin{tabular}{lllllllll}
\hline
Multiple Linear Regression - Estimated Regression Equation \tabularnewline
consumentenvertrouwen[t] =  -0.0126134 +  0.248929vooruitz_economie[t] -0.252415vooruitz_werkloosh[t] +  0.26335vooruitz_finan[t] +  0.237139vooruitz_sparen[t]  + e[t] \tabularnewline
 \tabularnewline
\hline
\end{tabular}
%Source: https://freestatistics.org/blog/index.php?pk=285909&T=1

[TABLE]
[ROW][C]Multiple Linear Regression - Estimated Regression Equation[/C][/ROW]
[ROW][C]consumentenvertrouwen[t] =  -0.0126134 +  0.248929vooruitz_economie[t] -0.252415vooruitz_werkloosh[t] +  0.26335vooruitz_finan[t] +  0.237139vooruitz_sparen[t]  + e[t][/C][/ROW]
[ROW][C][/C][/ROW]
[/TABLE]
Source: https://freestatistics.org/blog/index.php?pk=285909&T=1

Globally Unique Identifier (entire table): ba.freestatistics.org/blog/index.php?pk=285909&T=1

As an alternative you can also use a QR Code:  

The GUIDs for individual cells are displayed in the table below:

Multiple Linear Regression - Estimated Regression Equation
consumentenvertrouwen[t] = -0.0126134 + 0.248929vooruitz_economie[t] -0.252415vooruitz_werkloosh[t] + 0.26335vooruitz_finan[t] + 0.237139vooruitz_sparen[t] + e[t]


Multiple Linear Regression - Ordinary Least Squares
VariableParameterS.D.T-STATH0: parameter = 02-tail p-value1-tail p-value
(Intercept)-0.01261 0.06124-2.0600e-01 0.8372 0.4186
vooruitz_economie+0.2489 0.003574+6.9640e+01 7.06e-96 3.53e-96
vooruitz_werkloosh-0.2524 0.001478-1.7080e+02 3.48e-140 1.74e-140
vooruitz_finan+0.2633 0.01737+1.5160e+01 3.4e-29 1.7e-29
vooruitz_sparen+0.2371 0.00872+2.7190e+01 6.555e-52 3.278e-52

\begin{tabular}{lllllllll}
\hline
Multiple Linear Regression - Ordinary Least Squares \tabularnewline
Variable & Parameter & S.D. & T-STATH0: parameter = 0 & 2-tail p-value & 1-tail p-value \tabularnewline
(Intercept) & -0.01261 &  0.06124 & -2.0600e-01 &  0.8372 &  0.4186 \tabularnewline
vooruitz_economie & +0.2489 &  0.003574 & +6.9640e+01 &  7.06e-96 &  3.53e-96 \tabularnewline
vooruitz_werkloosh & -0.2524 &  0.001478 & -1.7080e+02 &  3.48e-140 &  1.74e-140 \tabularnewline
vooruitz_finan & +0.2633 &  0.01737 & +1.5160e+01 &  3.4e-29 &  1.7e-29 \tabularnewline
vooruitz_sparen & +0.2371 &  0.00872 & +2.7190e+01 &  6.555e-52 &  3.278e-52 \tabularnewline
\hline
\end{tabular}
%Source: https://freestatistics.org/blog/index.php?pk=285909&T=2

[TABLE]
[ROW][C]Multiple Linear Regression - Ordinary Least Squares[/C][/ROW]
[ROW][C]Variable[/C][C]Parameter[/C][C]S.D.[/C][C]T-STATH0: parameter = 0[/C][C]2-tail p-value[/C][C]1-tail p-value[/C][/ROW]
[ROW][C](Intercept)[/C][C]-0.01261[/C][C] 0.06124[/C][C]-2.0600e-01[/C][C] 0.8372[/C][C] 0.4186[/C][/ROW]
[ROW][C]vooruitz_economie[/C][C]+0.2489[/C][C] 0.003574[/C][C]+6.9640e+01[/C][C] 7.06e-96[/C][C] 3.53e-96[/C][/ROW]
[ROW][C]vooruitz_werkloosh[/C][C]-0.2524[/C][C] 0.001478[/C][C]-1.7080e+02[/C][C] 3.48e-140[/C][C] 1.74e-140[/C][/ROW]
[ROW][C]vooruitz_finan[/C][C]+0.2633[/C][C] 0.01737[/C][C]+1.5160e+01[/C][C] 3.4e-29[/C][C] 1.7e-29[/C][/ROW]
[ROW][C]vooruitz_sparen[/C][C]+0.2371[/C][C] 0.00872[/C][C]+2.7190e+01[/C][C] 6.555e-52[/C][C] 3.278e-52[/C][/ROW]
[/TABLE]
Source: https://freestatistics.org/blog/index.php?pk=285909&T=2

Globally Unique Identifier (entire table): ba.freestatistics.org/blog/index.php?pk=285909&T=2

As an alternative you can also use a QR Code:  

The GUIDs for individual cells are displayed in the table below:

Multiple Linear Regression - Ordinary Least Squares
VariableParameterS.D.T-STATH0: parameter = 02-tail p-value1-tail p-value
(Intercept)-0.01261 0.06124-2.0600e-01 0.8372 0.4186
vooruitz_economie+0.2489 0.003574+6.9640e+01 7.06e-96 3.53e-96
vooruitz_werkloosh-0.2524 0.001478-1.7080e+02 3.48e-140 1.74e-140
vooruitz_finan+0.2633 0.01737+1.5160e+01 3.4e-29 1.7e-29
vooruitz_sparen+0.2371 0.00872+2.7190e+01 6.555e-52 3.278e-52


Multiple Linear Regression - Regression Statistics
Multiple R 0.9991
R-squared 0.9982
Adjusted R-squared 0.9982
F-TEST (value) 1.618e+04
F-TEST (DF numerator)4
F-TEST (DF denominator)115
p-value 0
Multiple Linear Regression - Residual Statistics
Residual Standard Deviation 0.2998
Sum Squared Residuals 10.34

\begin{tabular}{lllllllll}
\hline
Multiple Linear Regression - Regression Statistics \tabularnewline
Multiple R &  0.9991 \tabularnewline
R-squared &  0.9982 \tabularnewline
Adjusted R-squared &  0.9982 \tabularnewline
F-TEST (value) &  1.618e+04 \tabularnewline
F-TEST (DF numerator) & 4 \tabularnewline
F-TEST (DF denominator) & 115 \tabularnewline
p-value &  0 \tabularnewline
Multiple Linear Regression - Residual Statistics \tabularnewline
Residual Standard Deviation &  0.2998 \tabularnewline
Sum Squared Residuals &  10.34 \tabularnewline
\hline
\end{tabular}
%Source: https://freestatistics.org/blog/index.php?pk=285909&T=3

[TABLE]
[ROW][C]Multiple Linear Regression - Regression Statistics[/C][/ROW]
[ROW][C]Multiple R[/C][C] 0.9991[/C][/ROW]
[ROW][C]R-squared[/C][C] 0.9982[/C][/ROW]
[ROW][C]Adjusted R-squared[/C][C] 0.9982[/C][/ROW]
[ROW][C]F-TEST (value)[/C][C] 1.618e+04[/C][/ROW]
[ROW][C]F-TEST (DF numerator)[/C][C]4[/C][/ROW]
[ROW][C]F-TEST (DF denominator)[/C][C]115[/C][/ROW]
[ROW][C]p-value[/C][C] 0[/C][/ROW]
[ROW][C]Multiple Linear Regression - Residual Statistics[/C][/ROW]
[ROW][C]Residual Standard Deviation[/C][C] 0.2998[/C][/ROW]
[ROW][C]Sum Squared Residuals[/C][C] 10.34[/C][/ROW]
[/TABLE]
Source: https://freestatistics.org/blog/index.php?pk=285909&T=3

Globally Unique Identifier (entire table): ba.freestatistics.org/blog/index.php?pk=285909&T=3

As an alternative you can also use a QR Code:  

The GUIDs for individual cells are displayed in the table below:

Multiple Linear Regression - Regression Statistics
Multiple R 0.9991
R-squared 0.9982
Adjusted R-squared 0.9982
F-TEST (value) 1.618e+04
F-TEST (DF numerator)4
F-TEST (DF denominator)115
p-value 0
Multiple Linear Regression - Residual Statistics
Residual Standard Deviation 0.2998
Sum Squared Residuals 10.34


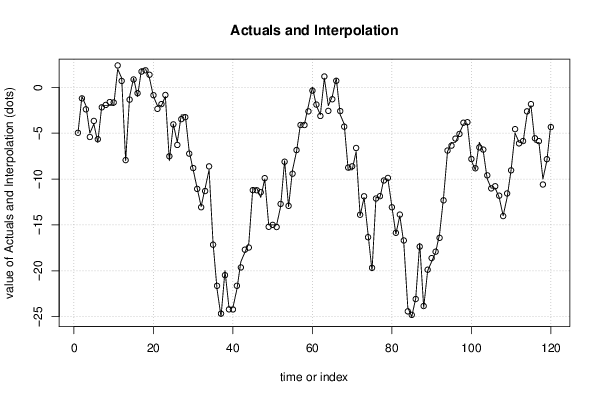
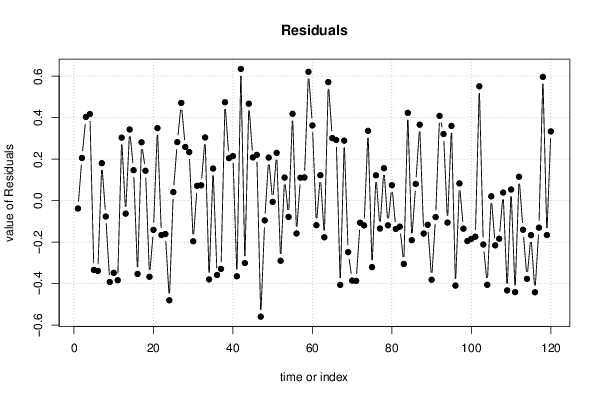
Multiple Linear Regression - Actuals, Interpolation, and Residuals
Time or IndexActualsInterpolationForecastResidualsPrediction Error
1-5-4.962-0.03797
2-1-1.206 0.2059
3-2-2.403 0.4034
4-5-5.418 0.4175
5-4-3.666-0.3341
6-6-5.661-0.3387
7-2-2.181 0.1807
8-2-1.923-0.07658
9-2-1.608-0.3922
10-2-1.652-0.3481
11 2 2.383-0.3834
12 1 0.6963 0.3037
13-8-7.937-0.06265
14-1-1.343 0.3431
15 1 0.8531 0.1469
16-1-0.6465-0.3535
17 2 1.719 0.2814
18 2 1.856 0.1442
19 1 1.367-0.3671
20-1-0.8593-0.1407
21-2-2.35 0.3498
22-2-1.834-0.1659
23-1-0.8388-0.1612
24-8-7.519-0.4807
25-4-4.041 0.04131
26-6-6.282 0.2821
27-3-3.471 0.4714
28-3-3.259 0.2588
29-7-7.234 0.2342
30-9-8.804-0.1959
31-11-11.07 0.0716
32-13-13.07 0.07386
33-11-11.3 0.3047
34-9-8.62-0.3799
35-17-17.15 0.1548
36-22-21.64-0.3585
37-25-24.67-0.329
38-20-20.47 0.4745
39-24-24.2 0.2049
40-24-24.21 0.215
41-22-21.64-0.3648
42-19-19.64 0.6351
43-18-17.7-0.3009
44-17-17.47 0.4677
45-11-11.21 0.2087
46-11-11.22 0.2205
47-12-11.44-0.5594
48-10-9.905-0.09534
49-15-15.21 0.2077
50-15-14.99-0.005906
51-15-15.23 0.2304
52-13-12.71-0.2899
53-8-8.111 0.1112
54-13-12.92-0.0784
55-9-9.419 0.4187
56-7-6.842-0.1583
57-4-4.111 0.1105
58-4-4.112 0.1119
59-2-2.621 0.6213
60 0-0.3627 0.3627
61-2-1.882-0.1184
62-3-3.123 0.1228
63 1 1.177-0.1767
64-2-2.572 0.5718
65-1-1.302 0.3018
66 1 0.7076 0.2924
67-3-2.594-0.4065
68-4-4.289 0.2893
69-9-8.752-0.2484
70-9-8.614-0.3855
71-7-6.613-0.3871
72-14-13.89-0.1066
73-12-11.88-0.1194
74-16-16.34 0.3365
75-20-19.68-0.3206
76-12-12.12 0.1221
77-12-11.87-0.1343
78-10-10.16 0.1565
79-10-9.881-0.1192
80-13-13.07 0.07454
81-16-15.86-0.1366
82-14-13.87-0.1254
83-17-16.69-0.3052
84-24-24.42 0.4234
85-25-24.81-0.1905
86-23-23.08 0.08047
87-17-17.37 0.3661
88-24-23.84-0.1588
89-20-19.88-0.1163
90-19-18.62-0.3815
91-18-17.92-0.07931
92-16-16.41 0.4088
93-12-12.32 0.3212
94-7-6.894-0.1059
95-6-6.36 0.3604
96-6-5.591-0.4095
97-5-5.083 0.08305
98-4-3.865-0.1354
99-4-3.805-0.1948
100-8-7.816-0.184
101-9-8.826-0.1738
102-6-6.551 0.5513
103-7-6.788-0.2115
104-10-9.594-0.4057
105-11-11.02 0.02071
106-11-10.78-0.2156
107-12-11.82-0.1836
108-14-14.04 0.03896
109-12-11.57-0.4329
110-9-9.054 0.05381
111-5-4.559-0.4413
112-6-6.115 0.1152
113-6-5.86-0.1404
114-3-2.623-0.3773
115-2-1.834-0.1664
116-6-5.558-0.4421
117-6-5.87-0.1302
118-10-10.6 0.5967
119-8-7.834-0.1659
120-4-4.334 0.3338

\begin{tabular}{lllllllll}
\hline
Multiple Linear Regression - Actuals, Interpolation, and Residuals \tabularnewline
Time or Index & Actuals & InterpolationForecast & ResidualsPrediction Error \tabularnewline
1 & -5 & -4.962 & -0.03797 \tabularnewline
2 & -1 & -1.206 &  0.2059 \tabularnewline
3 & -2 & -2.403 &  0.4034 \tabularnewline
4 & -5 & -5.418 &  0.4175 \tabularnewline
5 & -4 & -3.666 & -0.3341 \tabularnewline
6 & -6 & -5.661 & -0.3387 \tabularnewline
7 & -2 & -2.181 &  0.1807 \tabularnewline
8 & -2 & -1.923 & -0.07658 \tabularnewline
9 & -2 & -1.608 & -0.3922 \tabularnewline
10 & -2 & -1.652 & -0.3481 \tabularnewline
11 &  2 &  2.383 & -0.3834 \tabularnewline
12 &  1 &  0.6963 &  0.3037 \tabularnewline
13 & -8 & -7.937 & -0.06265 \tabularnewline
14 & -1 & -1.343 &  0.3431 \tabularnewline
15 &  1 &  0.8531 &  0.1469 \tabularnewline
16 & -1 & -0.6465 & -0.3535 \tabularnewline
17 &  2 &  1.719 &  0.2814 \tabularnewline
18 &  2 &  1.856 &  0.1442 \tabularnewline
19 &  1 &  1.367 & -0.3671 \tabularnewline
20 & -1 & -0.8593 & -0.1407 \tabularnewline
21 & -2 & -2.35 &  0.3498 \tabularnewline
22 & -2 & -1.834 & -0.1659 \tabularnewline
23 & -1 & -0.8388 & -0.1612 \tabularnewline
24 & -8 & -7.519 & -0.4807 \tabularnewline
25 & -4 & -4.041 &  0.04131 \tabularnewline
26 & -6 & -6.282 &  0.2821 \tabularnewline
27 & -3 & -3.471 &  0.4714 \tabularnewline
28 & -3 & -3.259 &  0.2588 \tabularnewline
29 & -7 & -7.234 &  0.2342 \tabularnewline
30 & -9 & -8.804 & -0.1959 \tabularnewline
31 & -11 & -11.07 &  0.0716 \tabularnewline
32 & -13 & -13.07 &  0.07386 \tabularnewline
33 & -11 & -11.3 &  0.3047 \tabularnewline
34 & -9 & -8.62 & -0.3799 \tabularnewline
35 & -17 & -17.15 &  0.1548 \tabularnewline
36 & -22 & -21.64 & -0.3585 \tabularnewline
37 & -25 & -24.67 & -0.329 \tabularnewline
38 & -20 & -20.47 &  0.4745 \tabularnewline
39 & -24 & -24.2 &  0.2049 \tabularnewline
40 & -24 & -24.21 &  0.215 \tabularnewline
41 & -22 & -21.64 & -0.3648 \tabularnewline
42 & -19 & -19.64 &  0.6351 \tabularnewline
43 & -18 & -17.7 & -0.3009 \tabularnewline
44 & -17 & -17.47 &  0.4677 \tabularnewline
45 & -11 & -11.21 &  0.2087 \tabularnewline
46 & -11 & -11.22 &  0.2205 \tabularnewline
47 & -12 & -11.44 & -0.5594 \tabularnewline
48 & -10 & -9.905 & -0.09534 \tabularnewline
49 & -15 & -15.21 &  0.2077 \tabularnewline
50 & -15 & -14.99 & -0.005906 \tabularnewline
51 & -15 & -15.23 &  0.2304 \tabularnewline
52 & -13 & -12.71 & -0.2899 \tabularnewline
53 & -8 & -8.111 &  0.1112 \tabularnewline
54 & -13 & -12.92 & -0.0784 \tabularnewline
55 & -9 & -9.419 &  0.4187 \tabularnewline
56 & -7 & -6.842 & -0.1583 \tabularnewline
57 & -4 & -4.111 &  0.1105 \tabularnewline
58 & -4 & -4.112 &  0.1119 \tabularnewline
59 & -2 & -2.621 &  0.6213 \tabularnewline
60 &  0 & -0.3627 &  0.3627 \tabularnewline
61 & -2 & -1.882 & -0.1184 \tabularnewline
62 & -3 & -3.123 &  0.1228 \tabularnewline
63 &  1 &  1.177 & -0.1767 \tabularnewline
64 & -2 & -2.572 &  0.5718 \tabularnewline
65 & -1 & -1.302 &  0.3018 \tabularnewline
66 &  1 &  0.7076 &  0.2924 \tabularnewline
67 & -3 & -2.594 & -0.4065 \tabularnewline
68 & -4 & -4.289 &  0.2893 \tabularnewline
69 & -9 & -8.752 & -0.2484 \tabularnewline
70 & -9 & -8.614 & -0.3855 \tabularnewline
71 & -7 & -6.613 & -0.3871 \tabularnewline
72 & -14 & -13.89 & -0.1066 \tabularnewline
73 & -12 & -11.88 & -0.1194 \tabularnewline
74 & -16 & -16.34 &  0.3365 \tabularnewline
75 & -20 & -19.68 & -0.3206 \tabularnewline
76 & -12 & -12.12 &  0.1221 \tabularnewline
77 & -12 & -11.87 & -0.1343 \tabularnewline
78 & -10 & -10.16 &  0.1565 \tabularnewline
79 & -10 & -9.881 & -0.1192 \tabularnewline
80 & -13 & -13.07 &  0.07454 \tabularnewline
81 & -16 & -15.86 & -0.1366 \tabularnewline
82 & -14 & -13.87 & -0.1254 \tabularnewline
83 & -17 & -16.69 & -0.3052 \tabularnewline
84 & -24 & -24.42 &  0.4234 \tabularnewline
85 & -25 & -24.81 & -0.1905 \tabularnewline
86 & -23 & -23.08 &  0.08047 \tabularnewline
87 & -17 & -17.37 &  0.3661 \tabularnewline
88 & -24 & -23.84 & -0.1588 \tabularnewline
89 & -20 & -19.88 & -0.1163 \tabularnewline
90 & -19 & -18.62 & -0.3815 \tabularnewline
91 & -18 & -17.92 & -0.07931 \tabularnewline
92 & -16 & -16.41 &  0.4088 \tabularnewline
93 & -12 & -12.32 &  0.3212 \tabularnewline
94 & -7 & -6.894 & -0.1059 \tabularnewline
95 & -6 & -6.36 &  0.3604 \tabularnewline
96 & -6 & -5.591 & -0.4095 \tabularnewline
97 & -5 & -5.083 &  0.08305 \tabularnewline
98 & -4 & -3.865 & -0.1354 \tabularnewline
99 & -4 & -3.805 & -0.1948 \tabularnewline
100 & -8 & -7.816 & -0.184 \tabularnewline
101 & -9 & -8.826 & -0.1738 \tabularnewline
102 & -6 & -6.551 &  0.5513 \tabularnewline
103 & -7 & -6.788 & -0.2115 \tabularnewline
104 & -10 & -9.594 & -0.4057 \tabularnewline
105 & -11 & -11.02 &  0.02071 \tabularnewline
106 & -11 & -10.78 & -0.2156 \tabularnewline
107 & -12 & -11.82 & -0.1836 \tabularnewline
108 & -14 & -14.04 &  0.03896 \tabularnewline
109 & -12 & -11.57 & -0.4329 \tabularnewline
110 & -9 & -9.054 &  0.05381 \tabularnewline
111 & -5 & -4.559 & -0.4413 \tabularnewline
112 & -6 & -6.115 &  0.1152 \tabularnewline
113 & -6 & -5.86 & -0.1404 \tabularnewline
114 & -3 & -2.623 & -0.3773 \tabularnewline
115 & -2 & -1.834 & -0.1664 \tabularnewline
116 & -6 & -5.558 & -0.4421 \tabularnewline
117 & -6 & -5.87 & -0.1302 \tabularnewline
118 & -10 & -10.6 &  0.5967 \tabularnewline
119 & -8 & -7.834 & -0.1659 \tabularnewline
120 & -4 & -4.334 &  0.3338 \tabularnewline
\hline
\end{tabular}
%Source: https://freestatistics.org/blog/index.php?pk=285909&T=4

[TABLE]
[ROW][C]Multiple Linear Regression - Actuals, Interpolation, and Residuals[/C][/ROW]
[ROW][C]Time or Index[/C][C]Actuals[/C][C]InterpolationForecast[/C][C]ResidualsPrediction Error[/C][/ROW]
[ROW][C]1[/C][C]-5[/C][C]-4.962[/C][C]-0.03797[/C][/ROW]
[ROW][C]2[/C][C]-1[/C][C]-1.206[/C][C] 0.2059[/C][/ROW]
[ROW][C]3[/C][C]-2[/C][C]-2.403[/C][C] 0.4034[/C][/ROW]
[ROW][C]4[/C][C]-5[/C][C]-5.418[/C][C] 0.4175[/C][/ROW]
[ROW][C]5[/C][C]-4[/C][C]-3.666[/C][C]-0.3341[/C][/ROW]
[ROW][C]6[/C][C]-6[/C][C]-5.661[/C][C]-0.3387[/C][/ROW]
[ROW][C]7[/C][C]-2[/C][C]-2.181[/C][C] 0.1807[/C][/ROW]
[ROW][C]8[/C][C]-2[/C][C]-1.923[/C][C]-0.07658[/C][/ROW]
[ROW][C]9[/C][C]-2[/C][C]-1.608[/C][C]-0.3922[/C][/ROW]
[ROW][C]10[/C][C]-2[/C][C]-1.652[/C][C]-0.3481[/C][/ROW]
[ROW][C]11[/C][C] 2[/C][C] 2.383[/C][C]-0.3834[/C][/ROW]
[ROW][C]12[/C][C] 1[/C][C] 0.6963[/C][C] 0.3037[/C][/ROW]
[ROW][C]13[/C][C]-8[/C][C]-7.937[/C][C]-0.06265[/C][/ROW]
[ROW][C]14[/C][C]-1[/C][C]-1.343[/C][C] 0.3431[/C][/ROW]
[ROW][C]15[/C][C] 1[/C][C] 0.8531[/C][C] 0.1469[/C][/ROW]
[ROW][C]16[/C][C]-1[/C][C]-0.6465[/C][C]-0.3535[/C][/ROW]
[ROW][C]17[/C][C] 2[/C][C] 1.719[/C][C] 0.2814[/C][/ROW]
[ROW][C]18[/C][C] 2[/C][C] 1.856[/C][C] 0.1442[/C][/ROW]
[ROW][C]19[/C][C] 1[/C][C] 1.367[/C][C]-0.3671[/C][/ROW]
[ROW][C]20[/C][C]-1[/C][C]-0.8593[/C][C]-0.1407[/C][/ROW]
[ROW][C]21[/C][C]-2[/C][C]-2.35[/C][C] 0.3498[/C][/ROW]
[ROW][C]22[/C][C]-2[/C][C]-1.834[/C][C]-0.1659[/C][/ROW]
[ROW][C]23[/C][C]-1[/C][C]-0.8388[/C][C]-0.1612[/C][/ROW]
[ROW][C]24[/C][C]-8[/C][C]-7.519[/C][C]-0.4807[/C][/ROW]
[ROW][C]25[/C][C]-4[/C][C]-4.041[/C][C] 0.04131[/C][/ROW]
[ROW][C]26[/C][C]-6[/C][C]-6.282[/C][C] 0.2821[/C][/ROW]
[ROW][C]27[/C][C]-3[/C][C]-3.471[/C][C] 0.4714[/C][/ROW]
[ROW][C]28[/C][C]-3[/C][C]-3.259[/C][C] 0.2588[/C][/ROW]
[ROW][C]29[/C][C]-7[/C][C]-7.234[/C][C] 0.2342[/C][/ROW]
[ROW][C]30[/C][C]-9[/C][C]-8.804[/C][C]-0.1959[/C][/ROW]
[ROW][C]31[/C][C]-11[/C][C]-11.07[/C][C] 0.0716[/C][/ROW]
[ROW][C]32[/C][C]-13[/C][C]-13.07[/C][C] 0.07386[/C][/ROW]
[ROW][C]33[/C][C]-11[/C][C]-11.3[/C][C] 0.3047[/C][/ROW]
[ROW][C]34[/C][C]-9[/C][C]-8.62[/C][C]-0.3799[/C][/ROW]
[ROW][C]35[/C][C]-17[/C][C]-17.15[/C][C] 0.1548[/C][/ROW]
[ROW][C]36[/C][C]-22[/C][C]-21.64[/C][C]-0.3585[/C][/ROW]
[ROW][C]37[/C][C]-25[/C][C]-24.67[/C][C]-0.329[/C][/ROW]
[ROW][C]38[/C][C]-20[/C][C]-20.47[/C][C] 0.4745[/C][/ROW]
[ROW][C]39[/C][C]-24[/C][C]-24.2[/C][C] 0.2049[/C][/ROW]
[ROW][C]40[/C][C]-24[/C][C]-24.21[/C][C] 0.215[/C][/ROW]
[ROW][C]41[/C][C]-22[/C][C]-21.64[/C][C]-0.3648[/C][/ROW]
[ROW][C]42[/C][C]-19[/C][C]-19.64[/C][C] 0.6351[/C][/ROW]
[ROW][C]43[/C][C]-18[/C][C]-17.7[/C][C]-0.3009[/C][/ROW]
[ROW][C]44[/C][C]-17[/C][C]-17.47[/C][C] 0.4677[/C][/ROW]
[ROW][C]45[/C][C]-11[/C][C]-11.21[/C][C] 0.2087[/C][/ROW]
[ROW][C]46[/C][C]-11[/C][C]-11.22[/C][C] 0.2205[/C][/ROW]
[ROW][C]47[/C][C]-12[/C][C]-11.44[/C][C]-0.5594[/C][/ROW]
[ROW][C]48[/C][C]-10[/C][C]-9.905[/C][C]-0.09534[/C][/ROW]
[ROW][C]49[/C][C]-15[/C][C]-15.21[/C][C] 0.2077[/C][/ROW]
[ROW][C]50[/C][C]-15[/C][C]-14.99[/C][C]-0.005906[/C][/ROW]
[ROW][C]51[/C][C]-15[/C][C]-15.23[/C][C] 0.2304[/C][/ROW]
[ROW][C]52[/C][C]-13[/C][C]-12.71[/C][C]-0.2899[/C][/ROW]
[ROW][C]53[/C][C]-8[/C][C]-8.111[/C][C] 0.1112[/C][/ROW]
[ROW][C]54[/C][C]-13[/C][C]-12.92[/C][C]-0.0784[/C][/ROW]
[ROW][C]55[/C][C]-9[/C][C]-9.419[/C][C] 0.4187[/C][/ROW]
[ROW][C]56[/C][C]-7[/C][C]-6.842[/C][C]-0.1583[/C][/ROW]
[ROW][C]57[/C][C]-4[/C][C]-4.111[/C][C] 0.1105[/C][/ROW]
[ROW][C]58[/C][C]-4[/C][C]-4.112[/C][C] 0.1119[/C][/ROW]
[ROW][C]59[/C][C]-2[/C][C]-2.621[/C][C] 0.6213[/C][/ROW]
[ROW][C]60[/C][C] 0[/C][C]-0.3627[/C][C] 0.3627[/C][/ROW]
[ROW][C]61[/C][C]-2[/C][C]-1.882[/C][C]-0.1184[/C][/ROW]
[ROW][C]62[/C][C]-3[/C][C]-3.123[/C][C] 0.1228[/C][/ROW]
[ROW][C]63[/C][C] 1[/C][C] 1.177[/C][C]-0.1767[/C][/ROW]
[ROW][C]64[/C][C]-2[/C][C]-2.572[/C][C] 0.5718[/C][/ROW]
[ROW][C]65[/C][C]-1[/C][C]-1.302[/C][C] 0.3018[/C][/ROW]
[ROW][C]66[/C][C] 1[/C][C] 0.7076[/C][C] 0.2924[/C][/ROW]
[ROW][C]67[/C][C]-3[/C][C]-2.594[/C][C]-0.4065[/C][/ROW]
[ROW][C]68[/C][C]-4[/C][C]-4.289[/C][C] 0.2893[/C][/ROW]
[ROW][C]69[/C][C]-9[/C][C]-8.752[/C][C]-0.2484[/C][/ROW]
[ROW][C]70[/C][C]-9[/C][C]-8.614[/C][C]-0.3855[/C][/ROW]
[ROW][C]71[/C][C]-7[/C][C]-6.613[/C][C]-0.3871[/C][/ROW]
[ROW][C]72[/C][C]-14[/C][C]-13.89[/C][C]-0.1066[/C][/ROW]
[ROW][C]73[/C][C]-12[/C][C]-11.88[/C][C]-0.1194[/C][/ROW]
[ROW][C]74[/C][C]-16[/C][C]-16.34[/C][C] 0.3365[/C][/ROW]
[ROW][C]75[/C][C]-20[/C][C]-19.68[/C][C]-0.3206[/C][/ROW]
[ROW][C]76[/C][C]-12[/C][C]-12.12[/C][C] 0.1221[/C][/ROW]
[ROW][C]77[/C][C]-12[/C][C]-11.87[/C][C]-0.1343[/C][/ROW]
[ROW][C]78[/C][C]-10[/C][C]-10.16[/C][C] 0.1565[/C][/ROW]
[ROW][C]79[/C][C]-10[/C][C]-9.881[/C][C]-0.1192[/C][/ROW]
[ROW][C]80[/C][C]-13[/C][C]-13.07[/C][C] 0.07454[/C][/ROW]
[ROW][C]81[/C][C]-16[/C][C]-15.86[/C][C]-0.1366[/C][/ROW]
[ROW][C]82[/C][C]-14[/C][C]-13.87[/C][C]-0.1254[/C][/ROW]
[ROW][C]83[/C][C]-17[/C][C]-16.69[/C][C]-0.3052[/C][/ROW]
[ROW][C]84[/C][C]-24[/C][C]-24.42[/C][C] 0.4234[/C][/ROW]
[ROW][C]85[/C][C]-25[/C][C]-24.81[/C][C]-0.1905[/C][/ROW]
[ROW][C]86[/C][C]-23[/C][C]-23.08[/C][C] 0.08047[/C][/ROW]
[ROW][C]87[/C][C]-17[/C][C]-17.37[/C][C] 0.3661[/C][/ROW]
[ROW][C]88[/C][C]-24[/C][C]-23.84[/C][C]-0.1588[/C][/ROW]
[ROW][C]89[/C][C]-20[/C][C]-19.88[/C][C]-0.1163[/C][/ROW]
[ROW][C]90[/C][C]-19[/C][C]-18.62[/C][C]-0.3815[/C][/ROW]
[ROW][C]91[/C][C]-18[/C][C]-17.92[/C][C]-0.07931[/C][/ROW]
[ROW][C]92[/C][C]-16[/C][C]-16.41[/C][C] 0.4088[/C][/ROW]
[ROW][C]93[/C][C]-12[/C][C]-12.32[/C][C] 0.3212[/C][/ROW]
[ROW][C]94[/C][C]-7[/C][C]-6.894[/C][C]-0.1059[/C][/ROW]
[ROW][C]95[/C][C]-6[/C][C]-6.36[/C][C] 0.3604[/C][/ROW]
[ROW][C]96[/C][C]-6[/C][C]-5.591[/C][C]-0.4095[/C][/ROW]
[ROW][C]97[/C][C]-5[/C][C]-5.083[/C][C] 0.08305[/C][/ROW]
[ROW][C]98[/C][C]-4[/C][C]-3.865[/C][C]-0.1354[/C][/ROW]
[ROW][C]99[/C][C]-4[/C][C]-3.805[/C][C]-0.1948[/C][/ROW]
[ROW][C]100[/C][C]-8[/C][C]-7.816[/C][C]-0.184[/C][/ROW]
[ROW][C]101[/C][C]-9[/C][C]-8.826[/C][C]-0.1738[/C][/ROW]
[ROW][C]102[/C][C]-6[/C][C]-6.551[/C][C] 0.5513[/C][/ROW]
[ROW][C]103[/C][C]-7[/C][C]-6.788[/C][C]-0.2115[/C][/ROW]
[ROW][C]104[/C][C]-10[/C][C]-9.594[/C][C]-0.4057[/C][/ROW]
[ROW][C]105[/C][C]-11[/C][C]-11.02[/C][C] 0.02071[/C][/ROW]
[ROW][C]106[/C][C]-11[/C][C]-10.78[/C][C]-0.2156[/C][/ROW]
[ROW][C]107[/C][C]-12[/C][C]-11.82[/C][C]-0.1836[/C][/ROW]
[ROW][C]108[/C][C]-14[/C][C]-14.04[/C][C] 0.03896[/C][/ROW]
[ROW][C]109[/C][C]-12[/C][C]-11.57[/C][C]-0.4329[/C][/ROW]
[ROW][C]110[/C][C]-9[/C][C]-9.054[/C][C] 0.05381[/C][/ROW]
[ROW][C]111[/C][C]-5[/C][C]-4.559[/C][C]-0.4413[/C][/ROW]
[ROW][C]112[/C][C]-6[/C][C]-6.115[/C][C] 0.1152[/C][/ROW]
[ROW][C]113[/C][C]-6[/C][C]-5.86[/C][C]-0.1404[/C][/ROW]
[ROW][C]114[/C][C]-3[/C][C]-2.623[/C][C]-0.3773[/C][/ROW]
[ROW][C]115[/C][C]-2[/C][C]-1.834[/C][C]-0.1664[/C][/ROW]
[ROW][C]116[/C][C]-6[/C][C]-5.558[/C][C]-0.4421[/C][/ROW]
[ROW][C]117[/C][C]-6[/C][C]-5.87[/C][C]-0.1302[/C][/ROW]
[ROW][C]118[/C][C]-10[/C][C]-10.6[/C][C] 0.5967[/C][/ROW]
[ROW][C]119[/C][C]-8[/C][C]-7.834[/C][C]-0.1659[/C][/ROW]
[ROW][C]120[/C][C]-4[/C][C]-4.334[/C][C] 0.3338[/C][/ROW]
[/TABLE]
Source: https://freestatistics.org/blog/index.php?pk=285909&T=4

Globally Unique Identifier (entire table): ba.freestatistics.org/blog/index.php?pk=285909&T=4

As an alternative you can also use a QR Code:  

The GUIDs for individual cells are displayed in the table below:

Multiple Linear Regression - Actuals, Interpolation, and Residuals
Time or IndexActualsInterpolationForecastResidualsPrediction Error
1-5-4.962-0.03797
2-1-1.206 0.2059
3-2-2.403 0.4034
4-5-5.418 0.4175
5-4-3.666-0.3341
6-6-5.661-0.3387
7-2-2.181 0.1807
8-2-1.923-0.07658
9-2-1.608-0.3922
10-2-1.652-0.3481
11 2 2.383-0.3834
12 1 0.6963 0.3037
13-8-7.937-0.06265
14-1-1.343 0.3431
15 1 0.8531 0.1469
16-1-0.6465-0.3535
17 2 1.719 0.2814
18 2 1.856 0.1442
19 1 1.367-0.3671
20-1-0.8593-0.1407
21-2-2.35 0.3498
22-2-1.834-0.1659
23-1-0.8388-0.1612
24-8-7.519-0.4807
25-4-4.041 0.04131
26-6-6.282 0.2821
27-3-3.471 0.4714
28-3-3.259 0.2588
29-7-7.234 0.2342
30-9-8.804-0.1959
31-11-11.07 0.0716
32-13-13.07 0.07386
33-11-11.3 0.3047
34-9-8.62-0.3799
35-17-17.15 0.1548
36-22-21.64-0.3585
37-25-24.67-0.329
38-20-20.47 0.4745
39-24-24.2 0.2049
40-24-24.21 0.215
41-22-21.64-0.3648
42-19-19.64 0.6351
43-18-17.7-0.3009
44-17-17.47 0.4677
45-11-11.21 0.2087
46-11-11.22 0.2205
47-12-11.44-0.5594
48-10-9.905-0.09534
49-15-15.21 0.2077
50-15-14.99-0.005906
51-15-15.23 0.2304
52-13-12.71-0.2899
53-8-8.111 0.1112
54-13-12.92-0.0784
55-9-9.419 0.4187
56-7-6.842-0.1583
57-4-4.111 0.1105
58-4-4.112 0.1119
59-2-2.621 0.6213
60 0-0.3627 0.3627
61-2-1.882-0.1184
62-3-3.123 0.1228
63 1 1.177-0.1767
64-2-2.572 0.5718
65-1-1.302 0.3018
66 1 0.7076 0.2924
67-3-2.594-0.4065
68-4-4.289 0.2893
69-9-8.752-0.2484
70-9-8.614-0.3855
71-7-6.613-0.3871
72-14-13.89-0.1066
73-12-11.88-0.1194
74-16-16.34 0.3365
75-20-19.68-0.3206
76-12-12.12 0.1221
77-12-11.87-0.1343
78-10-10.16 0.1565
79-10-9.881-0.1192
80-13-13.07 0.07454
81-16-15.86-0.1366
82-14-13.87-0.1254
83-17-16.69-0.3052
84-24-24.42 0.4234
85-25-24.81-0.1905
86-23-23.08 0.08047
87-17-17.37 0.3661
88-24-23.84-0.1588
89-20-19.88-0.1163
90-19-18.62-0.3815
91-18-17.92-0.07931
92-16-16.41 0.4088
93-12-12.32 0.3212
94-7-6.894-0.1059
95-6-6.36 0.3604
96-6-5.591-0.4095
97-5-5.083 0.08305
98-4-3.865-0.1354
99-4-3.805-0.1948
100-8-7.816-0.184
101-9-8.826-0.1738
102-6-6.551 0.5513
103-7-6.788-0.2115
104-10-9.594-0.4057
105-11-11.02 0.02071
106-11-10.78-0.2156
107-12-11.82-0.1836
108-14-14.04 0.03896
109-12-11.57-0.4329
110-9-9.054 0.05381
111-5-4.559-0.4413
112-6-6.115 0.1152
113-6-5.86-0.1404
114-3-2.623-0.3773
115-2-1.834-0.1664
116-6-5.558-0.4421
117-6-5.87-0.1302
118-10-10.6 0.5967
119-8-7.834-0.1659
120-4-4.334 0.3338


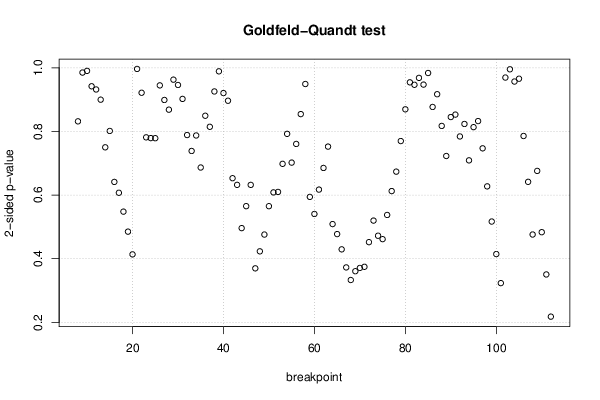
Goldfeld-Quandt test for Heteroskedasticity
p-valuesAlternative Hypothesis
breakpoint indexgreater2-sidedless
8 0.5841 0.8319 0.4159
9 0.4926 0.9852 0.5074
10 0.4952 0.9905 0.5048
11 0.4711 0.9422 0.5289
12 0.466 0.932 0.534
13 0.45 0.9 0.55
14 0.3751 0.7502 0.6249
15 0.4008 0.8016 0.5992
16 0.3207 0.6414 0.6793
17 0.3036 0.6073 0.6964
18 0.274 0.5479 0.726
19 0.2425 0.485 0.7575
20 0.2068 0.4136 0.7932
21 0.5017 0.9966 0.4983
22 0.4609 0.9217 0.5391
23 0.3908 0.7816 0.6092
24 0.3896 0.7792 0.6104
25 0.3894 0.7788 0.6106
26 0.5275 0.9449 0.4725
27 0.5505 0.8991 0.4495
28 0.5657 0.8686 0.4343
29 0.5186 0.9629 0.4814
30 0.4731 0.9462 0.5269
31 0.4512 0.9024 0.5488
32 0.3944 0.7888 0.6056
33 0.3694 0.7387 0.6306
34 0.3937 0.7874 0.6063
35 0.3433 0.6867 0.6567
36 0.4247 0.8494 0.5753
37 0.4074 0.8147 0.5926
38 0.5371 0.9258 0.4629
39 0.4946 0.9891 0.5054
40 0.4604 0.9208 0.5396
41 0.5517 0.8966 0.4483
42 0.6735 0.653 0.3265
43 0.6839 0.6321 0.3161
44 0.7519 0.4961 0.2481
45 0.7174 0.5651 0.2826
46 0.684 0.6321 0.316
47 0.8152 0.3697 0.1848
48 0.7884 0.4232 0.2116
49 0.7621 0.4759 0.2379
50 0.7174 0.5651 0.2826
51 0.6957 0.6085 0.3043
52 0.6951 0.6099 0.3049
53 0.6509 0.6983 0.3491
54 0.6038 0.7925 0.3962
55 0.6489 0.7021 0.3511
56 0.6196 0.7607 0.3804
57 0.5727 0.8546 0.4273
58 0.5254 0.9492 0.4746
59 0.7029 0.5942 0.2971
60 0.7297 0.5407 0.2703
61 0.6914 0.6173 0.3086
62 0.6574 0.6853 0.3426
63 0.6238 0.7524 0.3762
64 0.7456 0.5088 0.2544
65 0.7613 0.4774 0.2387
66 0.7853 0.4294 0.2147
67 0.8137 0.3726 0.1863
68 0.8335 0.333 0.1665
69 0.8197 0.3606 0.1803
70 0.8145 0.3709 0.1855
71 0.8127 0.3745 0.1873
72 0.774 0.4521 0.226
73 0.7401 0.5198 0.2599
74 0.7639 0.4722 0.2361
75 0.7693 0.4614 0.2307
76 0.7312 0.5375 0.2688
77 0.6937 0.6126 0.3063
78 0.6631 0.6737 0.3369
79 0.615 0.7699 0.385
80 0.5651 0.8697 0.4349
81 0.5228 0.9545 0.4772
82 0.4734 0.9469 0.5266
83 0.4842 0.9684 0.5158
84 0.5263 0.9473 0.4737
85 0.4919 0.9839 0.5081
86 0.4386 0.8771 0.5614
87 0.4586 0.9171 0.5414
88 0.4087 0.8174 0.5913
89 0.3614 0.7229 0.6386
90 0.4227 0.8454 0.5773
91 0.4265 0.8531 0.5735
92 0.3922 0.7844 0.6078
93 0.4118 0.8236 0.5882
94 0.3546 0.7092 0.6454
95 0.4068 0.8136 0.5932
96 0.4164 0.8327 0.5836
97 0.3735 0.747 0.6265
98 0.3137 0.6275 0.6863
99 0.2584 0.5168 0.7416
100 0.2073 0.4145 0.7927
101 0.1616 0.3232 0.8384
102 0.5152 0.9695 0.4848
103 0.4978 0.9956 0.5022
104 0.4785 0.957 0.5215
105 0.4829 0.9658 0.5171
106 0.3929 0.7858 0.6071
107 0.3208 0.6416 0.6792
108 0.238 0.476 0.762
109 0.338 0.676 0.662
110 0.2417 0.4833 0.7583
111 0.1752 0.3504 0.8248
112 0.1089 0.2178 0.8911

\begin{tabular}{lllllllll}
\hline
Goldfeld-Quandt test for Heteroskedasticity \tabularnewline
p-values & Alternative Hypothesis \tabularnewline
breakpoint index & greater & 2-sided & less \tabularnewline
8 &  0.5841 &  0.8319 &  0.4159 \tabularnewline
9 &  0.4926 &  0.9852 &  0.5074 \tabularnewline
10 &  0.4952 &  0.9905 &  0.5048 \tabularnewline
11 &  0.4711 &  0.9422 &  0.5289 \tabularnewline
12 &  0.466 &  0.932 &  0.534 \tabularnewline
13 &  0.45 &  0.9 &  0.55 \tabularnewline
14 &  0.3751 &  0.7502 &  0.6249 \tabularnewline
15 &  0.4008 &  0.8016 &  0.5992 \tabularnewline
16 &  0.3207 &  0.6414 &  0.6793 \tabularnewline
17 &  0.3036 &  0.6073 &  0.6964 \tabularnewline
18 &  0.274 &  0.5479 &  0.726 \tabularnewline
19 &  0.2425 &  0.485 &  0.7575 \tabularnewline
20 &  0.2068 &  0.4136 &  0.7932 \tabularnewline
21 &  0.5017 &  0.9966 &  0.4983 \tabularnewline
22 &  0.4609 &  0.9217 &  0.5391 \tabularnewline
23 &  0.3908 &  0.7816 &  0.6092 \tabularnewline
24 &  0.3896 &  0.7792 &  0.6104 \tabularnewline
25 &  0.3894 &  0.7788 &  0.6106 \tabularnewline
26 &  0.5275 &  0.9449 &  0.4725 \tabularnewline
27 &  0.5505 &  0.8991 &  0.4495 \tabularnewline
28 &  0.5657 &  0.8686 &  0.4343 \tabularnewline
29 &  0.5186 &  0.9629 &  0.4814 \tabularnewline
30 &  0.4731 &  0.9462 &  0.5269 \tabularnewline
31 &  0.4512 &  0.9024 &  0.5488 \tabularnewline
32 &  0.3944 &  0.7888 &  0.6056 \tabularnewline
33 &  0.3694 &  0.7387 &  0.6306 \tabularnewline
34 &  0.3937 &  0.7874 &  0.6063 \tabularnewline
35 &  0.3433 &  0.6867 &  0.6567 \tabularnewline
36 &  0.4247 &  0.8494 &  0.5753 \tabularnewline
37 &  0.4074 &  0.8147 &  0.5926 \tabularnewline
38 &  0.5371 &  0.9258 &  0.4629 \tabularnewline
39 &  0.4946 &  0.9891 &  0.5054 \tabularnewline
40 &  0.4604 &  0.9208 &  0.5396 \tabularnewline
41 &  0.5517 &  0.8966 &  0.4483 \tabularnewline
42 &  0.6735 &  0.653 &  0.3265 \tabularnewline
43 &  0.6839 &  0.6321 &  0.3161 \tabularnewline
44 &  0.7519 &  0.4961 &  0.2481 \tabularnewline
45 &  0.7174 &  0.5651 &  0.2826 \tabularnewline
46 &  0.684 &  0.6321 &  0.316 \tabularnewline
47 &  0.8152 &  0.3697 &  0.1848 \tabularnewline
48 &  0.7884 &  0.4232 &  0.2116 \tabularnewline
49 &  0.7621 &  0.4759 &  0.2379 \tabularnewline
50 &  0.7174 &  0.5651 &  0.2826 \tabularnewline
51 &  0.6957 &  0.6085 &  0.3043 \tabularnewline
52 &  0.6951 &  0.6099 &  0.3049 \tabularnewline
53 &  0.6509 &  0.6983 &  0.3491 \tabularnewline
54 &  0.6038 &  0.7925 &  0.3962 \tabularnewline
55 &  0.6489 &  0.7021 &  0.3511 \tabularnewline
56 &  0.6196 &  0.7607 &  0.3804 \tabularnewline
57 &  0.5727 &  0.8546 &  0.4273 \tabularnewline
58 &  0.5254 &  0.9492 &  0.4746 \tabularnewline
59 &  0.7029 &  0.5942 &  0.2971 \tabularnewline
60 &  0.7297 &  0.5407 &  0.2703 \tabularnewline
61 &  0.6914 &  0.6173 &  0.3086 \tabularnewline
62 &  0.6574 &  0.6853 &  0.3426 \tabularnewline
63 &  0.6238 &  0.7524 &  0.3762 \tabularnewline
64 &  0.7456 &  0.5088 &  0.2544 \tabularnewline
65 &  0.7613 &  0.4774 &  0.2387 \tabularnewline
66 &  0.7853 &  0.4294 &  0.2147 \tabularnewline
67 &  0.8137 &  0.3726 &  0.1863 \tabularnewline
68 &  0.8335 &  0.333 &  0.1665 \tabularnewline
69 &  0.8197 &  0.3606 &  0.1803 \tabularnewline
70 &  0.8145 &  0.3709 &  0.1855 \tabularnewline
71 &  0.8127 &  0.3745 &  0.1873 \tabularnewline
72 &  0.774 &  0.4521 &  0.226 \tabularnewline
73 &  0.7401 &  0.5198 &  0.2599 \tabularnewline
74 &  0.7639 &  0.4722 &  0.2361 \tabularnewline
75 &  0.7693 &  0.4614 &  0.2307 \tabularnewline
76 &  0.7312 &  0.5375 &  0.2688 \tabularnewline
77 &  0.6937 &  0.6126 &  0.3063 \tabularnewline
78 &  0.6631 &  0.6737 &  0.3369 \tabularnewline
79 &  0.615 &  0.7699 &  0.385 \tabularnewline
80 &  0.5651 &  0.8697 &  0.4349 \tabularnewline
81 &  0.5228 &  0.9545 &  0.4772 \tabularnewline
82 &  0.4734 &  0.9469 &  0.5266 \tabularnewline
83 &  0.4842 &  0.9684 &  0.5158 \tabularnewline
84 &  0.5263 &  0.9473 &  0.4737 \tabularnewline
85 &  0.4919 &  0.9839 &  0.5081 \tabularnewline
86 &  0.4386 &  0.8771 &  0.5614 \tabularnewline
87 &  0.4586 &  0.9171 &  0.5414 \tabularnewline
88 &  0.4087 &  0.8174 &  0.5913 \tabularnewline
89 &  0.3614 &  0.7229 &  0.6386 \tabularnewline
90 &  0.4227 &  0.8454 &  0.5773 \tabularnewline
91 &  0.4265 &  0.8531 &  0.5735 \tabularnewline
92 &  0.3922 &  0.7844 &  0.6078 \tabularnewline
93 &  0.4118 &  0.8236 &  0.5882 \tabularnewline
94 &  0.3546 &  0.7092 &  0.6454 \tabularnewline
95 &  0.4068 &  0.8136 &  0.5932 \tabularnewline
96 &  0.4164 &  0.8327 &  0.5836 \tabularnewline
97 &  0.3735 &  0.747 &  0.6265 \tabularnewline
98 &  0.3137 &  0.6275 &  0.6863 \tabularnewline
99 &  0.2584 &  0.5168 &  0.7416 \tabularnewline
100 &  0.2073 &  0.4145 &  0.7927 \tabularnewline
101 &  0.1616 &  0.3232 &  0.8384 \tabularnewline
102 &  0.5152 &  0.9695 &  0.4848 \tabularnewline
103 &  0.4978 &  0.9956 &  0.5022 \tabularnewline
104 &  0.4785 &  0.957 &  0.5215 \tabularnewline
105 &  0.4829 &  0.9658 &  0.5171 \tabularnewline
106 &  0.3929 &  0.7858 &  0.6071 \tabularnewline
107 &  0.3208 &  0.6416 &  0.6792 \tabularnewline
108 &  0.238 &  0.476 &  0.762 \tabularnewline
109 &  0.338 &  0.676 &  0.662 \tabularnewline
110 &  0.2417 &  0.4833 &  0.7583 \tabularnewline
111 &  0.1752 &  0.3504 &  0.8248 \tabularnewline
112 &  0.1089 &  0.2178 &  0.8911 \tabularnewline
\hline
\end{tabular}
%Source: https://freestatistics.org/blog/index.php?pk=285909&T=5

[TABLE]
[ROW][C]Goldfeld-Quandt test for Heteroskedasticity[/C][/ROW]
[ROW][C]p-values[/C][C]Alternative Hypothesis[/C][/ROW]
[ROW][C]breakpoint index[/C][C]greater[/C][C]2-sided[/C][C]less[/C][/ROW]
[ROW][C]8[/C][C] 0.5841[/C][C] 0.8319[/C][C] 0.4159[/C][/ROW]
[ROW][C]9[/C][C] 0.4926[/C][C] 0.9852[/C][C] 0.5074[/C][/ROW]
[ROW][C]10[/C][C] 0.4952[/C][C] 0.9905[/C][C] 0.5048[/C][/ROW]
[ROW][C]11[/C][C] 0.4711[/C][C] 0.9422[/C][C] 0.5289[/C][/ROW]
[ROW][C]12[/C][C] 0.466[/C][C] 0.932[/C][C] 0.534[/C][/ROW]
[ROW][C]13[/C][C] 0.45[/C][C] 0.9[/C][C] 0.55[/C][/ROW]
[ROW][C]14[/C][C] 0.3751[/C][C] 0.7502[/C][C] 0.6249[/C][/ROW]
[ROW][C]15[/C][C] 0.4008[/C][C] 0.8016[/C][C] 0.5992[/C][/ROW]
[ROW][C]16[/C][C] 0.3207[/C][C] 0.6414[/C][C] 0.6793[/C][/ROW]
[ROW][C]17[/C][C] 0.3036[/C][C] 0.6073[/C][C] 0.6964[/C][/ROW]
[ROW][C]18[/C][C] 0.274[/C][C] 0.5479[/C][C] 0.726[/C][/ROW]
[ROW][C]19[/C][C] 0.2425[/C][C] 0.485[/C][C] 0.7575[/C][/ROW]
[ROW][C]20[/C][C] 0.2068[/C][C] 0.4136[/C][C] 0.7932[/C][/ROW]
[ROW][C]21[/C][C] 0.5017[/C][C] 0.9966[/C][C] 0.4983[/C][/ROW]
[ROW][C]22[/C][C] 0.4609[/C][C] 0.9217[/C][C] 0.5391[/C][/ROW]
[ROW][C]23[/C][C] 0.3908[/C][C] 0.7816[/C][C] 0.6092[/C][/ROW]
[ROW][C]24[/C][C] 0.3896[/C][C] 0.7792[/C][C] 0.6104[/C][/ROW]
[ROW][C]25[/C][C] 0.3894[/C][C] 0.7788[/C][C] 0.6106[/C][/ROW]
[ROW][C]26[/C][C] 0.5275[/C][C] 0.9449[/C][C] 0.4725[/C][/ROW]
[ROW][C]27[/C][C] 0.5505[/C][C] 0.8991[/C][C] 0.4495[/C][/ROW]
[ROW][C]28[/C][C] 0.5657[/C][C] 0.8686[/C][C] 0.4343[/C][/ROW]
[ROW][C]29[/C][C] 0.5186[/C][C] 0.9629[/C][C] 0.4814[/C][/ROW]
[ROW][C]30[/C][C] 0.4731[/C][C] 0.9462[/C][C] 0.5269[/C][/ROW]
[ROW][C]31[/C][C] 0.4512[/C][C] 0.9024[/C][C] 0.5488[/C][/ROW]
[ROW][C]32[/C][C] 0.3944[/C][C] 0.7888[/C][C] 0.6056[/C][/ROW]
[ROW][C]33[/C][C] 0.3694[/C][C] 0.7387[/C][C] 0.6306[/C][/ROW]
[ROW][C]34[/C][C] 0.3937[/C][C] 0.7874[/C][C] 0.6063[/C][/ROW]
[ROW][C]35[/C][C] 0.3433[/C][C] 0.6867[/C][C] 0.6567[/C][/ROW]
[ROW][C]36[/C][C] 0.4247[/C][C] 0.8494[/C][C] 0.5753[/C][/ROW]
[ROW][C]37[/C][C] 0.4074[/C][C] 0.8147[/C][C] 0.5926[/C][/ROW]
[ROW][C]38[/C][C] 0.5371[/C][C] 0.9258[/C][C] 0.4629[/C][/ROW]
[ROW][C]39[/C][C] 0.4946[/C][C] 0.9891[/C][C] 0.5054[/C][/ROW]
[ROW][C]40[/C][C] 0.4604[/C][C] 0.9208[/C][C] 0.5396[/C][/ROW]
[ROW][C]41[/C][C] 0.5517[/C][C] 0.8966[/C][C] 0.4483[/C][/ROW]
[ROW][C]42[/C][C] 0.6735[/C][C] 0.653[/C][C] 0.3265[/C][/ROW]
[ROW][C]43[/C][C] 0.6839[/C][C] 0.6321[/C][C] 0.3161[/C][/ROW]
[ROW][C]44[/C][C] 0.7519[/C][C] 0.4961[/C][C] 0.2481[/C][/ROW]
[ROW][C]45[/C][C] 0.7174[/C][C] 0.5651[/C][C] 0.2826[/C][/ROW]
[ROW][C]46[/C][C] 0.684[/C][C] 0.6321[/C][C] 0.316[/C][/ROW]
[ROW][C]47[/C][C] 0.8152[/C][C] 0.3697[/C][C] 0.1848[/C][/ROW]
[ROW][C]48[/C][C] 0.7884[/C][C] 0.4232[/C][C] 0.2116[/C][/ROW]
[ROW][C]49[/C][C] 0.7621[/C][C] 0.4759[/C][C] 0.2379[/C][/ROW]
[ROW][C]50[/C][C] 0.7174[/C][C] 0.5651[/C][C] 0.2826[/C][/ROW]
[ROW][C]51[/C][C] 0.6957[/C][C] 0.6085[/C][C] 0.3043[/C][/ROW]
[ROW][C]52[/C][C] 0.6951[/C][C] 0.6099[/C][C] 0.3049[/C][/ROW]
[ROW][C]53[/C][C] 0.6509[/C][C] 0.6983[/C][C] 0.3491[/C][/ROW]
[ROW][C]54[/C][C] 0.6038[/C][C] 0.7925[/C][C] 0.3962[/C][/ROW]
[ROW][C]55[/C][C] 0.6489[/C][C] 0.7021[/C][C] 0.3511[/C][/ROW]
[ROW][C]56[/C][C] 0.6196[/C][C] 0.7607[/C][C] 0.3804[/C][/ROW]
[ROW][C]57[/C][C] 0.5727[/C][C] 0.8546[/C][C] 0.4273[/C][/ROW]
[ROW][C]58[/C][C] 0.5254[/C][C] 0.9492[/C][C] 0.4746[/C][/ROW]
[ROW][C]59[/C][C] 0.7029[/C][C] 0.5942[/C][C] 0.2971[/C][/ROW]
[ROW][C]60[/C][C] 0.7297[/C][C] 0.5407[/C][C] 0.2703[/C][/ROW]
[ROW][C]61[/C][C] 0.6914[/C][C] 0.6173[/C][C] 0.3086[/C][/ROW]
[ROW][C]62[/C][C] 0.6574[/C][C] 0.6853[/C][C] 0.3426[/C][/ROW]
[ROW][C]63[/C][C] 0.6238[/C][C] 0.7524[/C][C] 0.3762[/C][/ROW]
[ROW][C]64[/C][C] 0.7456[/C][C] 0.5088[/C][C] 0.2544[/C][/ROW]
[ROW][C]65[/C][C] 0.7613[/C][C] 0.4774[/C][C] 0.2387[/C][/ROW]
[ROW][C]66[/C][C] 0.7853[/C][C] 0.4294[/C][C] 0.2147[/C][/ROW]
[ROW][C]67[/C][C] 0.8137[/C][C] 0.3726[/C][C] 0.1863[/C][/ROW]
[ROW][C]68[/C][C] 0.8335[/C][C] 0.333[/C][C] 0.1665[/C][/ROW]
[ROW][C]69[/C][C] 0.8197[/C][C] 0.3606[/C][C] 0.1803[/C][/ROW]
[ROW][C]70[/C][C] 0.8145[/C][C] 0.3709[/C][C] 0.1855[/C][/ROW]
[ROW][C]71[/C][C] 0.8127[/C][C] 0.3745[/C][C] 0.1873[/C][/ROW]
[ROW][C]72[/C][C] 0.774[/C][C] 0.4521[/C][C] 0.226[/C][/ROW]
[ROW][C]73[/C][C] 0.7401[/C][C] 0.5198[/C][C] 0.2599[/C][/ROW]
[ROW][C]74[/C][C] 0.7639[/C][C] 0.4722[/C][C] 0.2361[/C][/ROW]
[ROW][C]75[/C][C] 0.7693[/C][C] 0.4614[/C][C] 0.2307[/C][/ROW]
[ROW][C]76[/C][C] 0.7312[/C][C] 0.5375[/C][C] 0.2688[/C][/ROW]
[ROW][C]77[/C][C] 0.6937[/C][C] 0.6126[/C][C] 0.3063[/C][/ROW]
[ROW][C]78[/C][C] 0.6631[/C][C] 0.6737[/C][C] 0.3369[/C][/ROW]
[ROW][C]79[/C][C] 0.615[/C][C] 0.7699[/C][C] 0.385[/C][/ROW]
[ROW][C]80[/C][C] 0.5651[/C][C] 0.8697[/C][C] 0.4349[/C][/ROW]
[ROW][C]81[/C][C] 0.5228[/C][C] 0.9545[/C][C] 0.4772[/C][/ROW]
[ROW][C]82[/C][C] 0.4734[/C][C] 0.9469[/C][C] 0.5266[/C][/ROW]
[ROW][C]83[/C][C] 0.4842[/C][C] 0.9684[/C][C] 0.5158[/C][/ROW]
[ROW][C]84[/C][C] 0.5263[/C][C] 0.9473[/C][C] 0.4737[/C][/ROW]
[ROW][C]85[/C][C] 0.4919[/C][C] 0.9839[/C][C] 0.5081[/C][/ROW]
[ROW][C]86[/C][C] 0.4386[/C][C] 0.8771[/C][C] 0.5614[/C][/ROW]
[ROW][C]87[/C][C] 0.4586[/C][C] 0.9171[/C][C] 0.5414[/C][/ROW]
[ROW][C]88[/C][C] 0.4087[/C][C] 0.8174[/C][C] 0.5913[/C][/ROW]
[ROW][C]89[/C][C] 0.3614[/C][C] 0.7229[/C][C] 0.6386[/C][/ROW]
[ROW][C]90[/C][C] 0.4227[/C][C] 0.8454[/C][C] 0.5773[/C][/ROW]
[ROW][C]91[/C][C] 0.4265[/C][C] 0.8531[/C][C] 0.5735[/C][/ROW]
[ROW][C]92[/C][C] 0.3922[/C][C] 0.7844[/C][C] 0.6078[/C][/ROW]
[ROW][C]93[/C][C] 0.4118[/C][C] 0.8236[/C][C] 0.5882[/C][/ROW]
[ROW][C]94[/C][C] 0.3546[/C][C] 0.7092[/C][C] 0.6454[/C][/ROW]
[ROW][C]95[/C][C] 0.4068[/C][C] 0.8136[/C][C] 0.5932[/C][/ROW]
[ROW][C]96[/C][C] 0.4164[/C][C] 0.8327[/C][C] 0.5836[/C][/ROW]
[ROW][C]97[/C][C] 0.3735[/C][C] 0.747[/C][C] 0.6265[/C][/ROW]
[ROW][C]98[/C][C] 0.3137[/C][C] 0.6275[/C][C] 0.6863[/C][/ROW]
[ROW][C]99[/C][C] 0.2584[/C][C] 0.5168[/C][C] 0.7416[/C][/ROW]
[ROW][C]100[/C][C] 0.2073[/C][C] 0.4145[/C][C] 0.7927[/C][/ROW]
[ROW][C]101[/C][C] 0.1616[/C][C] 0.3232[/C][C] 0.8384[/C][/ROW]
[ROW][C]102[/C][C] 0.5152[/C][C] 0.9695[/C][C] 0.4848[/C][/ROW]
[ROW][C]103[/C][C] 0.4978[/C][C] 0.9956[/C][C] 0.5022[/C][/ROW]
[ROW][C]104[/C][C] 0.4785[/C][C] 0.957[/C][C] 0.5215[/C][/ROW]
[ROW][C]105[/C][C] 0.4829[/C][C] 0.9658[/C][C] 0.5171[/C][/ROW]
[ROW][C]106[/C][C] 0.3929[/C][C] 0.7858[/C][C] 0.6071[/C][/ROW]
[ROW][C]107[/C][C] 0.3208[/C][C] 0.6416[/C][C] 0.6792[/C][/ROW]
[ROW][C]108[/C][C] 0.238[/C][C] 0.476[/C][C] 0.762[/C][/ROW]
[ROW][C]109[/C][C] 0.338[/C][C] 0.676[/C][C] 0.662[/C][/ROW]
[ROW][C]110[/C][C] 0.2417[/C][C] 0.4833[/C][C] 0.7583[/C][/ROW]
[ROW][C]111[/C][C] 0.1752[/C][C] 0.3504[/C][C] 0.8248[/C][/ROW]
[ROW][C]112[/C][C] 0.1089[/C][C] 0.2178[/C][C] 0.8911[/C][/ROW]
[/TABLE]
Source: https://freestatistics.org/blog/index.php?pk=285909&T=5

Globally Unique Identifier (entire table): ba.freestatistics.org/blog/index.php?pk=285909&T=5

As an alternative you can also use a QR Code:  

The GUIDs for individual cells are displayed in the table below:

Goldfeld-Quandt test for Heteroskedasticity
p-valuesAlternative Hypothesis
breakpoint indexgreater2-sidedless
8 0.5841 0.8319 0.4159
9 0.4926 0.9852 0.5074
10 0.4952 0.9905 0.5048
11 0.4711 0.9422 0.5289
12 0.466 0.932 0.534
13 0.45 0.9 0.55
14 0.3751 0.7502 0.6249
15 0.4008 0.8016 0.5992
16 0.3207 0.6414 0.6793
17 0.3036 0.6073 0.6964
18 0.274 0.5479 0.726
19 0.2425 0.485 0.7575
20 0.2068 0.4136 0.7932
21 0.5017 0.9966 0.4983
22 0.4609 0.9217 0.5391
23 0.3908 0.7816 0.6092
24 0.3896 0.7792 0.6104
25 0.3894 0.7788 0.6106
26 0.5275 0.9449 0.4725
27 0.5505 0.8991 0.4495
28 0.5657 0.8686 0.4343
29 0.5186 0.9629 0.4814
30 0.4731 0.9462 0.5269
31 0.4512 0.9024 0.5488
32 0.3944 0.7888 0.6056
33 0.3694 0.7387 0.6306
34 0.3937 0.7874 0.6063
35 0.3433 0.6867 0.6567
36 0.4247 0.8494 0.5753
37 0.4074 0.8147 0.5926
38 0.5371 0.9258 0.4629
39 0.4946 0.9891 0.5054
40 0.4604 0.9208 0.5396
41 0.5517 0.8966 0.4483
42 0.6735 0.653 0.3265
43 0.6839 0.6321 0.3161
44 0.7519 0.4961 0.2481
45 0.7174 0.5651 0.2826
46 0.684 0.6321 0.316
47 0.8152 0.3697 0.1848
48 0.7884 0.4232 0.2116
49 0.7621 0.4759 0.2379
50 0.7174 0.5651 0.2826
51 0.6957 0.6085 0.3043
52 0.6951 0.6099 0.3049
53 0.6509 0.6983 0.3491
54 0.6038 0.7925 0.3962
55 0.6489 0.7021 0.3511
56 0.6196 0.7607 0.3804
57 0.5727 0.8546 0.4273
58 0.5254 0.9492 0.4746
59 0.7029 0.5942 0.2971
60 0.7297 0.5407 0.2703
61 0.6914 0.6173 0.3086
62 0.6574 0.6853 0.3426
63 0.6238 0.7524 0.3762
64 0.7456 0.5088 0.2544
65 0.7613 0.4774 0.2387
66 0.7853 0.4294 0.2147
67 0.8137 0.3726 0.1863
68 0.8335 0.333 0.1665
69 0.8197 0.3606 0.1803
70 0.8145 0.3709 0.1855
71 0.8127 0.3745 0.1873
72 0.774 0.4521 0.226
73 0.7401 0.5198 0.2599
74 0.7639 0.4722 0.2361
75 0.7693 0.4614 0.2307
76 0.7312 0.5375 0.2688
77 0.6937 0.6126 0.3063
78 0.6631 0.6737 0.3369
79 0.615 0.7699 0.385
80 0.5651 0.8697 0.4349
81 0.5228 0.9545 0.4772
82 0.4734 0.9469 0.5266
83 0.4842 0.9684 0.5158
84 0.5263 0.9473 0.4737
85 0.4919 0.9839 0.5081
86 0.4386 0.8771 0.5614
87 0.4586 0.9171 0.5414
88 0.4087 0.8174 0.5913
89 0.3614 0.7229 0.6386
90 0.4227 0.8454 0.5773
91 0.4265 0.8531 0.5735
92 0.3922 0.7844 0.6078
93 0.4118 0.8236 0.5882
94 0.3546 0.7092 0.6454
95 0.4068 0.8136 0.5932
96 0.4164 0.8327 0.5836
97 0.3735 0.747 0.6265
98 0.3137 0.6275 0.6863
99 0.2584 0.5168 0.7416
100 0.2073 0.4145 0.7927
101 0.1616 0.3232 0.8384
102 0.5152 0.9695 0.4848
103 0.4978 0.9956 0.5022
104 0.4785 0.957 0.5215
105 0.4829 0.9658 0.5171
106 0.3929 0.7858 0.6071
107 0.3208 0.6416 0.6792
108 0.238 0.476 0.762
109 0.338 0.676 0.662
110 0.2417 0.4833 0.7583
111 0.1752 0.3504 0.8248
112 0.1089 0.2178 0.8911


Meta Analysis of Goldfeld-Quandt test for Heteroskedasticity
Description# significant tests% significant testsOK/NOK
1% type I error level0 0OK
5% type I error level00OK
10% type I error level00OK

\begin{tabular}{lllllllll}
\hline
Meta Analysis of Goldfeld-Quandt test for Heteroskedasticity \tabularnewline
Description & # significant tests & % significant tests & OK/NOK \tabularnewline
1% type I error level & 0 &  0 & OK \tabularnewline
5% type I error level & 0 & 0 & OK \tabularnewline
10% type I error level & 0 & 0 & OK \tabularnewline
\hline
\end{tabular}
%Source: https://freestatistics.org/blog/index.php?pk=285909&T=6

[TABLE]
[ROW][C]Meta Analysis of Goldfeld-Quandt test for Heteroskedasticity[/C][/ROW]
[ROW][C]Description[/C][C]# significant tests[/C][C]% significant tests[/C][C]OK/NOK[/C][/ROW]
[ROW][C]1% type I error level[/C][C]0[/C][C] 0[/C][C]OK[/C][/ROW]
[ROW][C]5% type I error level[/C][C]0[/C][C]0[/C][C]OK[/C][/ROW]
[ROW][C]10% type I error level[/C][C]0[/C][C]0[/C][C]OK[/C][/ROW]
[/TABLE]
Source: https://freestatistics.org/blog/index.php?pk=285909&T=6

Globally Unique Identifier (entire table): ba.freestatistics.org/blog/index.php?pk=285909&T=6

As an alternative you can also use a QR Code:  

The GUIDs for individual cells are displayed in the table below:

Meta Analysis of Goldfeld-Quandt test for Heteroskedasticity
Description# significant tests% significant testsOK/NOK
1% type I error level0 0OK
5% type I error level00OK
10% type I error level00OK


Parameters (Session):
par1 = 1 ; par2 = Do not include Seasonal Dummies ; par3 = No Linear Trend ;
Parameters (R input):
par1 = 1 ; par2 = Do not include Seasonal Dummies ; par3 = No Linear Trend ; par4 = ; par5 = ;
R code (references can be found in the software module):
library(lattice)
library(lmtest)
n25 <- 25 #minimum number of obs. for Goldfeld-Quandt test
mywarning <- ''
par1 <- as.numeric(par1)
if(is.na(par1)) {
par1 <- 1
mywarning = 'Warning: you did not specify the column number of the endogenous series! The first column was selected by default.'
}
if (par4=='') par4 <- 0
par4 <- as.numeric(par4)
if (par5=='') par5 <- 0
par5 <- as.numeric(par5)
x <- na.omit(t(y))
k <- length(x[1,])
n <- length(x[,1])
x1 <- cbind(x[,par1], x[,1:k!=par1])
mycolnames <- c(colnames(x)[par1], colnames(x)[1:k!=par1])
colnames(x1) <- mycolnames #colnames(x)[par1]
x <- x1
if (par3 == 'First Differences'){
(n <- n -1)
x2 <- array(0, dim=c(n,k), dimnames=list(1:n, paste('(1-B)',colnames(x),sep='')))
for (i in 1:n) {
for (j in 1:k) {
x2[i,j] <- x[i+1,j] - x[i,j]
}
}
x <- x2
}
if (par3 == 'Seasonal Differences (s=12)'){
(n <- n - 12)
x2 <- array(0, dim=c(n,k), dimnames=list(1:n, paste('(1-B12)',colnames(x),sep='')))
for (i in 1:n) {
for (j in 1:k) {
x2[i,j] <- x[i+12,j] - x[i,j]
}
}
x <- x2
}
if (par3 == 'First and Seasonal Differences (s=12)'){
(n <- n -1)
x2 <- array(0, dim=c(n,k), dimnames=list(1:n, paste('(1-B)',colnames(x),sep='')))
for (i in 1:n) {
for (j in 1:k) {
x2[i,j] <- x[i+1,j] - x[i,j]
}
}
x <- x2
(n <- n - 12)
x2 <- array(0, dim=c(n,k), dimnames=list(1:n, paste('(1-B12)',colnames(x),sep='')))
for (i in 1:n) {
for (j in 1:k) {
x2[i,j] <- x[i+12,j] - x[i,j]
}
}
x <- x2
}
if(par4 > 0) {
x2 <- array(0, dim=c(n-par4,par4), dimnames=list(1:(n-par4), paste(colnames(x)[par1],'(t-',1:par4,')',sep='')))
for (i in 1:(n-par4)) {
for (j in 1:par4) {
x2[i,j] <- x[i+par4-j,par1]
}
}
x <- cbind(x[(par4+1):n,], x2)
n <- n - par4
}
if(par5 > 0) {
x2 <- array(0, dim=c(n-par5*12,par5), dimnames=list(1:(n-par5*12), paste(colnames(x)[par1],'(t-',1:par5,'s)',sep='')))
for (i in 1:(n-par5*12)) {
for (j in 1:par5) {
x2[i,j] <- x[i+par5*12-j*12,par1]
}
}
x <- cbind(x[(par5*12+1):n,], x2)
n <- n - par5*12
}
if (par2 == 'Include Monthly Dummies'){
x2 <- array(0, dim=c(n,11), dimnames=list(1:n, paste('M', seq(1:11), sep ='')))
for (i in 1:11){
x2[seq(i,n,12),i] <- 1
}
x <- cbind(x, x2)
}
if (par2 == 'Include Quarterly Dummies'){
x2 <- array(0, dim=c(n,3), dimnames=list(1:n, paste('Q', seq(1:3), sep ='')))
for (i in 1:3){
x2[seq(i,n,4),i] <- 1
}
x <- cbind(x, x2)
}
(k <- length(x[n,]))
if (par3 == 'Linear Trend'){
x <- cbind(x, c(1:n))
colnames(x)[k+1] <- 't'
}
x
(k <- length(x[n,]))
head(x)
df <- as.data.frame(x)
(mylm <- lm(df))
(mysum <- summary(mylm))
if (n > n25) {
kp3 <- k + 3
nmkm3 <- n - k - 3
gqarr <- array(NA, dim=c(nmkm3-kp3+1,3))
numgqtests <- 0
numsignificant1 <- 0
numsignificant5 <- 0
numsignificant10 <- 0
for (mypoint in kp3:nmkm3) {
j <- 0
numgqtests <- numgqtests + 1
for (myalt in c('greater', 'two.sided', 'less')) {
j <- j + 1
gqarr[mypoint-kp3+1,j] <- gqtest(mylm, point=mypoint, alternative=myalt)$p.value
}
if (gqarr[mypoint-kp3+1,2] < 0.01) numsignificant1 <- numsignificant1 + 1
if (gqarr[mypoint-kp3+1,2] < 0.05) numsignificant5 <- numsignificant5 + 1
if (gqarr[mypoint-kp3+1,2] < 0.10) numsignificant10 <- numsignificant10 + 1
}
gqarr
}
bitmap(file='test0.png')
plot(x[,1], type='l', main='Actuals and Interpolation', ylab='value of Actuals and Interpolation (dots)', xlab='time or index')
points(x[,1]-mysum$resid)
grid()
dev.off()
bitmap(file='test1.png')
plot(mysum$resid, type='b', pch=19, main='Residuals', ylab='value of Residuals', xlab='time or index')
grid()
dev.off()
bitmap(file='test2.png')
hist(mysum$resid, main='Residual Histogram', xlab='values of Residuals')
grid()
dev.off()
bitmap(file='test3.png')
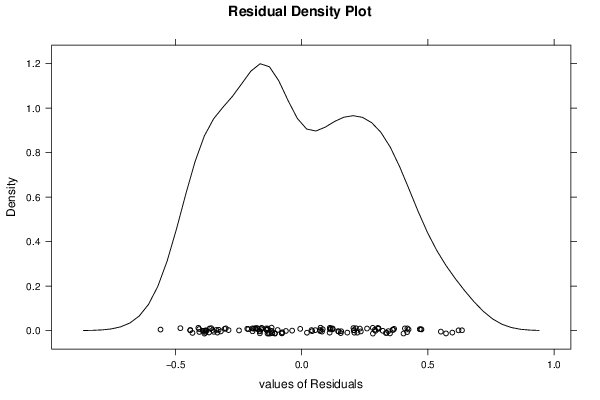
densityplot(~mysum$resid,col='black',main='Residual Density Plot', xlab='values of Residuals')
dev.off()
bitmap(file='test4.png')
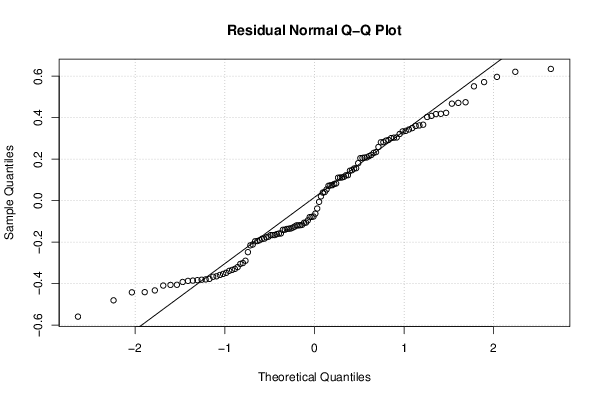
qqnorm(mysum$resid, main='Residual Normal Q-Q Plot')
qqline(mysum$resid)
grid()
dev.off()
(myerror <- as.ts(mysum$resid))
bitmap(file='test5.png')
dum <- cbind(lag(myerror,k=1),myerror)
dum
dum1 <- dum[2:length(myerror),]
dum1
z <- as.data.frame(dum1)
z
plot(z,main=paste('Residual Lag plot, lowess, and regression line'), ylab='values of Residuals', xlab='lagged values of Residuals')
lines(lowess(z))
abline(lm(z))
grid()
dev.off()
bitmap(file='test6.png')
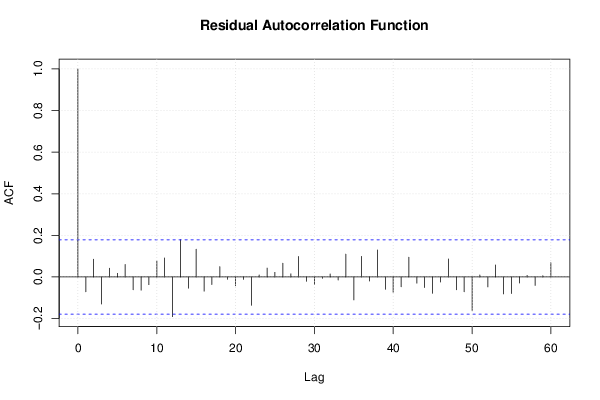
acf(mysum$resid, lag.max=length(mysum$resid)/2, main='Residual Autocorrelation Function')
grid()
dev.off()
bitmap(file='test7.png')
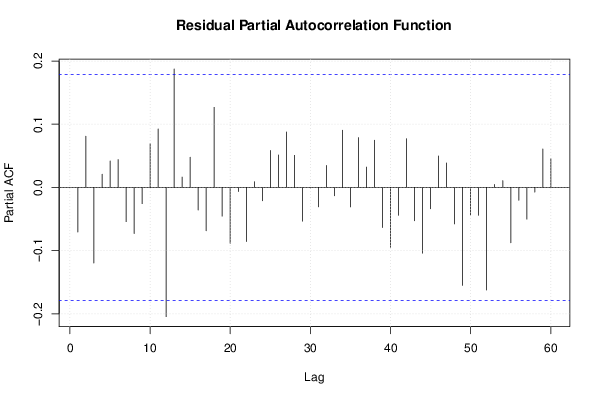
pacf(mysum$resid, lag.max=length(mysum$resid)/2, main='Residual Partial Autocorrelation Function')
grid()
dev.off()
bitmap(file='test8.png')
opar <- par(mfrow = c(2,2), oma = c(0, 0, 1.1, 0))
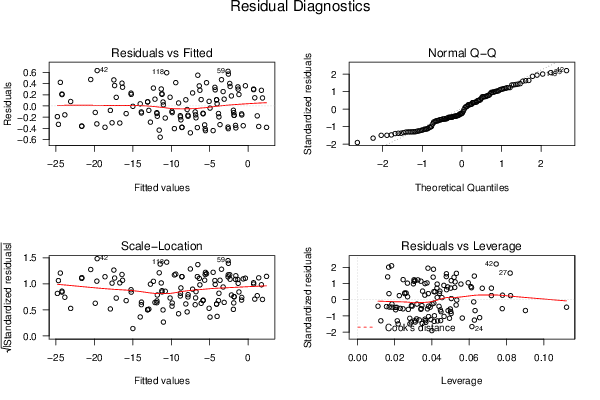
plot(mylm, las = 1, sub='Residual Diagnostics')
par(opar)
dev.off()
if (n > n25) {
bitmap(file='test9.png')
plot(kp3:nmkm3,gqarr[,2], main='Goldfeld-Quandt test',ylab='2-sided p-value',xlab='breakpoint')
grid()
dev.off()
}
load(file='createtable')
a<-table.start()
a<-table.row.start(a)
a<-table.element(a, 'Multiple Linear Regression - Estimated Regression Equation', 1, TRUE)
a<-table.row.end(a)
myeq <- colnames(x)[1]
myeq <- paste(myeq, '[t] = ', sep='')
for (i in 1:k){
if (mysum$coefficients[i,1] > 0) myeq <- paste(myeq, '+', '')
myeq <- paste(myeq, signif(mysum$coefficients[i,1],6), sep=' ')
if (rownames(mysum$coefficients)[i] != '(Intercept)') {
myeq <- paste(myeq, rownames(mysum$coefficients)[i], sep='')
if (rownames(mysum$coefficients)[i] != 't') myeq <- paste(myeq, '[t]', sep='')
}
}
myeq <- paste(myeq, ' + e[t]')
a<-table.row.start(a)
a<-table.element(a, myeq)
a<-table.row.end(a)
a<-table.row.start(a)
a<-table.element(a, mywarning)
a<-table.row.end(a)
a<-table.end(a)
table.save(a,file='mytable1.tab')
a<-table.start()
a<-table.row.start(a)
a<-table.element(a,hyperlink('ols1.htm','Multiple Linear Regression - Ordinary Least Squares',''), 6, TRUE)
a<-table.row.end(a)
a<-table.row.start(a)
a<-table.element(a,'Variable',header=TRUE)
a<-table.element(a,'Parameter',header=TRUE)
a<-table.element(a,'S.D.',header=TRUE)
a<-table.element(a,'T-STAT
H0: parameter = 0',header=TRUE)
a<-table.element(a,'2-tail p-value',header=TRUE)
a<-table.element(a,'1-tail p-value',header=TRUE)
a<-table.row.end(a)
for (i in 1:k){
a<-table.row.start(a)
a<-table.element(a,rownames(mysum$coefficients)[i],header=TRUE)
a<-table.element(a,formatC(signif(mysum$coefficients[i,1],5),format='g',flag='+'))
a<-table.element(a,formatC(signif(mysum$coefficients[i,2],5),format='g',flag=' '))
a<-table.element(a,formatC(signif(mysum$coefficients[i,3],4),format='e',flag='+'))
a<-table.element(a,formatC(signif(mysum$coefficients[i,4],4),format='g',flag=' '))
a<-table.element(a,formatC(signif(mysum$coefficients[i,4]/2,4),format='g',flag=' '))
a<-table.row.end(a)
}
a<-table.end(a)
table.save(a,file='mytable2.tab')
a<-table.start()
a<-table.row.start(a)
a<-table.element(a, 'Multiple Linear Regression - Regression Statistics', 2, TRUE)
a<-table.row.end(a)
a<-table.row.start(a)
a<-table.element(a, 'Multiple R',1,TRUE)
a<-table.element(a,formatC(signif(sqrt(mysum$r.squared),6),format='g',flag=' '))
a<-table.row.end(a)
a<-table.row.start(a)
a<-table.element(a, 'R-squared',1,TRUE)
a<-table.element(a,formatC(signif(mysum$r.squared,6),format='g',flag=' '))
a<-table.row.end(a)
a<-table.row.start(a)
a<-table.element(a, 'Adjusted R-squared',1,TRUE)
a<-table.element(a,formatC(signif(mysum$adj.r.squared,6),format='g',flag=' '))
a<-table.row.end(a)
a<-table.row.start(a)
a<-table.element(a, 'F-TEST (value)',1,TRUE)
a<-table.element(a,formatC(signif(mysum$fstatistic[1],6),format='g',flag=' '))
a<-table.row.end(a)
a<-table.row.start(a)
a<-table.element(a, 'F-TEST (DF numerator)',1,TRUE)
a<-table.element(a, signif(mysum$fstatistic[2],6))
a<-table.row.end(a)
a<-table.row.start(a)
a<-table.element(a, 'F-TEST (DF denominator)',1,TRUE)
a<-table.element(a, signif(mysum$fstatistic[3],6))
a<-table.row.end(a)
a<-table.row.start(a)
a<-table.element(a, 'p-value',1,TRUE)
a<-table.element(a,formatC(signif(1-pf(mysum$fstatistic[1],mysum$fstatistic[2],mysum$fstatistic[3]),6),format='g',flag=' '))
a<-table.row.end(a)
a<-table.row.start(a)
a<-table.element(a, 'Multiple Linear Regression - Residual Statistics', 2, TRUE)
a<-table.row.end(a)
a<-table.row.start(a)
a<-table.element(a, 'Residual Standard Deviation',1,TRUE)
a<-table.element(a,formatC(signif(mysum$sigma,6),format='g',flag=' '))
a<-table.row.end(a)
a<-table.row.start(a)
a<-table.element(a, 'Sum Squared Residuals',1,TRUE)
a<-table.element(a,formatC(signif(sum(myerror*myerror),6),format='g',flag=' '))
a<-table.row.end(a)
a<-table.end(a)
table.save(a,file='mytable3.tab')
if(n < 200) {
a<-table.start()
a<-table.row.start(a)
a<-table.element(a, 'Multiple Linear Regression - Actuals, Interpolation, and Residuals', 4, TRUE)
a<-table.row.end(a)
a<-table.row.start(a)
a<-table.element(a, 'Time or Index', 1, TRUE)
a<-table.element(a, 'Actuals', 1, TRUE)
a<-table.element(a, 'Interpolation
Forecast', 1, TRUE)
a<-table.element(a, 'Residuals
Prediction Error', 1, TRUE)
a<-table.row.end(a)
for (i in 1:n) {
a<-table.row.start(a)
a<-table.element(a,i, 1, TRUE)
a<-table.element(a,formatC(signif(x[i],6),format='g',flag=' '))
a<-table.element(a,formatC(signif(x[i]-mysum$resid[i],6),format='g',flag=' '))
a<-table.element(a,formatC(signif(mysum$resid[i],6),format='g',flag=' '))
a<-table.row.end(a)
}
a<-table.end(a)
table.save(a,file='mytable4.tab')
if (n > n25) {
a<-table.start()
a<-table.row.start(a)
a<-table.element(a,'Goldfeld-Quandt test for Heteroskedasticity',4,TRUE)
a<-table.row.end(a)
a<-table.row.start(a)
a<-table.element(a,'p-values',header=TRUE)
a<-table.element(a,'Alternative Hypothesis',3,header=TRUE)
a<-table.row.end(a)
a<-table.row.start(a)
a<-table.element(a,'breakpoint index',header=TRUE)
a<-table.element(a,'greater',header=TRUE)
a<-table.element(a,'2-sided',header=TRUE)
a<-table.element(a,'less',header=TRUE)
a<-table.row.end(a)
for (mypoint in kp3:nmkm3) {
a<-table.row.start(a)
a<-table.element(a,mypoint,header=TRUE)
a<-table.element(a,formatC(signif(gqarr[mypoint-kp3+1,1],6),format='g',flag=' '))
a<-table.element(a,formatC(signif(gqarr[mypoint-kp3+1,2],6),format='g',flag=' '))
a<-table.element(a,formatC(signif(gqarr[mypoint-kp3+1,3],6),format='g',flag=' '))
a<-table.row.end(a)
}
a<-table.end(a)
table.save(a,file='mytable5.tab')
a<-table.start()
a<-table.row.start(a)
a<-table.element(a,'Meta Analysis of Goldfeld-Quandt test for Heteroskedasticity',4,TRUE)
a<-table.row.end(a)
a<-table.row.start(a)
a<-table.element(a,'Description',header=TRUE)
a<-table.element(a,'# significant tests',header=TRUE)
a<-table.element(a,'% significant tests',header=TRUE)
a<-table.element(a,'OK/NOK',header=TRUE)
a<-table.row.end(a)
a<-table.row.start(a)
a<-table.element(a,'1% type I error level',header=TRUE)
a<-table.element(a,signif(numsignificant1,6))
a<-table.element(a,formatC(signif(numsignificant1/numgqtests,6),format='g',flag=' '))
if (numsignificant1/numgqtests < 0.01) dum <- 'OK' else dum <- 'NOK'
a<-table.element(a,dum)
a<-table.row.end(a)
a<-table.row.start(a)
a<-table.element(a,'5% type I error level',header=TRUE)
a<-table.element(a,signif(numsignificant5,6))
a<-table.element(a,signif(numsignificant5/numgqtests,6))
if (numsignificant5/numgqtests < 0.05) dum <- 'OK' else dum <- 'NOK'
a<-table.element(a,dum)
a<-table.row.end(a)
a<-table.row.start(a)
a<-table.element(a,'10% type I error level',header=TRUE)
a<-table.element(a,signif(numsignificant10,6))
a<-table.element(a,signif(numsignificant10/numgqtests,6))
if (numsignificant10/numgqtests < 0.1) dum <- 'OK' else dum <- 'NOK'
a<-table.element(a,dum)
a<-table.row.end(a)
a<-table.end(a)
table.save(a,file='mytable6.tab')
}
}