Free Statistics

of Irreproducible Research!

Author's title

Author*The author of this computation has been verified*
R Software Modulerwasp_autocorrelation.wasp
Title produced by software(Partial) Autocorrelation Function
Date of computationMon, 14 Dec 2015 22:46:34 +0000
Cite this page as followsStatistical Computations at FreeStatistics.org, Office for Research Development and Education, URL https://freestatistics.org/blog/index.php?v=date/2015/Dec/14/t1450133242w6ltgukgsqdyed2.htm/, Retrieved Thu, 31 Oct 2024 23:04:18 +0000
Statistical Computations at FreeStatistics.org, Office for Research Development and Education, URL https://freestatistics.org/blog/index.php?pk=286421, Retrieved Thu, 31 Oct 2024 23:04:18 +0000
QR Codes:

Original text written by user:
IsPrivate?No (this computation is public)
User-defined keywords
Estimated Impact89
Family? (F = Feedback message, R = changed R code, M = changed R Module, P = changed Parameters, D = changed Data)
-       [(Partial) Autocorrelation Function] [paper35] [2015-12-14 22:46:34] [1e67203134127d491eaf7d256835640d] [Current]
Feedback Forum

Post a new message
Dataseries X:
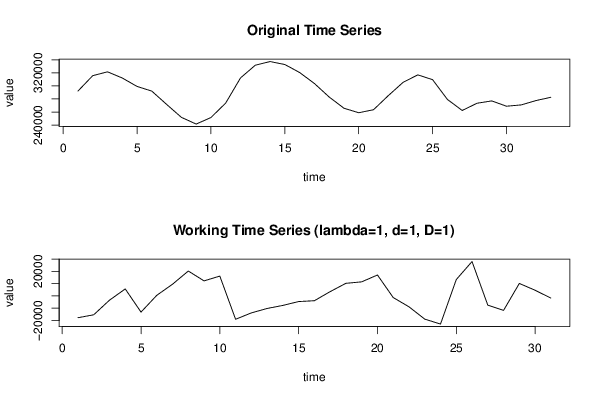
292068
315646
321514
312051
299146
291957
271628
251801
241526
251527
273778
312201
331634
337268
332714
320463
303648
282945
265768
258868
263434
285052
305363
316846
309483
279245
262323
273396
276992
268843
270875
277550
282518


Summary of computational transaction
Raw Inputview raw input (R code)
Raw Outputview raw output of R engine
Computing time2 seconds
R Server'Gertrude Mary Cox' @ cox.wessa.net

\begin{tabular}{lllllllll}
\hline
Summary of computational transaction \tabularnewline
Raw Input & view raw input (R code)  \tabularnewline
Raw Output & view raw output of R engine  \tabularnewline
Computing time & 2 seconds \tabularnewline
R Server & 'Gertrude Mary Cox' @ cox.wessa.net \tabularnewline
\hline
\end{tabular}
%Source: https://freestatistics.org/blog/index.php?pk=286421&T=0

[TABLE]
[ROW][C]Summary of computational transaction[/C][/ROW]
[ROW][C]Raw Input[/C][C]view raw input (R code) [/C][/ROW]
[ROW][C]Raw Output[/C][C]view raw output of R engine [/C][/ROW]
[ROW][C]Computing time[/C][C]2 seconds[/C][/ROW]
[ROW][C]R Server[/C][C]'Gertrude Mary Cox' @ cox.wessa.net[/C][/ROW]
[/TABLE]
Source: https://freestatistics.org/blog/index.php?pk=286421&T=0

Globally Unique Identifier (entire table): ba.freestatistics.org/blog/index.php?pk=286421&T=0

As an alternative you can also use a QR Code:  

The GUIDs for individual cells are displayed in the table below:

Summary of computational transaction
Raw Inputview raw input (R code)
Raw Outputview raw output of R engine
Computing time2 seconds
R Server'Gertrude Mary Cox' @ cox.wessa.net


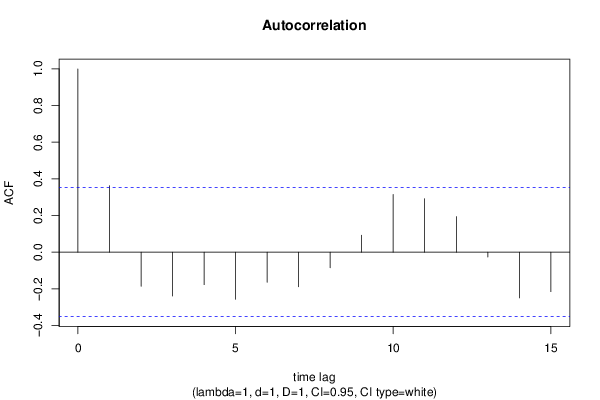
Autocorrelation Function
Time lag kACF(k)T-STATP-value
10.3622592.0170.026215
2-0.186443-1.03810.153633
3-0.239563-1.33380.095989
4-0.177242-0.98680.16568
5-0.256755-1.42950.081424
6-0.164435-0.91550.183489
7-0.188999-1.05230.150397
8-0.085577-0.47650.318539
90.0923910.51440.305307
100.3147751.75260.044779
110.2916161.62360.057289
120.1939311.07980.144288
13-0.026203-0.14590.442476
14-0.249693-1.39020.08718
15-0.215473-1.19970.119672

\begin{tabular}{lllllllll}
\hline
Autocorrelation Function \tabularnewline
Time lag k & ACF(k) & T-STAT & P-value \tabularnewline
1 & 0.362259 & 2.017 & 0.026215 \tabularnewline
2 & -0.186443 & -1.0381 & 0.153633 \tabularnewline
3 & -0.239563 & -1.3338 & 0.095989 \tabularnewline
4 & -0.177242 & -0.9868 & 0.16568 \tabularnewline
5 & -0.256755 & -1.4295 & 0.081424 \tabularnewline
6 & -0.164435 & -0.9155 & 0.183489 \tabularnewline
7 & -0.188999 & -1.0523 & 0.150397 \tabularnewline
8 & -0.085577 & -0.4765 & 0.318539 \tabularnewline
9 & 0.092391 & 0.5144 & 0.305307 \tabularnewline
10 & 0.314775 & 1.7526 & 0.044779 \tabularnewline
11 & 0.291616 & 1.6236 & 0.057289 \tabularnewline
12 & 0.193931 & 1.0798 & 0.144288 \tabularnewline
13 & -0.026203 & -0.1459 & 0.442476 \tabularnewline
14 & -0.249693 & -1.3902 & 0.08718 \tabularnewline
15 & -0.215473 & -1.1997 & 0.119672 \tabularnewline
\hline
\end{tabular}
%Source: https://freestatistics.org/blog/index.php?pk=286421&T=1

[TABLE]
[ROW][C]Autocorrelation Function[/C][/ROW]
[ROW][C]Time lag k[/C][C]ACF(k)[/C][C]T-STAT[/C][C]P-value[/C][/ROW]
[ROW][C]1[/C][C]0.362259[/C][C]2.017[/C][C]0.026215[/C][/ROW]
[ROW][C]2[/C][C]-0.186443[/C][C]-1.0381[/C][C]0.153633[/C][/ROW]
[ROW][C]3[/C][C]-0.239563[/C][C]-1.3338[/C][C]0.095989[/C][/ROW]
[ROW][C]4[/C][C]-0.177242[/C][C]-0.9868[/C][C]0.16568[/C][/ROW]
[ROW][C]5[/C][C]-0.256755[/C][C]-1.4295[/C][C]0.081424[/C][/ROW]
[ROW][C]6[/C][C]-0.164435[/C][C]-0.9155[/C][C]0.183489[/C][/ROW]
[ROW][C]7[/C][C]-0.188999[/C][C]-1.0523[/C][C]0.150397[/C][/ROW]
[ROW][C]8[/C][C]-0.085577[/C][C]-0.4765[/C][C]0.318539[/C][/ROW]
[ROW][C]9[/C][C]0.092391[/C][C]0.5144[/C][C]0.305307[/C][/ROW]
[ROW][C]10[/C][C]0.314775[/C][C]1.7526[/C][C]0.044779[/C][/ROW]
[ROW][C]11[/C][C]0.291616[/C][C]1.6236[/C][C]0.057289[/C][/ROW]
[ROW][C]12[/C][C]0.193931[/C][C]1.0798[/C][C]0.144288[/C][/ROW]
[ROW][C]13[/C][C]-0.026203[/C][C]-0.1459[/C][C]0.442476[/C][/ROW]
[ROW][C]14[/C][C]-0.249693[/C][C]-1.3902[/C][C]0.08718[/C][/ROW]
[ROW][C]15[/C][C]-0.215473[/C][C]-1.1997[/C][C]0.119672[/C][/ROW]
[/TABLE]
Source: https://freestatistics.org/blog/index.php?pk=286421&T=1

Globally Unique Identifier (entire table): ba.freestatistics.org/blog/index.php?pk=286421&T=1

As an alternative you can also use a QR Code:  

The GUIDs for individual cells are displayed in the table below:

Autocorrelation Function
Time lag kACF(k)T-STATP-value
10.3622592.0170.026215
2-0.186443-1.03810.153633
3-0.239563-1.33380.095989
4-0.177242-0.98680.16568
5-0.256755-1.42950.081424
6-0.164435-0.91550.183489
7-0.188999-1.05230.150397
8-0.085577-0.47650.318539
90.0923910.51440.305307
100.3147751.75260.044779
110.2916161.62360.057289
120.1939311.07980.144288
13-0.026203-0.14590.442476
14-0.249693-1.39020.08718
15-0.215473-1.19970.119672


Partial Autocorrelation Function
Time lag kPACF(k)T-STATP-value
10.3622592.0170.026215
2-0.365661-2.03590.025191
3-0.019746-0.10990.456582
4-0.15905-0.88560.191338
5-0.274563-1.52870.06824
6-0.059393-0.33070.371553
7-0.397485-2.21310.017192
8-0.101386-0.56450.28824
9-0.174204-0.96990.169795
100.0682730.38010.353221
110.0040960.02280.490976
120.0766570.42680.336234
13-0.047782-0.2660.395985
14-0.212755-1.18460.122596
150.0675570.37610.354687

\begin{tabular}{lllllllll}
\hline
Partial Autocorrelation Function \tabularnewline
Time lag k & PACF(k) & T-STAT & P-value \tabularnewline
1 & 0.362259 & 2.017 & 0.026215 \tabularnewline
2 & -0.365661 & -2.0359 & 0.025191 \tabularnewline
3 & -0.019746 & -0.1099 & 0.456582 \tabularnewline
4 & -0.15905 & -0.8856 & 0.191338 \tabularnewline
5 & -0.274563 & -1.5287 & 0.06824 \tabularnewline
6 & -0.059393 & -0.3307 & 0.371553 \tabularnewline
7 & -0.397485 & -2.2131 & 0.017192 \tabularnewline
8 & -0.101386 & -0.5645 & 0.28824 \tabularnewline
9 & -0.174204 & -0.9699 & 0.169795 \tabularnewline
10 & 0.068273 & 0.3801 & 0.353221 \tabularnewline
11 & 0.004096 & 0.0228 & 0.490976 \tabularnewline
12 & 0.076657 & 0.4268 & 0.336234 \tabularnewline
13 & -0.047782 & -0.266 & 0.395985 \tabularnewline
14 & -0.212755 & -1.1846 & 0.122596 \tabularnewline
15 & 0.067557 & 0.3761 & 0.354687 \tabularnewline
\hline
\end{tabular}
%Source: https://freestatistics.org/blog/index.php?pk=286421&T=2

[TABLE]
[ROW][C]Partial Autocorrelation Function[/C][/ROW]
[ROW][C]Time lag k[/C][C]PACF(k)[/C][C]T-STAT[/C][C]P-value[/C][/ROW]
[ROW][C]1[/C][C]0.362259[/C][C]2.017[/C][C]0.026215[/C][/ROW]
[ROW][C]2[/C][C]-0.365661[/C][C]-2.0359[/C][C]0.025191[/C][/ROW]
[ROW][C]3[/C][C]-0.019746[/C][C]-0.1099[/C][C]0.456582[/C][/ROW]
[ROW][C]4[/C][C]-0.15905[/C][C]-0.8856[/C][C]0.191338[/C][/ROW]
[ROW][C]5[/C][C]-0.274563[/C][C]-1.5287[/C][C]0.06824[/C][/ROW]
[ROW][C]6[/C][C]-0.059393[/C][C]-0.3307[/C][C]0.371553[/C][/ROW]
[ROW][C]7[/C][C]-0.397485[/C][C]-2.2131[/C][C]0.017192[/C][/ROW]
[ROW][C]8[/C][C]-0.101386[/C][C]-0.5645[/C][C]0.28824[/C][/ROW]
[ROW][C]9[/C][C]-0.174204[/C][C]-0.9699[/C][C]0.169795[/C][/ROW]
[ROW][C]10[/C][C]0.068273[/C][C]0.3801[/C][C]0.353221[/C][/ROW]
[ROW][C]11[/C][C]0.004096[/C][C]0.0228[/C][C]0.490976[/C][/ROW]
[ROW][C]12[/C][C]0.076657[/C][C]0.4268[/C][C]0.336234[/C][/ROW]
[ROW][C]13[/C][C]-0.047782[/C][C]-0.266[/C][C]0.395985[/C][/ROW]
[ROW][C]14[/C][C]-0.212755[/C][C]-1.1846[/C][C]0.122596[/C][/ROW]
[ROW][C]15[/C][C]0.067557[/C][C]0.3761[/C][C]0.354687[/C][/ROW]
[/TABLE]
Source: https://freestatistics.org/blog/index.php?pk=286421&T=2

Globally Unique Identifier (entire table): ba.freestatistics.org/blog/index.php?pk=286421&T=2

As an alternative you can also use a QR Code:  

The GUIDs for individual cells are displayed in the table below:

Partial Autocorrelation Function
Time lag kPACF(k)T-STATP-value
10.3622592.0170.026215
2-0.365661-2.03590.025191
3-0.019746-0.10990.456582
4-0.15905-0.88560.191338
5-0.274563-1.52870.06824
6-0.059393-0.33070.371553
7-0.397485-2.21310.017192
8-0.101386-0.56450.28824
9-0.174204-0.96990.169795
100.0682730.38010.353221
110.0040960.02280.490976
120.0766570.42680.336234
13-0.047782-0.2660.395985
14-0.212755-1.18460.122596
150.0675570.37610.354687


Parameters (Session):
Parameters (R input):
par1 = Default ; par2 = 1 ; par3 = 1 ; par4 = 1 ; par5 = 1 ; par6 = White Noise ; par7 = 0.95 ; par8 = ;
R code (references can be found in the software module):
if (par1 == 'Default') {
par1 = 10*log10(length(x))
} else {
par1 <- as.numeric(par1)
}
par2 <- as.numeric(par2)
par3 <- as.numeric(par3)
par4 <- as.numeric(par4)
par5 <- as.numeric(par5)
if (par6 == 'White Noise') par6 <- 'white' else par6 <- 'ma'
par7 <- as.numeric(par7)
if (par8 != '') par8 <- as.numeric(par8)
x <- na.omit(x)
ox <- x
if (par8 == '') {
if (par2 == 0) {
x <- log(x)
} else {
x <- (x ^ par2 - 1) / par2
}
} else {
x <- log(x,base=par8)
}
if (par3 > 0) x <- diff(x,lag=1,difference=par3)
if (par4 > 0) x <- diff(x,lag=par5,difference=par4)
bitmap(file='picts.png')
op <- par(mfrow=c(2,1))
plot(ox,type='l',main='Original Time Series',xlab='time',ylab='value')
if (par8=='') {
mytitle <- paste('Working Time Series (lambda=',par2,', d=',par3,', D=',par4,')',sep='')
mysub <- paste('(lambda=',par2,', d=',par3,', D=',par4,', CI=', par7, ', CI type=',par6,')',sep='')
} else {
mytitle <- paste('Working Time Series (base=',par8,', d=',par3,', D=',par4,')',sep='')
mysub <- paste('(base=',par8,', d=',par3,', D=',par4,', CI=', par7, ', CI type=',par6,')',sep='')
}
plot(x,type='l', main=mytitle,xlab='time',ylab='value')
par(op)
dev.off()
bitmap(file='pic1.png')
racf <- acf(x, par1, main='Autocorrelation', xlab='time lag', ylab='ACF', ci.type=par6, ci=par7, sub=mysub)
dev.off()
bitmap(file='pic2.png')
rpacf <- pacf(x,par1,main='Partial Autocorrelation',xlab='lags',ylab='PACF',sub=mysub)
dev.off()
(myacf <- c(racf$acf))
(mypacf <- c(rpacf$acf))
lengthx <- length(x)
sqrtn <- sqrt(lengthx)
load(file='createtable')
a<-table.start()
a<-table.row.start(a)
a<-table.element(a,'Autocorrelation Function',4,TRUE)
a<-table.row.end(a)
a<-table.row.start(a)
a<-table.element(a,'Time lag k',header=TRUE)
a<-table.element(a,hyperlink('basics.htm','ACF(k)','click here for more information about the Autocorrelation Function'),header=TRUE)
a<-table.element(a,'T-STAT',header=TRUE)
a<-table.element(a,'P-value',header=TRUE)
a<-table.row.end(a)
for (i in 2:(par1+1)) {
a<-table.row.start(a)
a<-table.element(a,i-1,header=TRUE)
a<-table.element(a,round(myacf[i],6))
mytstat <- myacf[i]*sqrtn
a<-table.element(a,round(mytstat,4))
a<-table.element(a,round(1-pt(abs(mytstat),lengthx),6))
a<-table.row.end(a)
}
a<-table.end(a)
table.save(a,file='mytable.tab')
a<-table.start()
a<-table.row.start(a)
a<-table.element(a,'Partial Autocorrelation Function',4,TRUE)
a<-table.row.end(a)
a<-table.row.start(a)
a<-table.element(a,'Time lag k',header=TRUE)
a<-table.element(a,hyperlink('basics.htm','PACF(k)','click here for more information about the Partial Autocorrelation Function'),header=TRUE)
a<-table.element(a,'T-STAT',header=TRUE)
a<-table.element(a,'P-value',header=TRUE)
a<-table.row.end(a)
for (i in 1:par1) {
a<-table.row.start(a)
a<-table.element(a,i,header=TRUE)
a<-table.element(a,round(mypacf[i],6))
mytstat <- mypacf[i]*sqrtn
a<-table.element(a,round(mytstat,4))
a<-table.element(a,round(1-pt(abs(mytstat),lengthx),6))
a<-table.row.end(a)
}
a<-table.end(a)
table.save(a,file='mytable1.tab')