Free Statistics

of Irreproducible Research!

Author's title

Author*The author of this computation has been verified*
R Software Modulerwasp_autocorrelation.wasp
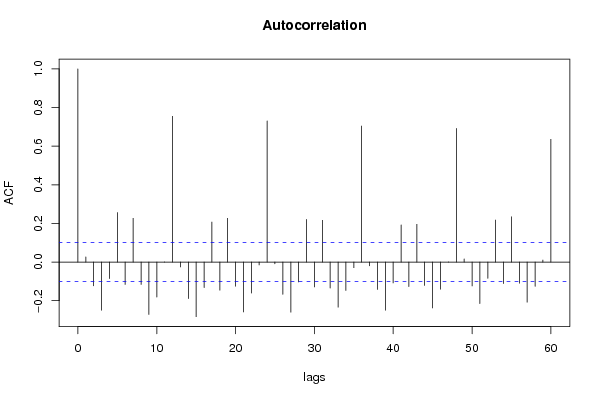
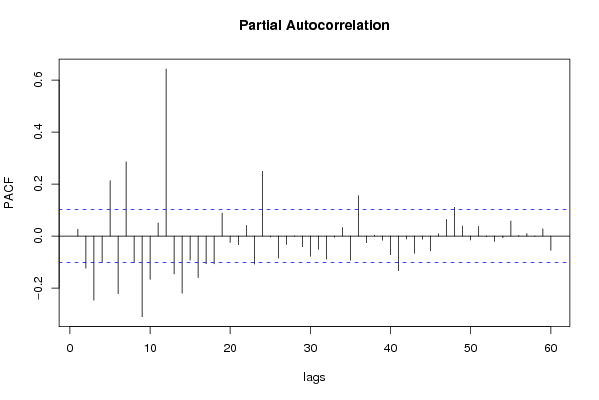
Title produced by software(Partial) Autocorrelation Function
Date of computationMon, 08 Dec 2008 13:01:47 -0700
Cite this page as followsStatistical Computations at FreeStatistics.org, Office for Research Development and Education, URL https://freestatistics.org/blog/index.php?v=date/2008/Dec/08/t12287665668wxu6qbphu7o9df.htm/, Retrieved Thu, 31 Oct 2024 22:54:16 +0000
Statistical Computations at FreeStatistics.org, Office for Research Development and Education, URL https://freestatistics.org/blog/index.php?pk=30894, Retrieved Thu, 31 Oct 2024 22:54:16 +0000
QR Codes:

Original text written by user:
IsPrivate?No (this computation is public)
User-defined keywords
Estimated Impact164
Family? (F = Feedback message, R = changed R code, M = changed R Module, P = changed Parameters, D = changed Data)
-     [Univariate Data Series] [data set] [2008-12-01 19:54:57] [b98453cac15ba1066b407e146608df68]
-   P   [Univariate Data Series] [marlies.polfliet_...] [2008-12-08 19:50:28] [fdc296cbeb5d8064cb0dbd634c3fdc55]
F RMP     [(Partial) Autocorrelation Function] [marlies.polfliet_...] [2008-12-08 19:59:34] [fdc296cbeb5d8064cb0dbd634c3fdc55]
-   P         [(Partial) Autocorrelation Function] [marlies.polfliet_...] [2008-12-08 20:01:47] [e221948dd14811c7d88a6530ac2a8702] [Current]
Feedback Forum

Post a new message
Dataseries X:
235.1
280.7
264.6
240.7
201.4
240.8
241.1
223.8
206.1
174.7
203.3
220.5
299.5
347.4
338.3
327.7
351.6
396.6
438.8
395.6
363.5
378.8
357
369
464.8
479.1
431.3
366.5
326.3
355.1
331.6
261.3
249
205.5
235.6
240.9
264.9
253.8
232.3
193.8
177
213.2
207.2
180.6
188.6
175.4
199
179.6
225.8
234
200.2
183.6
178.2
203.2
208.5
191.8
172.8
148
159.4
154.5
213.2
196.4
182.8
176.4
153.6
173.2
171
151.2
161.9
157.2
201.7
236.4
356.1
398.3
403.7
384.6
365.8
368.1
367.9
347
343.3
292.9
311.5
300.9
366.9
356.9
329.7
316.2
269
289.3
266.2
253.6
233.8
228.4
253.6
260.1
306.6
309.2
309.5
271
279.9
317.9
298.4
246.7
227.3
209.1
259.9
266
320.6
308.5
282.2
262.7
263.5
313.1
284.3
252.6
250.3
246.5
312.7
333.2
446.4
511.6
515.5
506.4
483.2
522.3
509.8
460.7
405.8
375
378.5
406.8
467.8
469.8
429.8
355.8
332.7
378
360.5
334.7
319.5
323.1
363.6
352.1
411.9
388.6
416.4
360.7
338
417.2
388.4
371.1
331.5
353.7
396.7
447
533.5
565.4
542.3
488.7
467.1
531.3
496.1
444
403.4
386.3
394.1
404.1
462.1
448.1
432.3
386.3
395.2
421.9
382.9
384.2
345.5
323.4
372.6
376
462.7
487
444.2
399.3
394.9
455.4
414
375.5
347
339.4
385.8
378.8
451.8
446.1
422.5
383.1
352.8
445.3
367.5
355.1
326.2
319.8
331.8
340.9
394.1
417.2
369.9
349.2
321.4
405.7
342.9
316.5
284.2
270.9
288.8
278.8
324.4
310.9
299
273
279.3
359.2
305
282.1
250.3
246.5
257.9
266.5
315.9
318.4
295.4
266.4
245.8
362.8
324.9
294.2
289.5
295.2
290.3
272
307.4
328.7
292.9
249.1
230.4
361.5
321.7
277.2
260.7
251
257.6
241.8
287.5
292.3
274.7
254.2
230
339
318.2
287
295.8
284
271
262.7
340.6
379.4
373.3
355.2
338.4
466.9
451
422
429.2
425.9
460.7
463.6
541.4
544.2
517.5
469.4
439.4
549
533
506.1
484
457
481.5
469.5
544.7
541.2
521.5
469.7
434.4
542.6
517.3
485.7
465.8
447
426.6
411.6
467.5
484.5
451.2
417.4
379.9
484.7
455
420.8
416.5
376.3
405.6
405.8
500.8
514
475.5
430.1
414.4
538
526
488.5
520.2
504.4
568.5
610.6
818
830.9
835.9
782
762.3
856.9
820.9
769.6
752.2
724.4
723.1
719.5
817.4
803.3
752.5
689
630.4
765.5
757.7
732.2
702.6
683.3
709.5
702.2
784.8
810.9
755.6
656.8
615.1
745.3
694.1
675.7
643.7
622.1
634.6
588
689.7
673.9
647.9
568.8
545.7
632.6
643.8
593.1
579.7
546
562.9
572.5


Summary of computational transaction
Raw Inputview raw input (R code)
Raw Outputview raw output of R engine
Computing time1 seconds
R Server'Gwilym Jenkins' @ 72.249.127.135

\begin{tabular}{lllllllll}
\hline
Summary of computational transaction \tabularnewline
Raw Input & view raw input (R code)  \tabularnewline
Raw Output & view raw output of R engine  \tabularnewline
Computing time & 1 seconds \tabularnewline
R Server & 'Gwilym Jenkins' @ 72.249.127.135 \tabularnewline
\hline
\end{tabular}
%Source: https://freestatistics.org/blog/index.php?pk=30894&T=0

[TABLE]
[ROW][C]Summary of computational transaction[/C][/ROW]
[ROW][C]Raw Input[/C][C]view raw input (R code) [/C][/ROW]
[ROW][C]Raw Output[/C][C]view raw output of R engine [/C][/ROW]
[ROW][C]Computing time[/C][C]1 seconds[/C][/ROW]
[ROW][C]R Server[/C][C]'Gwilym Jenkins' @ 72.249.127.135[/C][/ROW]
[/TABLE]
Source: https://freestatistics.org/blog/index.php?pk=30894&T=0

Globally Unique Identifier (entire table): ba.freestatistics.org/blog/index.php?pk=30894&T=0

As an alternative you can also use a QR Code:  

The GUIDs for individual cells are displayed in the table below:

Summary of computational transaction
Raw Inputview raw input (R code)
Raw Outputview raw output of R engine
Computing time1 seconds
R Server'Gwilym Jenkins' @ 72.249.127.135


Autocorrelation Function
Time lag kACF(k)T-STATP-value
10.0264640.50970.305269
2-0.122833-2.36590.009249
3-0.249309-4.8021e-06
4-0.085224-1.64150.050768
50.2565684.94181e-06
6-0.116159-2.23740.012927
70.2264694.36218e-06
8-0.116239-2.23890.012876
9-0.271329-5.22620
10-0.18144-3.49480.000266
110.0005860.01130.495499
120.75485114.53950
13-0.025287-0.48710.31325
14-0.18926-3.64540.000153
15-0.282736-5.44590
16-0.132037-2.54320.005695
170.2071413.98984e-05
18-0.145504-2.80260.002668
190.2264484.36178e-06
20-0.124894-2.40560.008316
21-0.258167-4.97261e-06
22-0.160552-3.09250.001068
23-0.014959-0.28810.386704
240.73081414.07650
25-0.00928-0.17870.429121
26-0.166822-3.21320.000714
27-0.259834-5.00480
28-0.10315-1.98680.023839
290.2205164.24741.4e-05
30-0.128622-2.47740.006839
310.2158424.15742e-05
32-0.134543-2.59150.004967
33-0.233937-4.50594e-06
34-0.146838-2.82830.002467
35-0.029465-0.56750.285347
360.70407313.56140
37-0.019656-0.37860.352603
38-0.141752-2.73030.003314
39-0.249213-4.80021e-06
40-0.108265-2.08530.018861
410.1923123.70420.000122
42-0.126959-2.44540.007467
430.1951873.75969.9e-05
44-0.121145-2.33340.01008
45-0.237864-4.58163e-06
46-0.140492-2.70610.003561
470.0008440.01630.493516
480.69214413.33160
490.0161770.31160.37776
50-0.124007-2.38850.008707
51-0.214954-4.14032.1e-05
52-0.083987-1.61770.053288
530.2173494.18641.8e-05
54-0.111348-2.14470.016312
550.2343244.51344e-06
56-0.109262-2.10450.018002
57-0.208152-4.00933.7e-05
58-0.125604-2.41930.008015
590.0105350.20290.419652
600.6357212.24480

\begin{tabular}{lllllllll}
\hline
Autocorrelation Function \tabularnewline
Time lag k & ACF(k) & T-STAT & P-value \tabularnewline
1 & 0.026464 & 0.5097 & 0.305269 \tabularnewline
2 & -0.122833 & -2.3659 & 0.009249 \tabularnewline
3 & -0.249309 & -4.802 & 1e-06 \tabularnewline
4 & -0.085224 & -1.6415 & 0.050768 \tabularnewline
5 & 0.256568 & 4.9418 & 1e-06 \tabularnewline
6 & -0.116159 & -2.2374 & 0.012927 \tabularnewline
7 & 0.226469 & 4.3621 & 8e-06 \tabularnewline
8 & -0.116239 & -2.2389 & 0.012876 \tabularnewline
9 & -0.271329 & -5.2262 & 0 \tabularnewline
10 & -0.18144 & -3.4948 & 0.000266 \tabularnewline
11 & 0.000586 & 0.0113 & 0.495499 \tabularnewline
12 & 0.754851 & 14.5395 & 0 \tabularnewline
13 & -0.025287 & -0.4871 & 0.31325 \tabularnewline
14 & -0.18926 & -3.6454 & 0.000153 \tabularnewline
15 & -0.282736 & -5.4459 & 0 \tabularnewline
16 & -0.132037 & -2.5432 & 0.005695 \tabularnewline
17 & 0.207141 & 3.9898 & 4e-05 \tabularnewline
18 & -0.145504 & -2.8026 & 0.002668 \tabularnewline
19 & 0.226448 & 4.3617 & 8e-06 \tabularnewline
20 & -0.124894 & -2.4056 & 0.008316 \tabularnewline
21 & -0.258167 & -4.9726 & 1e-06 \tabularnewline
22 & -0.160552 & -3.0925 & 0.001068 \tabularnewline
23 & -0.014959 & -0.2881 & 0.386704 \tabularnewline
24 & 0.730814 & 14.0765 & 0 \tabularnewline
25 & -0.00928 & -0.1787 & 0.429121 \tabularnewline
26 & -0.166822 & -3.2132 & 0.000714 \tabularnewline
27 & -0.259834 & -5.0048 & 0 \tabularnewline
28 & -0.10315 & -1.9868 & 0.023839 \tabularnewline
29 & 0.220516 & 4.2474 & 1.4e-05 \tabularnewline
30 & -0.128622 & -2.4774 & 0.006839 \tabularnewline
31 & 0.215842 & 4.1574 & 2e-05 \tabularnewline
32 & -0.134543 & -2.5915 & 0.004967 \tabularnewline
33 & -0.233937 & -4.5059 & 4e-06 \tabularnewline
34 & -0.146838 & -2.8283 & 0.002467 \tabularnewline
35 & -0.029465 & -0.5675 & 0.285347 \tabularnewline
36 & 0.704073 & 13.5614 & 0 \tabularnewline
37 & -0.019656 & -0.3786 & 0.352603 \tabularnewline
38 & -0.141752 & -2.7303 & 0.003314 \tabularnewline
39 & -0.249213 & -4.8002 & 1e-06 \tabularnewline
40 & -0.108265 & -2.0853 & 0.018861 \tabularnewline
41 & 0.192312 & 3.7042 & 0.000122 \tabularnewline
42 & -0.126959 & -2.4454 & 0.007467 \tabularnewline
43 & 0.195187 & 3.7596 & 9.9e-05 \tabularnewline
44 & -0.121145 & -2.3334 & 0.01008 \tabularnewline
45 & -0.237864 & -4.5816 & 3e-06 \tabularnewline
46 & -0.140492 & -2.7061 & 0.003561 \tabularnewline
47 & 0.000844 & 0.0163 & 0.493516 \tabularnewline
48 & 0.692144 & 13.3316 & 0 \tabularnewline
49 & 0.016177 & 0.3116 & 0.37776 \tabularnewline
50 & -0.124007 & -2.3885 & 0.008707 \tabularnewline
51 & -0.214954 & -4.1403 & 2.1e-05 \tabularnewline
52 & -0.083987 & -1.6177 & 0.053288 \tabularnewline
53 & 0.217349 & 4.1864 & 1.8e-05 \tabularnewline
54 & -0.111348 & -2.1447 & 0.016312 \tabularnewline
55 & 0.234324 & 4.5134 & 4e-06 \tabularnewline
56 & -0.109262 & -2.1045 & 0.018002 \tabularnewline
57 & -0.208152 & -4.0093 & 3.7e-05 \tabularnewline
58 & -0.125604 & -2.4193 & 0.008015 \tabularnewline
59 & 0.010535 & 0.2029 & 0.419652 \tabularnewline
60 & 0.63572 & 12.2448 & 0 \tabularnewline
\hline
\end{tabular}
%Source: https://freestatistics.org/blog/index.php?pk=30894&T=1

[TABLE]
[ROW][C]Autocorrelation Function[/C][/ROW]
[ROW][C]Time lag k[/C][C]ACF(k)[/C][C]T-STAT[/C][C]P-value[/C][/ROW]
[ROW][C]1[/C][C]0.026464[/C][C]0.5097[/C][C]0.305269[/C][/ROW]
[ROW][C]2[/C][C]-0.122833[/C][C]-2.3659[/C][C]0.009249[/C][/ROW]
[ROW][C]3[/C][C]-0.249309[/C][C]-4.802[/C][C]1e-06[/C][/ROW]
[ROW][C]4[/C][C]-0.085224[/C][C]-1.6415[/C][C]0.050768[/C][/ROW]
[ROW][C]5[/C][C]0.256568[/C][C]4.9418[/C][C]1e-06[/C][/ROW]
[ROW][C]6[/C][C]-0.116159[/C][C]-2.2374[/C][C]0.012927[/C][/ROW]
[ROW][C]7[/C][C]0.226469[/C][C]4.3621[/C][C]8e-06[/C][/ROW]
[ROW][C]8[/C][C]-0.116239[/C][C]-2.2389[/C][C]0.012876[/C][/ROW]
[ROW][C]9[/C][C]-0.271329[/C][C]-5.2262[/C][C]0[/C][/ROW]
[ROW][C]10[/C][C]-0.18144[/C][C]-3.4948[/C][C]0.000266[/C][/ROW]
[ROW][C]11[/C][C]0.000586[/C][C]0.0113[/C][C]0.495499[/C][/ROW]
[ROW][C]12[/C][C]0.754851[/C][C]14.5395[/C][C]0[/C][/ROW]
[ROW][C]13[/C][C]-0.025287[/C][C]-0.4871[/C][C]0.31325[/C][/ROW]
[ROW][C]14[/C][C]-0.18926[/C][C]-3.6454[/C][C]0.000153[/C][/ROW]
[ROW][C]15[/C][C]-0.282736[/C][C]-5.4459[/C][C]0[/C][/ROW]
[ROW][C]16[/C][C]-0.132037[/C][C]-2.5432[/C][C]0.005695[/C][/ROW]
[ROW][C]17[/C][C]0.207141[/C][C]3.9898[/C][C]4e-05[/C][/ROW]
[ROW][C]18[/C][C]-0.145504[/C][C]-2.8026[/C][C]0.002668[/C][/ROW]
[ROW][C]19[/C][C]0.226448[/C][C]4.3617[/C][C]8e-06[/C][/ROW]
[ROW][C]20[/C][C]-0.124894[/C][C]-2.4056[/C][C]0.008316[/C][/ROW]
[ROW][C]21[/C][C]-0.258167[/C][C]-4.9726[/C][C]1e-06[/C][/ROW]
[ROW][C]22[/C][C]-0.160552[/C][C]-3.0925[/C][C]0.001068[/C][/ROW]
[ROW][C]23[/C][C]-0.014959[/C][C]-0.2881[/C][C]0.386704[/C][/ROW]
[ROW][C]24[/C][C]0.730814[/C][C]14.0765[/C][C]0[/C][/ROW]
[ROW][C]25[/C][C]-0.00928[/C][C]-0.1787[/C][C]0.429121[/C][/ROW]
[ROW][C]26[/C][C]-0.166822[/C][C]-3.2132[/C][C]0.000714[/C][/ROW]
[ROW][C]27[/C][C]-0.259834[/C][C]-5.0048[/C][C]0[/C][/ROW]
[ROW][C]28[/C][C]-0.10315[/C][C]-1.9868[/C][C]0.023839[/C][/ROW]
[ROW][C]29[/C][C]0.220516[/C][C]4.2474[/C][C]1.4e-05[/C][/ROW]
[ROW][C]30[/C][C]-0.128622[/C][C]-2.4774[/C][C]0.006839[/C][/ROW]
[ROW][C]31[/C][C]0.215842[/C][C]4.1574[/C][C]2e-05[/C][/ROW]
[ROW][C]32[/C][C]-0.134543[/C][C]-2.5915[/C][C]0.004967[/C][/ROW]
[ROW][C]33[/C][C]-0.233937[/C][C]-4.5059[/C][C]4e-06[/C][/ROW]
[ROW][C]34[/C][C]-0.146838[/C][C]-2.8283[/C][C]0.002467[/C][/ROW]
[ROW][C]35[/C][C]-0.029465[/C][C]-0.5675[/C][C]0.285347[/C][/ROW]
[ROW][C]36[/C][C]0.704073[/C][C]13.5614[/C][C]0[/C][/ROW]
[ROW][C]37[/C][C]-0.019656[/C][C]-0.3786[/C][C]0.352603[/C][/ROW]
[ROW][C]38[/C][C]-0.141752[/C][C]-2.7303[/C][C]0.003314[/C][/ROW]
[ROW][C]39[/C][C]-0.249213[/C][C]-4.8002[/C][C]1e-06[/C][/ROW]
[ROW][C]40[/C][C]-0.108265[/C][C]-2.0853[/C][C]0.018861[/C][/ROW]
[ROW][C]41[/C][C]0.192312[/C][C]3.7042[/C][C]0.000122[/C][/ROW]
[ROW][C]42[/C][C]-0.126959[/C][C]-2.4454[/C][C]0.007467[/C][/ROW]
[ROW][C]43[/C][C]0.195187[/C][C]3.7596[/C][C]9.9e-05[/C][/ROW]
[ROW][C]44[/C][C]-0.121145[/C][C]-2.3334[/C][C]0.01008[/C][/ROW]
[ROW][C]45[/C][C]-0.237864[/C][C]-4.5816[/C][C]3e-06[/C][/ROW]
[ROW][C]46[/C][C]-0.140492[/C][C]-2.7061[/C][C]0.003561[/C][/ROW]
[ROW][C]47[/C][C]0.000844[/C][C]0.0163[/C][C]0.493516[/C][/ROW]
[ROW][C]48[/C][C]0.692144[/C][C]13.3316[/C][C]0[/C][/ROW]
[ROW][C]49[/C][C]0.016177[/C][C]0.3116[/C][C]0.37776[/C][/ROW]
[ROW][C]50[/C][C]-0.124007[/C][C]-2.3885[/C][C]0.008707[/C][/ROW]
[ROW][C]51[/C][C]-0.214954[/C][C]-4.1403[/C][C]2.1e-05[/C][/ROW]
[ROW][C]52[/C][C]-0.083987[/C][C]-1.6177[/C][C]0.053288[/C][/ROW]
[ROW][C]53[/C][C]0.217349[/C][C]4.1864[/C][C]1.8e-05[/C][/ROW]
[ROW][C]54[/C][C]-0.111348[/C][C]-2.1447[/C][C]0.016312[/C][/ROW]
[ROW][C]55[/C][C]0.234324[/C][C]4.5134[/C][C]4e-06[/C][/ROW]
[ROW][C]56[/C][C]-0.109262[/C][C]-2.1045[/C][C]0.018002[/C][/ROW]
[ROW][C]57[/C][C]-0.208152[/C][C]-4.0093[/C][C]3.7e-05[/C][/ROW]
[ROW][C]58[/C][C]-0.125604[/C][C]-2.4193[/C][C]0.008015[/C][/ROW]
[ROW][C]59[/C][C]0.010535[/C][C]0.2029[/C][C]0.419652[/C][/ROW]
[ROW][C]60[/C][C]0.63572[/C][C]12.2448[/C][C]0[/C][/ROW]
[/TABLE]
Source: https://freestatistics.org/blog/index.php?pk=30894&T=1

Globally Unique Identifier (entire table): ba.freestatistics.org/blog/index.php?pk=30894&T=1

As an alternative you can also use a QR Code:  

The GUIDs for individual cells are displayed in the table below:

Autocorrelation Function
Time lag kACF(k)T-STATP-value
10.0264640.50970.305269
2-0.122833-2.36590.009249
3-0.249309-4.8021e-06
4-0.085224-1.64150.050768
50.2565684.94181e-06
6-0.116159-2.23740.012927
70.2264694.36218e-06
8-0.116239-2.23890.012876
9-0.271329-5.22620
10-0.18144-3.49480.000266
110.0005860.01130.495499
120.75485114.53950
13-0.025287-0.48710.31325
14-0.18926-3.64540.000153
15-0.282736-5.44590
16-0.132037-2.54320.005695
170.2071413.98984e-05
18-0.145504-2.80260.002668
190.2264484.36178e-06
20-0.124894-2.40560.008316
21-0.258167-4.97261e-06
22-0.160552-3.09250.001068
23-0.014959-0.28810.386704
240.73081414.07650
25-0.00928-0.17870.429121
26-0.166822-3.21320.000714
27-0.259834-5.00480
28-0.10315-1.98680.023839
290.2205164.24741.4e-05
30-0.128622-2.47740.006839
310.2158424.15742e-05
32-0.134543-2.59150.004967
33-0.233937-4.50594e-06
34-0.146838-2.82830.002467
35-0.029465-0.56750.285347
360.70407313.56140
37-0.019656-0.37860.352603
38-0.141752-2.73030.003314
39-0.249213-4.80021e-06
40-0.108265-2.08530.018861
410.1923123.70420.000122
42-0.126959-2.44540.007467
430.1951873.75969.9e-05
44-0.121145-2.33340.01008
45-0.237864-4.58163e-06
46-0.140492-2.70610.003561
470.0008440.01630.493516
480.69214413.33160
490.0161770.31160.37776
50-0.124007-2.38850.008707
51-0.214954-4.14032.1e-05
52-0.083987-1.61770.053288
530.2173494.18641.8e-05
54-0.111348-2.14470.016312
550.2343244.51344e-06
56-0.109262-2.10450.018002
57-0.208152-4.00933.7e-05
58-0.125604-2.41930.008015
590.0105350.20290.419652
600.6357212.24480


Partial Autocorrelation Function
Time lag kPACF(k)T-STATP-value
10.0264640.50970.305269
2-0.12362-2.38110.008883
3-0.246319-4.74441e-06
4-0.100796-1.94150.026479
50.2129974.10262.5e-05
6-0.221577-4.26791.3e-05
70.2858825.50650
8-0.101917-1.96310.025193
9-0.309778-5.96680
10-0.166036-3.19810.000751
110.0504660.9720.165832
120.64286112.38240
13-0.145657-2.80550.002644
14-0.220082-4.23911.4e-05
15-0.092674-1.7850.037538
16-0.159368-3.06960.00115
17-0.106285-2.04720.020672
18-0.10646-2.05060.020506
190.0884171.7030.044701
20-0.024516-0.47220.318524
21-0.033114-0.63780.261993
220.0409530.78880.215364
23-0.107512-2.07080.019533
240.2490634.79731e-06
25-0.003448-0.06640.473539
26-0.084481-1.62720.052269
27-0.032009-0.61650.26896
28-0.001403-0.0270.489231
29-0.04055-0.7810.217638
30-0.077097-1.4850.069197
31-0.050263-0.96810.166804
32-0.088431-1.70330.044675
33-0.004382-0.08440.466392
340.0327910.63160.264016
35-0.092585-1.78330.037676
360.155662.99820.001449
37-0.025453-0.49030.312123
380.003710.07150.471538
39-0.015609-0.30060.381928
40-0.071985-1.38650.083209
41-0.13355-2.57240.005245
42-0.011396-0.21950.413193
43-0.065999-1.27120.10222
44-0.011811-0.22750.410083
45-0.056757-1.09320.137503
460.008960.17260.43154
470.0643131.23880.10811
480.1105762.12990.016921
490.0386530.74450.228522
50-0.014967-0.28830.386641
510.03740.72040.235872
52-0.002247-0.04330.482753
53-0.020327-0.39150.347817
54-0.00612-0.11790.453116
550.0580771.11860.13201
560.0024850.04790.480925
570.0099520.19170.424049
58-0.00112-0.02160.491399
590.0278230.53590.296174
60-0.054801-1.05550.145931

\begin{tabular}{lllllllll}
\hline
Partial Autocorrelation Function \tabularnewline
Time lag k & PACF(k) & T-STAT & P-value \tabularnewline
1 & 0.026464 & 0.5097 & 0.305269 \tabularnewline
2 & -0.12362 & -2.3811 & 0.008883 \tabularnewline
3 & -0.246319 & -4.7444 & 1e-06 \tabularnewline
4 & -0.100796 & -1.9415 & 0.026479 \tabularnewline
5 & 0.212997 & 4.1026 & 2.5e-05 \tabularnewline
6 & -0.221577 & -4.2679 & 1.3e-05 \tabularnewline
7 & 0.285882 & 5.5065 & 0 \tabularnewline
8 & -0.101917 & -1.9631 & 0.025193 \tabularnewline
9 & -0.309778 & -5.9668 & 0 \tabularnewline
10 & -0.166036 & -3.1981 & 0.000751 \tabularnewline
11 & 0.050466 & 0.972 & 0.165832 \tabularnewline
12 & 0.642861 & 12.3824 & 0 \tabularnewline
13 & -0.145657 & -2.8055 & 0.002644 \tabularnewline
14 & -0.220082 & -4.2391 & 1.4e-05 \tabularnewline
15 & -0.092674 & -1.785 & 0.037538 \tabularnewline
16 & -0.159368 & -3.0696 & 0.00115 \tabularnewline
17 & -0.106285 & -2.0472 & 0.020672 \tabularnewline
18 & -0.10646 & -2.0506 & 0.020506 \tabularnewline
19 & 0.088417 & 1.703 & 0.044701 \tabularnewline
20 & -0.024516 & -0.4722 & 0.318524 \tabularnewline
21 & -0.033114 & -0.6378 & 0.261993 \tabularnewline
22 & 0.040953 & 0.7888 & 0.215364 \tabularnewline
23 & -0.107512 & -2.0708 & 0.019533 \tabularnewline
24 & 0.249063 & 4.7973 & 1e-06 \tabularnewline
25 & -0.003448 & -0.0664 & 0.473539 \tabularnewline
26 & -0.084481 & -1.6272 & 0.052269 \tabularnewline
27 & -0.032009 & -0.6165 & 0.26896 \tabularnewline
28 & -0.001403 & -0.027 & 0.489231 \tabularnewline
29 & -0.04055 & -0.781 & 0.217638 \tabularnewline
30 & -0.077097 & -1.485 & 0.069197 \tabularnewline
31 & -0.050263 & -0.9681 & 0.166804 \tabularnewline
32 & -0.088431 & -1.7033 & 0.044675 \tabularnewline
33 & -0.004382 & -0.0844 & 0.466392 \tabularnewline
34 & 0.032791 & 0.6316 & 0.264016 \tabularnewline
35 & -0.092585 & -1.7833 & 0.037676 \tabularnewline
36 & 0.15566 & 2.9982 & 0.001449 \tabularnewline
37 & -0.025453 & -0.4903 & 0.312123 \tabularnewline
38 & 0.00371 & 0.0715 & 0.471538 \tabularnewline
39 & -0.015609 & -0.3006 & 0.381928 \tabularnewline
40 & -0.071985 & -1.3865 & 0.083209 \tabularnewline
41 & -0.13355 & -2.5724 & 0.005245 \tabularnewline
42 & -0.011396 & -0.2195 & 0.413193 \tabularnewline
43 & -0.065999 & -1.2712 & 0.10222 \tabularnewline
44 & -0.011811 & -0.2275 & 0.410083 \tabularnewline
45 & -0.056757 & -1.0932 & 0.137503 \tabularnewline
46 & 0.00896 & 0.1726 & 0.43154 \tabularnewline
47 & 0.064313 & 1.2388 & 0.10811 \tabularnewline
48 & 0.110576 & 2.1299 & 0.016921 \tabularnewline
49 & 0.038653 & 0.7445 & 0.228522 \tabularnewline
50 & -0.014967 & -0.2883 & 0.386641 \tabularnewline
51 & 0.0374 & 0.7204 & 0.235872 \tabularnewline
52 & -0.002247 & -0.0433 & 0.482753 \tabularnewline
53 & -0.020327 & -0.3915 & 0.347817 \tabularnewline
54 & -0.00612 & -0.1179 & 0.453116 \tabularnewline
55 & 0.058077 & 1.1186 & 0.13201 \tabularnewline
56 & 0.002485 & 0.0479 & 0.480925 \tabularnewline
57 & 0.009952 & 0.1917 & 0.424049 \tabularnewline
58 & -0.00112 & -0.0216 & 0.491399 \tabularnewline
59 & 0.027823 & 0.5359 & 0.296174 \tabularnewline
60 & -0.054801 & -1.0555 & 0.145931 \tabularnewline
\hline
\end{tabular}
%Source: https://freestatistics.org/blog/index.php?pk=30894&T=2

[TABLE]
[ROW][C]Partial Autocorrelation Function[/C][/ROW]
[ROW][C]Time lag k[/C][C]PACF(k)[/C][C]T-STAT[/C][C]P-value[/C][/ROW]
[ROW][C]1[/C][C]0.026464[/C][C]0.5097[/C][C]0.305269[/C][/ROW]
[ROW][C]2[/C][C]-0.12362[/C][C]-2.3811[/C][C]0.008883[/C][/ROW]
[ROW][C]3[/C][C]-0.246319[/C][C]-4.7444[/C][C]1e-06[/C][/ROW]
[ROW][C]4[/C][C]-0.100796[/C][C]-1.9415[/C][C]0.026479[/C][/ROW]
[ROW][C]5[/C][C]0.212997[/C][C]4.1026[/C][C]2.5e-05[/C][/ROW]
[ROW][C]6[/C][C]-0.221577[/C][C]-4.2679[/C][C]1.3e-05[/C][/ROW]
[ROW][C]7[/C][C]0.285882[/C][C]5.5065[/C][C]0[/C][/ROW]
[ROW][C]8[/C][C]-0.101917[/C][C]-1.9631[/C][C]0.025193[/C][/ROW]
[ROW][C]9[/C][C]-0.309778[/C][C]-5.9668[/C][C]0[/C][/ROW]
[ROW][C]10[/C][C]-0.166036[/C][C]-3.1981[/C][C]0.000751[/C][/ROW]
[ROW][C]11[/C][C]0.050466[/C][C]0.972[/C][C]0.165832[/C][/ROW]
[ROW][C]12[/C][C]0.642861[/C][C]12.3824[/C][C]0[/C][/ROW]
[ROW][C]13[/C][C]-0.145657[/C][C]-2.8055[/C][C]0.002644[/C][/ROW]
[ROW][C]14[/C][C]-0.220082[/C][C]-4.2391[/C][C]1.4e-05[/C][/ROW]
[ROW][C]15[/C][C]-0.092674[/C][C]-1.785[/C][C]0.037538[/C][/ROW]
[ROW][C]16[/C][C]-0.159368[/C][C]-3.0696[/C][C]0.00115[/C][/ROW]
[ROW][C]17[/C][C]-0.106285[/C][C]-2.0472[/C][C]0.020672[/C][/ROW]
[ROW][C]18[/C][C]-0.10646[/C][C]-2.0506[/C][C]0.020506[/C][/ROW]
[ROW][C]19[/C][C]0.088417[/C][C]1.703[/C][C]0.044701[/C][/ROW]
[ROW][C]20[/C][C]-0.024516[/C][C]-0.4722[/C][C]0.318524[/C][/ROW]
[ROW][C]21[/C][C]-0.033114[/C][C]-0.6378[/C][C]0.261993[/C][/ROW]
[ROW][C]22[/C][C]0.040953[/C][C]0.7888[/C][C]0.215364[/C][/ROW]
[ROW][C]23[/C][C]-0.107512[/C][C]-2.0708[/C][C]0.019533[/C][/ROW]
[ROW][C]24[/C][C]0.249063[/C][C]4.7973[/C][C]1e-06[/C][/ROW]
[ROW][C]25[/C][C]-0.003448[/C][C]-0.0664[/C][C]0.473539[/C][/ROW]
[ROW][C]26[/C][C]-0.084481[/C][C]-1.6272[/C][C]0.052269[/C][/ROW]
[ROW][C]27[/C][C]-0.032009[/C][C]-0.6165[/C][C]0.26896[/C][/ROW]
[ROW][C]28[/C][C]-0.001403[/C][C]-0.027[/C][C]0.489231[/C][/ROW]
[ROW][C]29[/C][C]-0.04055[/C][C]-0.781[/C][C]0.217638[/C][/ROW]
[ROW][C]30[/C][C]-0.077097[/C][C]-1.485[/C][C]0.069197[/C][/ROW]
[ROW][C]31[/C][C]-0.050263[/C][C]-0.9681[/C][C]0.166804[/C][/ROW]
[ROW][C]32[/C][C]-0.088431[/C][C]-1.7033[/C][C]0.044675[/C][/ROW]
[ROW][C]33[/C][C]-0.004382[/C][C]-0.0844[/C][C]0.466392[/C][/ROW]
[ROW][C]34[/C][C]0.032791[/C][C]0.6316[/C][C]0.264016[/C][/ROW]
[ROW][C]35[/C][C]-0.092585[/C][C]-1.7833[/C][C]0.037676[/C][/ROW]
[ROW][C]36[/C][C]0.15566[/C][C]2.9982[/C][C]0.001449[/C][/ROW]
[ROW][C]37[/C][C]-0.025453[/C][C]-0.4903[/C][C]0.312123[/C][/ROW]
[ROW][C]38[/C][C]0.00371[/C][C]0.0715[/C][C]0.471538[/C][/ROW]
[ROW][C]39[/C][C]-0.015609[/C][C]-0.3006[/C][C]0.381928[/C][/ROW]
[ROW][C]40[/C][C]-0.071985[/C][C]-1.3865[/C][C]0.083209[/C][/ROW]
[ROW][C]41[/C][C]-0.13355[/C][C]-2.5724[/C][C]0.005245[/C][/ROW]
[ROW][C]42[/C][C]-0.011396[/C][C]-0.2195[/C][C]0.413193[/C][/ROW]
[ROW][C]43[/C][C]-0.065999[/C][C]-1.2712[/C][C]0.10222[/C][/ROW]
[ROW][C]44[/C][C]-0.011811[/C][C]-0.2275[/C][C]0.410083[/C][/ROW]
[ROW][C]45[/C][C]-0.056757[/C][C]-1.0932[/C][C]0.137503[/C][/ROW]
[ROW][C]46[/C][C]0.00896[/C][C]0.1726[/C][C]0.43154[/C][/ROW]
[ROW][C]47[/C][C]0.064313[/C][C]1.2388[/C][C]0.10811[/C][/ROW]
[ROW][C]48[/C][C]0.110576[/C][C]2.1299[/C][C]0.016921[/C][/ROW]
[ROW][C]49[/C][C]0.038653[/C][C]0.7445[/C][C]0.228522[/C][/ROW]
[ROW][C]50[/C][C]-0.014967[/C][C]-0.2883[/C][C]0.386641[/C][/ROW]
[ROW][C]51[/C][C]0.0374[/C][C]0.7204[/C][C]0.235872[/C][/ROW]
[ROW][C]52[/C][C]-0.002247[/C][C]-0.0433[/C][C]0.482753[/C][/ROW]
[ROW][C]53[/C][C]-0.020327[/C][C]-0.3915[/C][C]0.347817[/C][/ROW]
[ROW][C]54[/C][C]-0.00612[/C][C]-0.1179[/C][C]0.453116[/C][/ROW]
[ROW][C]55[/C][C]0.058077[/C][C]1.1186[/C][C]0.13201[/C][/ROW]
[ROW][C]56[/C][C]0.002485[/C][C]0.0479[/C][C]0.480925[/C][/ROW]
[ROW][C]57[/C][C]0.009952[/C][C]0.1917[/C][C]0.424049[/C][/ROW]
[ROW][C]58[/C][C]-0.00112[/C][C]-0.0216[/C][C]0.491399[/C][/ROW]
[ROW][C]59[/C][C]0.027823[/C][C]0.5359[/C][C]0.296174[/C][/ROW]
[ROW][C]60[/C][C]-0.054801[/C][C]-1.0555[/C][C]0.145931[/C][/ROW]
[/TABLE]
Source: https://freestatistics.org/blog/index.php?pk=30894&T=2

Globally Unique Identifier (entire table): ba.freestatistics.org/blog/index.php?pk=30894&T=2

As an alternative you can also use a QR Code:  

The GUIDs for individual cells are displayed in the table below:

Partial Autocorrelation Function
Time lag kPACF(k)T-STATP-value
10.0264640.50970.305269
2-0.12362-2.38110.008883
3-0.246319-4.74441e-06
4-0.100796-1.94150.026479
50.2129974.10262.5e-05
6-0.221577-4.26791.3e-05
70.2858825.50650
8-0.101917-1.96310.025193
9-0.309778-5.96680
10-0.166036-3.19810.000751
110.0504660.9720.165832
120.64286112.38240
13-0.145657-2.80550.002644
14-0.220082-4.23911.4e-05
15-0.092674-1.7850.037538
16-0.159368-3.06960.00115
17-0.106285-2.04720.020672
18-0.10646-2.05060.020506
190.0884171.7030.044701
20-0.024516-0.47220.318524
21-0.033114-0.63780.261993
220.0409530.78880.215364
23-0.107512-2.07080.019533
240.2490634.79731e-06
25-0.003448-0.06640.473539
26-0.084481-1.62720.052269
27-0.032009-0.61650.26896
28-0.001403-0.0270.489231
29-0.04055-0.7810.217638
30-0.077097-1.4850.069197
31-0.050263-0.96810.166804
32-0.088431-1.70330.044675
33-0.004382-0.08440.466392
340.0327910.63160.264016
35-0.092585-1.78330.037676
360.155662.99820.001449
37-0.025453-0.49030.312123
380.003710.07150.471538
39-0.015609-0.30060.381928
40-0.071985-1.38650.083209
41-0.13355-2.57240.005245
42-0.011396-0.21950.413193
43-0.065999-1.27120.10222
44-0.011811-0.22750.410083
45-0.056757-1.09320.137503
460.008960.17260.43154
470.0643131.23880.10811
480.1105762.12990.016921
490.0386530.74450.228522
50-0.014967-0.28830.386641
510.03740.72040.235872
52-0.002247-0.04330.482753
53-0.020327-0.39150.347817
54-0.00612-0.11790.453116
550.0580771.11860.13201
560.0024850.04790.480925
570.0099520.19170.424049
58-0.00112-0.02160.491399
590.0278230.53590.296174
60-0.054801-1.05550.145931


Parameters (Session):
par1 = 60 ; par2 = 0.5 ; par3 = 1 ; par4 = 0 ; par5 = 12 ;
Parameters (R input):
par1 = 60 ; par2 = 0.5 ; par3 = 1 ; par4 = 0 ; par5 = 12 ;
R code (references can be found in the software module):
if (par1 == 'Default') {
par1 = 10*log10(length(x))
} else {
par1 <- as.numeric(par1)
}
par2 <- as.numeric(par2)
par3 <- as.numeric(par3)
par4 <- as.numeric(par4)
par5 <- as.numeric(par5)
if (par2 == 0) {
x <- log(x)
} else {
x <- (x ^ par2 - 1) / par2
}
if (par3 > 0) x <- diff(x,lag=1,difference=par3)
if (par4 > 0) x <- diff(x,lag=par5,difference=par4)
bitmap(file='pic1.png')
racf <- acf(x,par1,main='Autocorrelation',xlab='lags',ylab='ACF')
dev.off()
bitmap(file='pic2.png')
rpacf <- pacf(x,par1,main='Partial Autocorrelation',xlab='lags',ylab='PACF')
dev.off()
(myacf <- c(racf$acf))
(mypacf <- c(rpacf$acf))
lengthx <- length(x)
sqrtn <- sqrt(lengthx)
load(file='createtable')
a<-table.start()
a<-table.row.start(a)
a<-table.element(a,'Autocorrelation Function',4,TRUE)
a<-table.row.end(a)
a<-table.row.start(a)
a<-table.element(a,'Time lag k',header=TRUE)
a<-table.element(a,hyperlink('basics.htm','ACF(k)','click here for more information about the Autocorrelation Function'),header=TRUE)
a<-table.element(a,'T-STAT',header=TRUE)
a<-table.element(a,'P-value',header=TRUE)
a<-table.row.end(a)
for (i in 2:(par1+1)) {
a<-table.row.start(a)
a<-table.element(a,i-1,header=TRUE)
a<-table.element(a,round(myacf[i],6))
mytstat <- myacf[i]*sqrtn
a<-table.element(a,round(mytstat,4))
a<-table.element(a,round(1-pt(abs(mytstat),lengthx),6))
a<-table.row.end(a)
}
a<-table.end(a)
table.save(a,file='mytable.tab')
a<-table.start()
a<-table.row.start(a)
a<-table.element(a,'Partial Autocorrelation Function',4,TRUE)
a<-table.row.end(a)
a<-table.row.start(a)
a<-table.element(a,'Time lag k',header=TRUE)
a<-table.element(a,hyperlink('basics.htm','PACF(k)','click here for more information about the Partial Autocorrelation Function'),header=TRUE)
a<-table.element(a,'T-STAT',header=TRUE)
a<-table.element(a,'P-value',header=TRUE)
a<-table.row.end(a)
for (i in 1:par1) {
a<-table.row.start(a)
a<-table.element(a,i,header=TRUE)
a<-table.element(a,round(mypacf[i],6))
mytstat <- mypacf[i]*sqrtn
a<-table.element(a,round(mytstat,4))
a<-table.element(a,round(1-pt(abs(mytstat),lengthx),6))
a<-table.row.end(a)
}
a<-table.end(a)
table.save(a,file='mytable1.tab')