\begin{tabular}{lllllllll}
\hline
Summary of computational transaction \tabularnewline
Raw Input & view raw input (R code)  \tabularnewline
Raw Output & view raw output of R engine  \tabularnewline
Computing time & 1 seconds \tabularnewline
R Server & 'Gwilym Jenkins' @ 72.249.127.135 \tabularnewline
\hline
\end{tabular}
%Source: https://freestatistics.org/blog/index.php?pk=42571&T=0
[TABLE]
[ROW][C]Summary of computational transaction[/C][/ROW]
[ROW][C]Raw Input[/C][C]view raw input (R code) [/C][/ROW]
[ROW][C]Raw Output[/C][C]view raw output of R engine [/C][/ROW]
[ROW][C]Computing time[/C][C]1 seconds[/C][/ROW]
[ROW][C]R Server[/C][C]'Gwilym Jenkins' @ 72.249.127.135[/C][/ROW]
[/TABLE]
Source: https://freestatistics.org/blog/index.php?pk=42571&T=0
If you paste this QR Code into your document, anyone with a smartphone or tablet will be able to scan it and view this table in a browser.
If you paste this QR Code into your document, anyone with a smartphone or tablet will be able to scan it and view this table in a browser.
If you paste this QR Code into your document, anyone with a smartphone or tablet will be able to scan it and view this table in a browser.
If you paste this QR Code into your document, anyone with a smartphone or tablet will be able to scan it and view this table in a browser.
If you paste this QR Code into your document, anyone with a smartphone or tablet will be able to scan it and view this table in a browser.
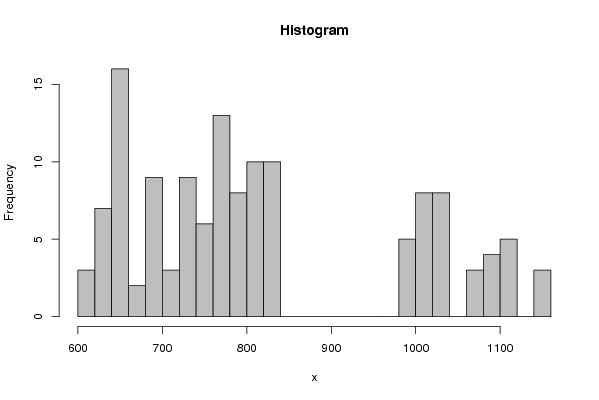
| Frequency Table (Histogram) | | Bins | Midpoint | Abs. Frequency | Rel. Frequency | Cumul. Rel. Freq. | Density | | [600,620[ | 610 | 3 | 0.022727 | 0.022727 | 0.001136 | | [620,640[ | 630 | 7 | 0.05303 | 0.075758 | 0.002652 | | [640,660[ | 650 | 16 | 0.121212 | 0.19697 | 0.006061 | | [660,680[ | 670 | 2 | 0.015152 | 0.212121 | 0.000758 | | [680,700[ | 690 | 9 | 0.068182 | 0.280303 | 0.003409 | | [700,720[ | 710 | 3 | 0.022727 | 0.30303 | 0.001136 | | [720,740[ | 730 | 9 | 0.068182 | 0.371212 | 0.003409 | | [740,760[ | 750 | 6 | 0.045455 | 0.416667 | 0.002273 | | [760,780[ | 770 | 13 | 0.098485 | 0.515152 | 0.004924 | | [780,800[ | 790 | 8 | 0.060606 | 0.575758 | 0.00303 | | [800,820[ | 810 | 10 | 0.075758 | 0.651515 | 0.003788 | | [820,840[ | 830 | 10 | 0.075758 | 0.727273 | 0.003788 | | [840,860[ | 850 | 0 | 0 | 0.727273 | 0 | | [860,880[ | 870 | 0 | 0 | 0.727273 | 0 | | [880,900[ | 890 | 0 | 0 | 0.727273 | 0 | | [900,920[ | 910 | 0 | 0 | 0.727273 | 0 | | [920,940[ | 930 | 0 | 0 | 0.727273 | 0 | | [940,960[ | 950 | 0 | 0 | 0.727273 | 0 | | [960,980[ | 970 | 0 | 0 | 0.727273 | 0 | | [980,1000[ | 990 | 5 | 0.037879 | 0.765152 | 0.001894 | | [1000,1020[ | 1010 | 8 | 0.060606 | 0.825758 | 0.00303 | | [1020,1040[ | 1030 | 8 | 0.060606 | 0.886364 | 0.00303 | | [1040,1060[ | 1050 | 0 | 0 | 0.886364 | 0 | | [1060,1080[ | 1070 | 3 | 0.022727 | 0.909091 | 0.001136 | | [1080,1100[ | 1090 | 4 | 0.030303 | 0.939394 | 0.001515 | | [1100,1120[ | 1110 | 5 | 0.037879 | 0.977273 | 0.001894 | | [1120,1140[ | 1130 | 0 | 0 | 0.977273 | 0 | | [1140,1160] | 1150 | 3 | 0.022727 | 1 | 0.001136 |
\begin{tabular}{lllllllll}
\hline
Frequency Table (Histogram) \tabularnewline
Bins & Midpoint & Abs. Frequency & Rel. Frequency & Cumul. Rel. Freq. & Density \tabularnewline
[600,620[ & 610 & 3 & 0.022727 & 0.022727 & 0.001136 \tabularnewline
[620,640[ & 630 & 7 & 0.05303 & 0.075758 & 0.002652 \tabularnewline
[640,660[ & 650 & 16 & 0.121212 & 0.19697 & 0.006061 \tabularnewline
[660,680[ & 670 & 2 & 0.015152 & 0.212121 & 0.000758 \tabularnewline
[680,700[ & 690 & 9 & 0.068182 & 0.280303 & 0.003409 \tabularnewline
[700,720[ & 710 & 3 & 0.022727 & 0.30303 & 0.001136 \tabularnewline
[720,740[ & 730 & 9 & 0.068182 & 0.371212 & 0.003409 \tabularnewline
[740,760[ & 750 & 6 & 0.045455 & 0.416667 & 0.002273 \tabularnewline
[760,780[ & 770 & 13 & 0.098485 & 0.515152 & 0.004924 \tabularnewline
[780,800[ & 790 & 8 & 0.060606 & 0.575758 & 0.00303 \tabularnewline
[800,820[ & 810 & 10 & 0.075758 & 0.651515 & 0.003788 \tabularnewline
[820,840[ & 830 & 10 & 0.075758 & 0.727273 & 0.003788 \tabularnewline
[840,860[ & 850 & 0 & 0 & 0.727273 & 0 \tabularnewline
[860,880[ & 870 & 0 & 0 & 0.727273 & 0 \tabularnewline
[880,900[ & 890 & 0 & 0 & 0.727273 & 0 \tabularnewline
[900,920[ & 910 & 0 & 0 & 0.727273 & 0 \tabularnewline
[920,940[ & 930 & 0 & 0 & 0.727273 & 0 \tabularnewline
[940,960[ & 950 & 0 & 0 & 0.727273 & 0 \tabularnewline
[960,980[ & 970 & 0 & 0 & 0.727273 & 0 \tabularnewline
[980,1000[ & 990 & 5 & 0.037879 & 0.765152 & 0.001894 \tabularnewline
[1000,1020[ & 1010 & 8 & 0.060606 & 0.825758 & 0.00303 \tabularnewline
[1020,1040[ & 1030 & 8 & 0.060606 & 0.886364 & 0.00303 \tabularnewline
[1040,1060[ & 1050 & 0 & 0 & 0.886364 & 0 \tabularnewline
[1060,1080[ & 1070 & 3 & 0.022727 & 0.909091 & 0.001136 \tabularnewline
[1080,1100[ & 1090 & 4 & 0.030303 & 0.939394 & 0.001515 \tabularnewline
[1100,1120[ & 1110 & 5 & 0.037879 & 0.977273 & 0.001894 \tabularnewline
[1120,1140[ & 1130 & 0 & 0 & 0.977273 & 0 \tabularnewline
[1140,1160] & 1150 & 3 & 0.022727 & 1 & 0.001136 \tabularnewline
\hline
\end{tabular}
%Source: https://freestatistics.org/blog/index.php?pk=42571&T=1
[TABLE]
[ROW][C]Frequency Table (Histogram)[/C][/ROW]
[ROW][C]Bins[/C][C]Midpoint[/C][C]Abs. Frequency[/C][C]Rel. Frequency[/C][C]Cumul. Rel. Freq.[/C][C]Density[/C][/ROW]
[ROW][C][600,620[[/C][C]610[/C][C]3[/C][C]0.022727[/C][C]0.022727[/C][C]0.001136[/C][/ROW]
[ROW][C][620,640[[/C][C]630[/C][C]7[/C][C]0.05303[/C][C]0.075758[/C][C]0.002652[/C][/ROW]
[ROW][C][640,660[[/C][C]650[/C][C]16[/C][C]0.121212[/C][C]0.19697[/C][C]0.006061[/C][/ROW]
[ROW][C][660,680[[/C][C]670[/C][C]2[/C][C]0.015152[/C][C]0.212121[/C][C]0.000758[/C][/ROW]
[ROW][C][680,700[[/C][C]690[/C][C]9[/C][C]0.068182[/C][C]0.280303[/C][C]0.003409[/C][/ROW]
[ROW][C][700,720[[/C][C]710[/C][C]3[/C][C]0.022727[/C][C]0.30303[/C][C]0.001136[/C][/ROW]
[ROW][C][720,740[[/C][C]730[/C][C]9[/C][C]0.068182[/C][C]0.371212[/C][C]0.003409[/C][/ROW]
[ROW][C][740,760[[/C][C]750[/C][C]6[/C][C]0.045455[/C][C]0.416667[/C][C]0.002273[/C][/ROW]
[ROW][C][760,780[[/C][C]770[/C][C]13[/C][C]0.098485[/C][C]0.515152[/C][C]0.004924[/C][/ROW]
[ROW][C][780,800[[/C][C]790[/C][C]8[/C][C]0.060606[/C][C]0.575758[/C][C]0.00303[/C][/ROW]
[ROW][C][800,820[[/C][C]810[/C][C]10[/C][C]0.075758[/C][C]0.651515[/C][C]0.003788[/C][/ROW]
[ROW][C][820,840[[/C][C]830[/C][C]10[/C][C]0.075758[/C][C]0.727273[/C][C]0.003788[/C][/ROW]
[ROW][C][840,860[[/C][C]850[/C][C]0[/C][C]0[/C][C]0.727273[/C][C]0[/C][/ROW]
[ROW][C][860,880[[/C][C]870[/C][C]0[/C][C]0[/C][C]0.727273[/C][C]0[/C][/ROW]
[ROW][C][880,900[[/C][C]890[/C][C]0[/C][C]0[/C][C]0.727273[/C][C]0[/C][/ROW]
[ROW][C][900,920[[/C][C]910[/C][C]0[/C][C]0[/C][C]0.727273[/C][C]0[/C][/ROW]
[ROW][C][920,940[[/C][C]930[/C][C]0[/C][C]0[/C][C]0.727273[/C][C]0[/C][/ROW]
[ROW][C][940,960[[/C][C]950[/C][C]0[/C][C]0[/C][C]0.727273[/C][C]0[/C][/ROW]
[ROW][C][960,980[[/C][C]970[/C][C]0[/C][C]0[/C][C]0.727273[/C][C]0[/C][/ROW]
[ROW][C][980,1000[[/C][C]990[/C][C]5[/C][C]0.037879[/C][C]0.765152[/C][C]0.001894[/C][/ROW]
[ROW][C][1000,1020[[/C][C]1010[/C][C]8[/C][C]0.060606[/C][C]0.825758[/C][C]0.00303[/C][/ROW]
[ROW][C][1020,1040[[/C][C]1030[/C][C]8[/C][C]0.060606[/C][C]0.886364[/C][C]0.00303[/C][/ROW]
[ROW][C][1040,1060[[/C][C]1050[/C][C]0[/C][C]0[/C][C]0.886364[/C][C]0[/C][/ROW]
[ROW][C][1060,1080[[/C][C]1070[/C][C]3[/C][C]0.022727[/C][C]0.909091[/C][C]0.001136[/C][/ROW]
[ROW][C][1080,1100[[/C][C]1090[/C][C]4[/C][C]0.030303[/C][C]0.939394[/C][C]0.001515[/C][/ROW]
[ROW][C][1100,1120[[/C][C]1110[/C][C]5[/C][C]0.037879[/C][C]0.977273[/C][C]0.001894[/C][/ROW]
[ROW][C][1120,1140[[/C][C]1130[/C][C]0[/C][C]0[/C][C]0.977273[/C][C]0[/C][/ROW]
[ROW][C][1140,1160][/C][C]1150[/C][C]3[/C][C]0.022727[/C][C]1[/C][C]0.001136[/C][/ROW]
[/TABLE]
Source: https://freestatistics.org/blog/index.php?pk=42571&T=1
Globally Unique Identifier (entire table): ba.freestatistics.org/blog/index.php?pk=42571&T=1
As an alternative you can also use a QR Code:
The GUIDs for individual cells are displayed in the table below:
| Frequency Table (Histogram) | | Bins | Midpoint | Abs. Frequency | Rel. Frequency | Cumul. Rel. Freq. | Density | | [600,620[ | 610 | 3 | 0.022727 | 0.022727 | 0.001136 | | [620,640[ | 630 | 7 | 0.05303 | 0.075758 | 0.002652 | | [640,660[ | 650 | 16 | 0.121212 | 0.19697 | 0.006061 | | [660,680[ | 670 | 2 | 0.015152 | 0.212121 | 0.000758 | | [680,700[ | 690 | 9 | 0.068182 | 0.280303 | 0.003409 | | [700,720[ | 710 | 3 | 0.022727 | 0.30303 | 0.001136 | | [720,740[ | 730 | 9 | 0.068182 | 0.371212 | 0.003409 | | [740,760[ | 750 | 6 | 0.045455 | 0.416667 | 0.002273 | | [760,780[ | 770 | 13 | 0.098485 | 0.515152 | 0.004924 | | [780,800[ | 790 | 8 | 0.060606 | 0.575758 | 0.00303 | | [800,820[ | 810 | 10 | 0.075758 | 0.651515 | 0.003788 | | [820,840[ | 830 | 10 | 0.075758 | 0.727273 | 0.003788 | | [840,860[ | 850 | 0 | 0 | 0.727273 | 0 | | [860,880[ | 870 | 0 | 0 | 0.727273 | 0 | | [880,900[ | 890 | 0 | 0 | 0.727273 | 0 | | [900,920[ | 910 | 0 | 0 | 0.727273 | 0 | | [920,940[ | 930 | 0 | 0 | 0.727273 | 0 | | [940,960[ | 950 | 0 | 0 | 0.727273 | 0 | | [960,980[ | 970 | 0 | 0 | 0.727273 | 0 | | [980,1000[ | 990 | 5 | 0.037879 | 0.765152 | 0.001894 | | [1000,1020[ | 1010 | 8 | 0.060606 | 0.825758 | 0.00303 | | [1020,1040[ | 1030 | 8 | 0.060606 | 0.886364 | 0.00303 | | [1040,1060[ | 1050 | 0 | 0 | 0.886364 | 0 | | [1060,1080[ | 1070 | 3 | 0.022727 | 0.909091 | 0.001136 | | [1080,1100[ | 1090 | 4 | 0.030303 | 0.939394 | 0.001515 | | [1100,1120[ | 1110 | 5 | 0.037879 | 0.977273 | 0.001894 | | [1120,1140[ | 1130 | 0 | 0 | 0.977273 | 0 | | [1140,1160] | 1150 | 3 | 0.022727 | 1 | 0.001136 |
If you paste this QR Code into your document, anyone with a smartphone or tablet will be able to scan it and view this table in a browser.
If you paste this QR Code into your document, anyone with a smartphone or tablet will be able to scan it and view this table in a browser.
If you paste this QR Code into your document, anyone with a smartphone or tablet will be able to scan it and view this table in a browser.
If you paste this QR Code into your document, anyone with a smartphone or tablet will be able to scan it and view this table in a browser.
If you paste this QR Code into your document, anyone with a smartphone or tablet will be able to scan it and view this table in a browser.
|