Free Statistics

of Irreproducible Research!

Author's title

Author*The author of this computation has been verified*
R Software Modulerwasp_exponentialsmoothing.wasp
Title produced by softwareExponential Smoothing
Date of computationWed, 16 Dec 2009 15:59:52 -0700
Cite this page as followsStatistical Computations at FreeStatistics.org, Office for Research Development and Education, URL https://freestatistics.org/blog/index.php?v=date/2009/Dec/17/t1261004425e81kpi5bnpirwul.htm/, Retrieved Fri, 01 Nov 2024 00:00:25 +0000
Statistical Computations at FreeStatistics.org, Office for Research Development and Education, URL https://freestatistics.org/blog/index.php?pk=68628, Retrieved Fri, 01 Nov 2024 00:00:25 +0000
QR Codes:

Original text written by user:
IsPrivate?No (this computation is public)
User-defined keywords
Estimated Impact184
Family? (F = Feedback message, R = changed R code, M = changed R Module, P = changed Parameters, D = changed Data)
-     [Univariate Data Series] [data set] [2008-12-01 19:54:57] [b98453cac15ba1066b407e146608df68]
- RMP   [Exponential Smoothing] [] [2009-11-27 15:04:36] [b98453cac15ba1066b407e146608df68]
-    D    [Exponential Smoothing] [Exponential smoot...] [2009-12-03 16:44:51] [d46757a0a8c9b00540ab7e7e0c34bfc4]
-    D      [Exponential Smoothing] [Exponential smoot...] [2009-12-04 16:17:53] [34d27ebe78dc2d31581e8710befe8733]
-   PD          [Exponential Smoothing] [Exponential smoot...] [2009-12-16 22:59:52] [371dc2189c569d90e2c1567f632c3ec0] [Current]
Feedback Forum

Post a new message
Dataseries X:
441
449
452
462
455
461
461
463
462
456
455
456
472
472
471
465
459
465
468
467
463
460
462
461
476
476
471
453
443
442
444
438
427
424
416
406
431
434
418
412
404
409
412
406
398
397
385
390
413
413
401
397
397
409
419
424
428
430
424
433
456


Summary of computational transaction
Raw Inputview raw input (R code)
Raw Outputview raw output of R engine
Computing time1 seconds
R Server'Gwilym Jenkins' @ 72.249.127.135

\begin{tabular}{lllllllll}
\hline
Summary of computational transaction \tabularnewline
Raw Input & view raw input (R code)  \tabularnewline
Raw Output & view raw output of R engine  \tabularnewline
Computing time & 1 seconds \tabularnewline
R Server & 'Gwilym Jenkins' @ 72.249.127.135 \tabularnewline
\hline
\end{tabular}
%Source: https://freestatistics.org/blog/index.php?pk=68628&T=0

[TABLE]
[ROW][C]Summary of computational transaction[/C][/ROW]
[ROW][C]Raw Input[/C][C]view raw input (R code) [/C][/ROW]
[ROW][C]Raw Output[/C][C]view raw output of R engine [/C][/ROW]
[ROW][C]Computing time[/C][C]1 seconds[/C][/ROW]
[ROW][C]R Server[/C][C]'Gwilym Jenkins' @ 72.249.127.135[/C][/ROW]
[/TABLE]
Source: https://freestatistics.org/blog/index.php?pk=68628&T=0

Globally Unique Identifier (entire table): ba.freestatistics.org/blog/index.php?pk=68628&T=0

As an alternative you can also use a QR Code:  

The GUIDs for individual cells are displayed in the table below:

Summary of computational transaction
Raw Inputview raw input (R code)
Raw Outputview raw output of R engine
Computing time1 seconds
R Server'Gwilym Jenkins' @ 72.249.127.135


Estimated Parameters of Exponential Smoothing
ParameterValue
alpha0.496552453079008
beta0.754829928324468
gamma1

\begin{tabular}{lllllllll}
\hline
Estimated Parameters of Exponential Smoothing \tabularnewline
Parameter & Value \tabularnewline
alpha & 0.496552453079008 \tabularnewline
beta & 0.754829928324468 \tabularnewline
gamma & 1 \tabularnewline
\hline
\end{tabular}
%Source: https://freestatistics.org/blog/index.php?pk=68628&T=1

[TABLE]
[ROW][C]Estimated Parameters of Exponential Smoothing[/C][/ROW]
[ROW][C]Parameter[/C][C]Value[/C][/ROW]
[ROW][C]alpha[/C][C]0.496552453079008[/C][/ROW]
[ROW][C]beta[/C][C]0.754829928324468[/C][/ROW]
[ROW][C]gamma[/C][C]1[/C][/ROW]
[/TABLE]
Source: https://freestatistics.org/blog/index.php?pk=68628&T=1

Globally Unique Identifier (entire table): ba.freestatistics.org/blog/index.php?pk=68628&T=1

As an alternative you can also use a QR Code:  

The GUIDs for individual cells are displayed in the table below:

Estimated Parameters of Exponential Smoothing
ParameterValue
alpha0.496552453079008
beta0.754829928324468
gamma1


Interpolation Forecasts of Exponential Smoothing
tObservedFittedResiduals
13472467.5520738174764.44792618252364
14472471.548508947440.451491052560584
15471472.976831065811-1.97683106581104
16465467.425440215685-2.42544021568494
17459460.484037397678-1.48403739767849
18465465.434792758289-0.434792758288552
19468469.131791819429-1.13179181942866
20467467.890571160227-0.8905711602265
21463463.931827028758-0.931827028757766
22460455.472249165674.52775083433016
23462457.0533339718614.94666602813948
24461462.670208747762-1.67020874776165
25476481.778156539560-5.77815653955957
26476476.159533096608-0.159533096607561
27471473.334825803449-2.33482580344872
28453464.559690518383-11.5596905183833
29443447.488480081972-4.4884800819724
30442443.925487876679-1.92548787667863
31444438.3741545086665.62584549133408
32438435.1636208320662.83637916793441
33427429.183211059192-2.18321105919199
34424418.6927686079325.30723139206805
35416416.78219736737-0.782197367370088
36406410.193636427058-4.19363642705838
37431416.64819904216514.3518009578351
38434423.86443106811410.1355689318856
39418429.279831313427-11.2798313134268
40412412.978207551179-0.978207551178912
41404409.319373675879-5.31937367587898
42409410.188424164302-1.18842416430232
43412412.74575799633-0.745757996330099
44406407.150269621264-1.15026962126410
45398397.6047807132750.395219286724853
46397393.6926048906843.30739510931636
47385388.767006210686-3.76700621068613
48390378.91051570827411.0894842917255
49413406.6074081543956.39259184560484
50413410.3791962489422.62080375105825
51401401.670332331658-0.670332331658472
52397399.63788759354-2.63788759353974
53397396.0637726272950.936227372704877
54409407.3691818511781.63081814882185
55419418.1109319490520.88906805094797
56424420.2566683103233.74333168967712
57428422.6645163618555.33548363814509
58430433.555060520055-3.55506052005478
59424429.068051710437-5.06805171043675
60433433.995324171498-0.995324171498396
61456458.713676668363-2.71367666836289

\begin{tabular}{lllllllll}
\hline
Interpolation Forecasts of Exponential Smoothing \tabularnewline
t & Observed & Fitted & Residuals \tabularnewline
13 & 472 & 467.552073817476 & 4.44792618252364 \tabularnewline
14 & 472 & 471.54850894744 & 0.451491052560584 \tabularnewline
15 & 471 & 472.976831065811 & -1.97683106581104 \tabularnewline
16 & 465 & 467.425440215685 & -2.42544021568494 \tabularnewline
17 & 459 & 460.484037397678 & -1.48403739767849 \tabularnewline
18 & 465 & 465.434792758289 & -0.434792758288552 \tabularnewline
19 & 468 & 469.131791819429 & -1.13179181942866 \tabularnewline
20 & 467 & 467.890571160227 & -0.8905711602265 \tabularnewline
21 & 463 & 463.931827028758 & -0.931827028757766 \tabularnewline
22 & 460 & 455.47224916567 & 4.52775083433016 \tabularnewline
23 & 462 & 457.053333971861 & 4.94666602813948 \tabularnewline
24 & 461 & 462.670208747762 & -1.67020874776165 \tabularnewline
25 & 476 & 481.778156539560 & -5.77815653955957 \tabularnewline
26 & 476 & 476.159533096608 & -0.159533096607561 \tabularnewline
27 & 471 & 473.334825803449 & -2.33482580344872 \tabularnewline
28 & 453 & 464.559690518383 & -11.5596905183833 \tabularnewline
29 & 443 & 447.488480081972 & -4.4884800819724 \tabularnewline
30 & 442 & 443.925487876679 & -1.92548787667863 \tabularnewline
31 & 444 & 438.374154508666 & 5.62584549133408 \tabularnewline
32 & 438 & 435.163620832066 & 2.83637916793441 \tabularnewline
33 & 427 & 429.183211059192 & -2.18321105919199 \tabularnewline
34 & 424 & 418.692768607932 & 5.30723139206805 \tabularnewline
35 & 416 & 416.78219736737 & -0.782197367370088 \tabularnewline
36 & 406 & 410.193636427058 & -4.19363642705838 \tabularnewline
37 & 431 & 416.648199042165 & 14.3518009578351 \tabularnewline
38 & 434 & 423.864431068114 & 10.1355689318856 \tabularnewline
39 & 418 & 429.279831313427 & -11.2798313134268 \tabularnewline
40 & 412 & 412.978207551179 & -0.978207551178912 \tabularnewline
41 & 404 & 409.319373675879 & -5.31937367587898 \tabularnewline
42 & 409 & 410.188424164302 & -1.18842416430232 \tabularnewline
43 & 412 & 412.74575799633 & -0.745757996330099 \tabularnewline
44 & 406 & 407.150269621264 & -1.15026962126410 \tabularnewline
45 & 398 & 397.604780713275 & 0.395219286724853 \tabularnewline
46 & 397 & 393.692604890684 & 3.30739510931636 \tabularnewline
47 & 385 & 388.767006210686 & -3.76700621068613 \tabularnewline
48 & 390 & 378.910515708274 & 11.0894842917255 \tabularnewline
49 & 413 & 406.607408154395 & 6.39259184560484 \tabularnewline
50 & 413 & 410.379196248942 & 2.62080375105825 \tabularnewline
51 & 401 & 401.670332331658 & -0.670332331658472 \tabularnewline
52 & 397 & 399.63788759354 & -2.63788759353974 \tabularnewline
53 & 397 & 396.063772627295 & 0.936227372704877 \tabularnewline
54 & 409 & 407.369181851178 & 1.63081814882185 \tabularnewline
55 & 419 & 418.110931949052 & 0.88906805094797 \tabularnewline
56 & 424 & 420.256668310323 & 3.74333168967712 \tabularnewline
57 & 428 & 422.664516361855 & 5.33548363814509 \tabularnewline
58 & 430 & 433.555060520055 & -3.55506052005478 \tabularnewline
59 & 424 & 429.068051710437 & -5.06805171043675 \tabularnewline
60 & 433 & 433.995324171498 & -0.995324171498396 \tabularnewline
61 & 456 & 458.713676668363 & -2.71367666836289 \tabularnewline
\hline
\end{tabular}
%Source: https://freestatistics.org/blog/index.php?pk=68628&T=2

[TABLE]
[ROW][C]Interpolation Forecasts of Exponential Smoothing[/C][/ROW]
[ROW][C]t[/C][C]Observed[/C][C]Fitted[/C][C]Residuals[/C][/ROW]
[ROW][C]13[/C][C]472[/C][C]467.552073817476[/C][C]4.44792618252364[/C][/ROW]
[ROW][C]14[/C][C]472[/C][C]471.54850894744[/C][C]0.451491052560584[/C][/ROW]
[ROW][C]15[/C][C]471[/C][C]472.976831065811[/C][C]-1.97683106581104[/C][/ROW]
[ROW][C]16[/C][C]465[/C][C]467.425440215685[/C][C]-2.42544021568494[/C][/ROW]
[ROW][C]17[/C][C]459[/C][C]460.484037397678[/C][C]-1.48403739767849[/C][/ROW]
[ROW][C]18[/C][C]465[/C][C]465.434792758289[/C][C]-0.434792758288552[/C][/ROW]
[ROW][C]19[/C][C]468[/C][C]469.131791819429[/C][C]-1.13179181942866[/C][/ROW]
[ROW][C]20[/C][C]467[/C][C]467.890571160227[/C][C]-0.8905711602265[/C][/ROW]
[ROW][C]21[/C][C]463[/C][C]463.931827028758[/C][C]-0.931827028757766[/C][/ROW]
[ROW][C]22[/C][C]460[/C][C]455.47224916567[/C][C]4.52775083433016[/C][/ROW]
[ROW][C]23[/C][C]462[/C][C]457.053333971861[/C][C]4.94666602813948[/C][/ROW]
[ROW][C]24[/C][C]461[/C][C]462.670208747762[/C][C]-1.67020874776165[/C][/ROW]
[ROW][C]25[/C][C]476[/C][C]481.778156539560[/C][C]-5.77815653955957[/C][/ROW]
[ROW][C]26[/C][C]476[/C][C]476.159533096608[/C][C]-0.159533096607561[/C][/ROW]
[ROW][C]27[/C][C]471[/C][C]473.334825803449[/C][C]-2.33482580344872[/C][/ROW]
[ROW][C]28[/C][C]453[/C][C]464.559690518383[/C][C]-11.5596905183833[/C][/ROW]
[ROW][C]29[/C][C]443[/C][C]447.488480081972[/C][C]-4.4884800819724[/C][/ROW]
[ROW][C]30[/C][C]442[/C][C]443.925487876679[/C][C]-1.92548787667863[/C][/ROW]
[ROW][C]31[/C][C]444[/C][C]438.374154508666[/C][C]5.62584549133408[/C][/ROW]
[ROW][C]32[/C][C]438[/C][C]435.163620832066[/C][C]2.83637916793441[/C][/ROW]
[ROW][C]33[/C][C]427[/C][C]429.183211059192[/C][C]-2.18321105919199[/C][/ROW]
[ROW][C]34[/C][C]424[/C][C]418.692768607932[/C][C]5.30723139206805[/C][/ROW]
[ROW][C]35[/C][C]416[/C][C]416.78219736737[/C][C]-0.782197367370088[/C][/ROW]
[ROW][C]36[/C][C]406[/C][C]410.193636427058[/C][C]-4.19363642705838[/C][/ROW]
[ROW][C]37[/C][C]431[/C][C]416.648199042165[/C][C]14.3518009578351[/C][/ROW]
[ROW][C]38[/C][C]434[/C][C]423.864431068114[/C][C]10.1355689318856[/C][/ROW]
[ROW][C]39[/C][C]418[/C][C]429.279831313427[/C][C]-11.2798313134268[/C][/ROW]
[ROW][C]40[/C][C]412[/C][C]412.978207551179[/C][C]-0.978207551178912[/C][/ROW]
[ROW][C]41[/C][C]404[/C][C]409.319373675879[/C][C]-5.31937367587898[/C][/ROW]
[ROW][C]42[/C][C]409[/C][C]410.188424164302[/C][C]-1.18842416430232[/C][/ROW]
[ROW][C]43[/C][C]412[/C][C]412.74575799633[/C][C]-0.745757996330099[/C][/ROW]
[ROW][C]44[/C][C]406[/C][C]407.150269621264[/C][C]-1.15026962126410[/C][/ROW]
[ROW][C]45[/C][C]398[/C][C]397.604780713275[/C][C]0.395219286724853[/C][/ROW]
[ROW][C]46[/C][C]397[/C][C]393.692604890684[/C][C]3.30739510931636[/C][/ROW]
[ROW][C]47[/C][C]385[/C][C]388.767006210686[/C][C]-3.76700621068613[/C][/ROW]
[ROW][C]48[/C][C]390[/C][C]378.910515708274[/C][C]11.0894842917255[/C][/ROW]
[ROW][C]49[/C][C]413[/C][C]406.607408154395[/C][C]6.39259184560484[/C][/ROW]
[ROW][C]50[/C][C]413[/C][C]410.379196248942[/C][C]2.62080375105825[/C][/ROW]
[ROW][C]51[/C][C]401[/C][C]401.670332331658[/C][C]-0.670332331658472[/C][/ROW]
[ROW][C]52[/C][C]397[/C][C]399.63788759354[/C][C]-2.63788759353974[/C][/ROW]
[ROW][C]53[/C][C]397[/C][C]396.063772627295[/C][C]0.936227372704877[/C][/ROW]
[ROW][C]54[/C][C]409[/C][C]407.369181851178[/C][C]1.63081814882185[/C][/ROW]
[ROW][C]55[/C][C]419[/C][C]418.110931949052[/C][C]0.88906805094797[/C][/ROW]
[ROW][C]56[/C][C]424[/C][C]420.256668310323[/C][C]3.74333168967712[/C][/ROW]
[ROW][C]57[/C][C]428[/C][C]422.664516361855[/C][C]5.33548363814509[/C][/ROW]
[ROW][C]58[/C][C]430[/C][C]433.555060520055[/C][C]-3.55506052005478[/C][/ROW]
[ROW][C]59[/C][C]424[/C][C]429.068051710437[/C][C]-5.06805171043675[/C][/ROW]
[ROW][C]60[/C][C]433[/C][C]433.995324171498[/C][C]-0.995324171498396[/C][/ROW]
[ROW][C]61[/C][C]456[/C][C]458.713676668363[/C][C]-2.71367666836289[/C][/ROW]
[/TABLE]
Source: https://freestatistics.org/blog/index.php?pk=68628&T=2

Globally Unique Identifier (entire table): ba.freestatistics.org/blog/index.php?pk=68628&T=2

As an alternative you can also use a QR Code:  

The GUIDs for individual cells are displayed in the table below:

Interpolation Forecasts of Exponential Smoothing
tObservedFittedResiduals
13472467.5520738174764.44792618252364
14472471.548508947440.451491052560584
15471472.976831065811-1.97683106581104
16465467.425440215685-2.42544021568494
17459460.484037397678-1.48403739767849
18465465.434792758289-0.434792758288552
19468469.131791819429-1.13179181942866
20467467.890571160227-0.8905711602265
21463463.931827028758-0.931827028757766
22460455.472249165674.52775083433016
23462457.0533339718614.94666602813948
24461462.670208747762-1.67020874776165
25476481.778156539560-5.77815653955957
26476476.159533096608-0.159533096607561
27471473.334825803449-2.33482580344872
28453464.559690518383-11.5596905183833
29443447.488480081972-4.4884800819724
30442443.925487876679-1.92548787667863
31444438.3741545086665.62584549133408
32438435.1636208320662.83637916793441
33427429.183211059192-2.18321105919199
34424418.6927686079325.30723139206805
35416416.78219736737-0.782197367370088
36406410.193636427058-4.19363642705838
37431416.64819904216514.3518009578351
38434423.86443106811410.1355689318856
39418429.279831313427-11.2798313134268
40412412.978207551179-0.978207551178912
41404409.319373675879-5.31937367587898
42409410.188424164302-1.18842416430232
43412412.74575799633-0.745757996330099
44406407.150269621264-1.15026962126410
45398397.6047807132750.395219286724853
46397393.6926048906843.30739510931636
47385388.767006210686-3.76700621068613
48390378.91051570827411.0894842917255
49413406.6074081543956.39259184560484
50413410.3791962489422.62080375105825
51401401.670332331658-0.670332331658472
52397399.63788759354-2.63788759353974
53397396.0637726272950.936227372704877
54409407.3691818511781.63081814882185
55419418.1109319490520.88906805094797
56424420.2566683103233.74333168967712
57428422.6645163618555.33548363814509
58430433.555060520055-3.55506052005478
59424429.068051710437-5.06805171043675
60433433.995324171498-0.995324171498396
61456458.713676668363-2.71367666836289


Extrapolation Forecasts of Exponential Smoothing
tForecast95% Lower Bound95% Upper Bound
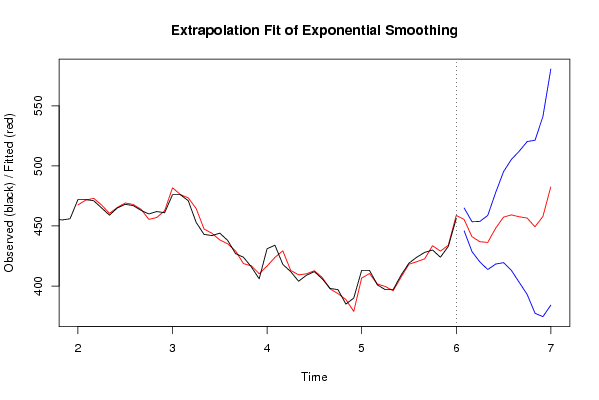
62455.436667540855445.905989794802464.967345286908
63441.067604793601428.621646659256453.513562927946
64436.903693812768420.015228667572453.792158957965
65436.274732156254413.753549163715458.795915148792
66448.059427170016418.310984053078477.807870286953
67457.338038587239419.472750193873495.203326980606
68459.214373606561413.034558421519505.394188791604
69457.642469162477402.965005973521512.319932351434
70456.593014579788392.945431670767520.24059748881
71449.342923605335377.320355620725521.365491589946
72457.859049842284374.543513588018541.174586096549
73482.401481211949384.152608633567580.650353790332

\begin{tabular}{lllllllll}
\hline
Extrapolation Forecasts of Exponential Smoothing \tabularnewline
t & Forecast & 95% Lower Bound & 95% Upper Bound \tabularnewline
62 & 455.436667540855 & 445.905989794802 & 464.967345286908 \tabularnewline
63 & 441.067604793601 & 428.621646659256 & 453.513562927946 \tabularnewline
64 & 436.903693812768 & 420.015228667572 & 453.792158957965 \tabularnewline
65 & 436.274732156254 & 413.753549163715 & 458.795915148792 \tabularnewline
66 & 448.059427170016 & 418.310984053078 & 477.807870286953 \tabularnewline
67 & 457.338038587239 & 419.472750193873 & 495.203326980606 \tabularnewline
68 & 459.214373606561 & 413.034558421519 & 505.394188791604 \tabularnewline
69 & 457.642469162477 & 402.965005973521 & 512.319932351434 \tabularnewline
70 & 456.593014579788 & 392.945431670767 & 520.24059748881 \tabularnewline
71 & 449.342923605335 & 377.320355620725 & 521.365491589946 \tabularnewline
72 & 457.859049842284 & 374.543513588018 & 541.174586096549 \tabularnewline
73 & 482.401481211949 & 384.152608633567 & 580.650353790332 \tabularnewline
\hline
\end{tabular}
%Source: https://freestatistics.org/blog/index.php?pk=68628&T=3

[TABLE]
[ROW][C]Extrapolation Forecasts of Exponential Smoothing[/C][/ROW]
[ROW][C]t[/C][C]Forecast[/C][C]95% Lower Bound[/C][C]95% Upper Bound[/C][/ROW]
[ROW][C]62[/C][C]455.436667540855[/C][C]445.905989794802[/C][C]464.967345286908[/C][/ROW]
[ROW][C]63[/C][C]441.067604793601[/C][C]428.621646659256[/C][C]453.513562927946[/C][/ROW]
[ROW][C]64[/C][C]436.903693812768[/C][C]420.015228667572[/C][C]453.792158957965[/C][/ROW]
[ROW][C]65[/C][C]436.274732156254[/C][C]413.753549163715[/C][C]458.795915148792[/C][/ROW]
[ROW][C]66[/C][C]448.059427170016[/C][C]418.310984053078[/C][C]477.807870286953[/C][/ROW]
[ROW][C]67[/C][C]457.338038587239[/C][C]419.472750193873[/C][C]495.203326980606[/C][/ROW]
[ROW][C]68[/C][C]459.214373606561[/C][C]413.034558421519[/C][C]505.394188791604[/C][/ROW]
[ROW][C]69[/C][C]457.642469162477[/C][C]402.965005973521[/C][C]512.319932351434[/C][/ROW]
[ROW][C]70[/C][C]456.593014579788[/C][C]392.945431670767[/C][C]520.24059748881[/C][/ROW]
[ROW][C]71[/C][C]449.342923605335[/C][C]377.320355620725[/C][C]521.365491589946[/C][/ROW]
[ROW][C]72[/C][C]457.859049842284[/C][C]374.543513588018[/C][C]541.174586096549[/C][/ROW]
[ROW][C]73[/C][C]482.401481211949[/C][C]384.152608633567[/C][C]580.650353790332[/C][/ROW]
[/TABLE]
Source: https://freestatistics.org/blog/index.php?pk=68628&T=3

Globally Unique Identifier (entire table): ba.freestatistics.org/blog/index.php?pk=68628&T=3

As an alternative you can also use a QR Code:  

The GUIDs for individual cells are displayed in the table below:

Extrapolation Forecasts of Exponential Smoothing
tForecast95% Lower Bound95% Upper Bound
62455.436667540855445.905989794802464.967345286908
63441.067604793601428.621646659256453.513562927946
64436.903693812768420.015228667572453.792158957965
65436.274732156254413.753549163715458.795915148792
66448.059427170016418.310984053078477.807870286953
67457.338038587239419.472750193873495.203326980606
68459.214373606561413.034558421519505.394188791604
69457.642469162477402.965005973521512.319932351434
70456.593014579788392.945431670767520.24059748881
71449.342923605335377.320355620725521.365491589946
72457.859049842284374.543513588018541.174586096549
73482.401481211949384.152608633567580.650353790332


Parameters (Session):
par1 = 1 ; par2 = 2 ; par3 = 1 ; par4 = 12 ;
Parameters (R input):
par1 = 12 ; par2 = Triple ; par3 = multiplicative ;
R code (references can be found in the software module):
par1 <- as.numeric(par1)
if (par2 == 'Single') K <- 1
if (par2 == 'Double') K <- 2
if (par2 == 'Triple') K <- par1
nx <- length(x)
nxmK <- nx - K
x <- ts(x, frequency = par1)
if (par2 == 'Single') fit <- HoltWinters(x, gamma=0, beta=0)
if (par2 == 'Double') fit <- HoltWinters(x, gamma=0)
if (par2 == 'Triple') fit <- HoltWinters(x, seasonal=par3)
fit
myresid <- x - fit$fitted[,'xhat']
bitmap(file='test1.png')
op <- par(mfrow=c(2,1))
plot(fit,ylab='Observed (black) / Fitted (red)',main='Interpolation Fit of Exponential Smoothing')
plot(myresid,ylab='Residuals',main='Interpolation Prediction Errors')
par(op)
dev.off()
bitmap(file='test2.png')
p <- predict(fit, par1, prediction.interval=TRUE)
np <- length(p[,1])
plot(fit,p,ylab='Observed (black) / Fitted (red)',main='Extrapolation Fit of Exponential Smoothing')
dev.off()
bitmap(file='test3.png')
op <- par(mfrow = c(2,2))
acf(as.numeric(myresid),lag.max = nx/2,main='Residual ACF')
spectrum(myresid,main='Residals Periodogram')
cpgram(myresid,main='Residal Cumulative Periodogram')
qqnorm(myresid,main='Residual Normal QQ Plot')
qqline(myresid)
par(op)
dev.off()
load(file='createtable')
a<-table.start()
a<-table.row.start(a)
a<-table.element(a,'Estimated Parameters of Exponential Smoothing',2,TRUE)
a<-table.row.end(a)
a<-table.row.start(a)
a<-table.element(a,'Parameter',header=TRUE)
a<-table.element(a,'Value',header=TRUE)
a<-table.row.end(a)
a<-table.row.start(a)
a<-table.element(a,'alpha',header=TRUE)
a<-table.element(a,fit$alpha)
a<-table.row.end(a)
a<-table.row.start(a)
a<-table.element(a,'beta',header=TRUE)
a<-table.element(a,fit$beta)
a<-table.row.end(a)
a<-table.row.start(a)
a<-table.element(a,'gamma',header=TRUE)
a<-table.element(a,fit$gamma)
a<-table.row.end(a)
a<-table.end(a)
table.save(a,file='mytable.tab')
a<-table.start()
a<-table.row.start(a)
a<-table.element(a,'Interpolation Forecasts of Exponential Smoothing',4,TRUE)
a<-table.row.end(a)
a<-table.row.start(a)
a<-table.element(a,'t',header=TRUE)
a<-table.element(a,'Observed',header=TRUE)
a<-table.element(a,'Fitted',header=TRUE)
a<-table.element(a,'Residuals',header=TRUE)
a<-table.row.end(a)
for (i in 1:nxmK) {
a<-table.row.start(a)
a<-table.element(a,i+K,header=TRUE)
a<-table.element(a,x[i+K])
a<-table.element(a,fit$fitted[i,'xhat'])
a<-table.element(a,myresid[i])
a<-table.row.end(a)
}
a<-table.end(a)
table.save(a,file='mytable1.tab')
a<-table.start()
a<-table.row.start(a)
a<-table.element(a,'Extrapolation Forecasts of Exponential Smoothing',4,TRUE)
a<-table.row.end(a)
a<-table.row.start(a)
a<-table.element(a,'t',header=TRUE)
a<-table.element(a,'Forecast',header=TRUE)
a<-table.element(a,'95% Lower Bound',header=TRUE)
a<-table.element(a,'95% Upper Bound',header=TRUE)
a<-table.row.end(a)
for (i in 1:np) {
a<-table.row.start(a)
a<-table.element(a,nx+i,header=TRUE)
a<-table.element(a,p[i,'fit'])
a<-table.element(a,p[i,'lwr'])
a<-table.element(a,p[i,'upr'])
a<-table.row.end(a)
}
a<-table.end(a)
table.save(a,file='mytable2.tab')