Free Statistics
of Irreproducible Research!
Description of Statistical Computation | |||||||||||||||||||||||||||||||||||||||||||||||||||||||||||||||
|---|---|---|---|---|---|---|---|---|---|---|---|---|---|---|---|---|---|---|---|---|---|---|---|---|---|---|---|---|---|---|---|---|---|---|---|---|---|---|---|---|---|---|---|---|---|---|---|---|---|---|---|---|---|---|---|---|---|---|---|---|---|---|---|
| Author's title | |||||||||||||||||||||||||||||||||||||||||||||||||||||||||||||||
| Author | *Unverified author* | ||||||||||||||||||||||||||||||||||||||||||||||||||||||||||||||
| R Software Module | rwasp_notchedbox1.wasp | ||||||||||||||||||||||||||||||||||||||||||||||||||||||||||||||
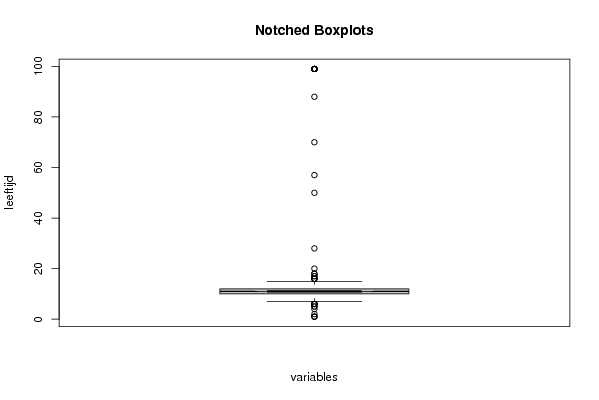
| Title produced by software | Notched Boxplots | ||||||||||||||||||||||||||||||||||||||||||||||||||||||||||||||
| Date of computation | Wed, 03 Mar 2010 06:39:53 -0700 | ||||||||||||||||||||||||||||||||||||||||||||||||||||||||||||||
| Cite this page as follows | Statistical Computations at FreeStatistics.org, Office for Research Development and Education, URL https://freestatistics.org/blog/index.php?v=date/2010/Mar/03/t1267623708lkaf0s2znuvg97n.htm/, Retrieved Wed, 27 May 2026 23:14:13 +0000 | ||||||||||||||||||||||||||||||||||||||||||||||||||||||||||||||
| Statistical Computations at FreeStatistics.org, Office for Research Development and Education, URL https://freestatistics.org/blog/index.php?pk=73857, Retrieved Wed, 27 May 2026 23:14:13 +0000 | |||||||||||||||||||||||||||||||||||||||||||||||||||||||||||||||
| QR Codes: | |||||||||||||||||||||||||||||||||||||||||||||||||||||||||||||||
|
| |||||||||||||||||||||||||||||||||||||||||||||||||||||||||||||||
| Original text written by user: | |||||||||||||||||||||||||||||||||||||||||||||||||||||||||||||||
| IsPrivate? | No (this computation is public) | ||||||||||||||||||||||||||||||||||||||||||||||||||||||||||||||
| User-defined keywords | KDGP1W31 | ||||||||||||||||||||||||||||||||||||||||||||||||||||||||||||||
| Estimated Impact | 593 | ||||||||||||||||||||||||||||||||||||||||||||||||||||||||||||||
Tree of Dependent Computations | |||||||||||||||||||||||||||||||||||||||||||||||||||||||||||||||
| Family? (F = Feedback message, R = changed R code, M = changed R Module, P = changed Parameters, D = changed Data) | |||||||||||||||||||||||||||||||||||||||||||||||||||||||||||||||
| - [Quartiles] [opgave3oef1] [2010-03-03 13:30:37] [7c59b3cb1f989d121e67305e73d2c2d3] - RMP [Notched Boxplots] [opgave3oef1stap2] [2010-03-03 13:39:53] [06ce09a0492afa6d4f67026fd1b7902e] [Current] | |||||||||||||||||||||||||||||||||||||||||||||||||||||||||||||||
| Feedback Forum | |||||||||||||||||||||||||||||||||||||||||||||||||||||||||||||||
Post a new message | |||||||||||||||||||||||||||||||||||||||||||||||||||||||||||||||
Dataset | |||||||||||||||||||||||||||||||||||||||||||||||||||||||||||||||
| Dataseries X: | |||||||||||||||||||||||||||||||||||||||||||||||||||||||||||||||
8 10 10 13 14 12 11 8 8 10 10 12 12 12 11 12 12 12 12 12 12 10 12 10 11 10 10 12 10 12 7 12 18 12 11 13 10 10 10 8 12 10 10 8 14 9 8 12 15 14 1 9 7 8 12 57 12 10 10 8 8 16 14 13 10 12 9 12 11 10 8 8 9 12 8 12 10 12 9 8 12 8 12 10 12 9 28 10 12 9 14 12 12 99 13 13 14 12 12 10 11 12 14 10 12 12 6 12 10 12 12 12 9 12 12 13 8 12 10 10 10 9 12 9 10 8 12 10 8 8 9 12 12 10 10 9 11 10 9 15 10 8 10 8 9 9 6 16 12 12 12 12 10 12 8 9 12 12 8 14 10 12 8 11 10 12 12 12 12 8 10 7 10 10 12 11 9 10 12 14 13 10 11 10 10 8 10 10 10 8 8 4 14 8 12 12 10 8 12 12 10 10 12 12 9 11 14 10 8 12 8 10 11 12 10 10 12 8 9 12 8 8 10 10 10 14 10 12 12 13 9 12 12 10 12 6 8 12 10 9 11 11 9 10 15 12 7 7 10 9 10 10 9 12 10 9 12 10 7 12 10 10 12 8 12 10 10 9 8 8 12 12 10 12 10 9 10 10 8 10 12 12 16 10 9 12 12 10 7 12 10 10 6 9 6 18 13 10 12 15 12 12 9 7 12 13 14 13 12 8 8 10 10 8 12 10 12 12 12 9 12 7 12 8 8 12 14 10 5 9 8 13 10 10 14 10 99 10 12 17 14 8 14 12 12 10 10 8 12 12 12 10 12 10 10 12 12 12 12 13 12 8 10 12 8 10 10 12 12 12 12 12 12 14 10 12 14 12 14 12 13 8 12 14 10 10 11 16 12 10 10 99 8 11 12 12 11 10 20 9 14 12 10 12 10 12 12 8 12 12 10 99 12 2 10 10 10 12 12 12 12 88 9 12 14 8 12 10 10 10 7 8 10 1 10 10 9 15 10 12 12 12 11 12 12 14 8 12 12 10 14 8 10 12 10 10 10 12 9 12 11 8 14 12 10 12 10 8 14 12 12 12 8 12 12 10 12 12 12 9 11 10 15 10 9 9 10 7 10 9 10 10 10 15 12 12 10 12 8 12 11 8 14 8 12 10 15 9 13 12 14 12 12 17 10 13 12 12 10 12 10 12 10 10 10 1 8 12 10 10 10 12 12 11 12 8 8 12 12 10 12 9 10 12 12 12 12 10 10 9 12 10 9 12 7 14 10 10 9 10 8 10 12 12 10 9 10 9 12 10 12 10 9 7 12 11 12 9 13 12 12 7 8 12 12 12 11 12 13 10 12 10 12 12 15 12 12 13 10 10 8 11 12 12 12 12 10 10 12 15 12 10 10 7 12 10 11 10 10 10 10 11 7 15 8 10 6 8 9 8 7 10 12 14 11 8 10 8 8 14 12 15 12 12 9 12 12 9 11 15 11 12 7 15 9 10 15 15 8 11 12 10 10 12 7 12 10 11 12 10 10 8 9 8 10 10 14 10 10 12 12 7 12 10 12 9 9 13 14 10 12 12 12 12 12 10 10 8 12 8 14 10 70 12 10 8 8 11 10 8 7 8 50 9 12 12 7 10 8 10 10 10 8 12 7 13 13 8 8 11 6 12 9 12 13 13 12 12 10 8 12 10 10 15 12 10 12 8 8 12 12 10 12 9 12 12 10 9 10 10 10 12 12 12 12 8 10 12 15 10 8 15 10 9 12 99 10 10 11 11 12 12 14 12 14 9 10 12 13 10 11 10 12 12 12 13 14 9 10 10 12 12 10 99 8 99 12 99 12 10 12 10 12 12 12 10 12 12 10 10 12 99 12 12 9 99 12 12 9 12 12 12 15 12 12 12 8 8 12 8 12 12 10 10 12 99 8 8 99 10 10 5 9 9 99 9 10 12 | |||||||||||||||||||||||||||||||||||||||||||||||||||||||||||||||
Tables (Output of Computation) | |||||||||||||||||||||||||||||||||||||||||||||||||||||||||||||||
| |||||||||||||||||||||||||||||||||||||||||||||||||||||||||||||||
Figures (Output of Computation) | |||||||||||||||||||||||||||||||||||||||||||||||||||||||||||||||
Input Parameters & R Code | |||||||||||||||||||||||||||||||||||||||||||||||||||||||||||||||
| Parameters (Session): | |||||||||||||||||||||||||||||||||||||||||||||||||||||||||||||||
| par1 = grey ; | |||||||||||||||||||||||||||||||||||||||||||||||||||||||||||||||
| Parameters (R input): | |||||||||||||||||||||||||||||||||||||||||||||||||||||||||||||||
| par1 = grey ; | |||||||||||||||||||||||||||||||||||||||||||||||||||||||||||||||
| R code (references can be found in the software module): | |||||||||||||||||||||||||||||||||||||||||||||||||||||||||||||||
z <- as.data.frame(t(y)) | |||||||||||||||||||||||||||||||||||||||||||||||||||||||||||||||