Free Statistics

of Irreproducible Research!

Author's title

Author*Unverified author*
R Software Modulerwasp_autocorrelation.wasp
Title produced by software(Partial) Autocorrelation Function
Date of computationTue, 17 Aug 2010 11:13:42 +0000
Cite this page as followsStatistical Computations at FreeStatistics.org, Office for Research Development and Education, URL https://freestatistics.org/blog/index.php?v=date/2010/Aug/17/t12820436092fmi11r7n9f60gr.htm/, Retrieved Thu, 31 Oct 2024 22:45:43 +0000
Statistical Computations at FreeStatistics.org, Office for Research Development and Education, URL https://freestatistics.org/blog/index.php?pk=79084, Retrieved Thu, 31 Oct 2024 22:45:43 +0000
QR Codes:

Original text written by user:
IsPrivate?No (this computation is public)
User-defined keywordsmattias debbaut
Estimated Impact186
Family? (F = Feedback message, R = changed R code, M = changed R Module, P = changed Parameters, D = changed Data)
-       [(Partial) Autocorrelation Function] [autocorrelation F...] [2010-08-17 11:13:42] [59fa324537f53fb6459bc6951db20f7b] [Current]
Feedback Forum

Post a new message
Dataseries X:
376
375
374
372
370
369
370
372
373
373
374
376
371
374
369
363
357
366
362
366
361
362
358
363
360
360
348
345
332
333
323
327
332
337
336
337
343
337
326
321
309
302
293
287
292
292
289
302
310
295
276
264
257
243
227
226
226
229
224
240
244
226
208
199
193
180
167
164
166
173
169
191
193
166
143
147
139
129
115
108
106
116
108
135


Summary of computational transaction
Raw Inputview raw input (R code)
Raw Outputview raw output of R engine
Computing time1 seconds
R Server'George Udny Yule' @ 72.249.76.132

\begin{tabular}{lllllllll}
\hline
Summary of computational transaction \tabularnewline
Raw Input & view raw input (R code)  \tabularnewline
Raw Output & view raw output of R engine  \tabularnewline
Computing time & 1 seconds \tabularnewline
R Server & 'George Udny Yule' @ 72.249.76.132 \tabularnewline
\hline
\end{tabular}
%Source: https://freestatistics.org/blog/index.php?pk=79084&T=0

[TABLE]
[ROW][C]Summary of computational transaction[/C][/ROW]
[ROW][C]Raw Input[/C][C]view raw input (R code) [/C][/ROW]
[ROW][C]Raw Output[/C][C]view raw output of R engine [/C][/ROW]
[ROW][C]Computing time[/C][C]1 seconds[/C][/ROW]
[ROW][C]R Server[/C][C]'George Udny Yule' @ 72.249.76.132[/C][/ROW]
[/TABLE]
Source: https://freestatistics.org/blog/index.php?pk=79084&T=0

Globally Unique Identifier (entire table): ba.freestatistics.org/blog/index.php?pk=79084&T=0

As an alternative you can also use a QR Code:  

The GUIDs for individual cells are displayed in the table below:

Summary of computational transaction
Raw Inputview raw input (R code)
Raw Outputview raw output of R engine
Computing time1 seconds
R Server'George Udny Yule' @ 72.249.76.132


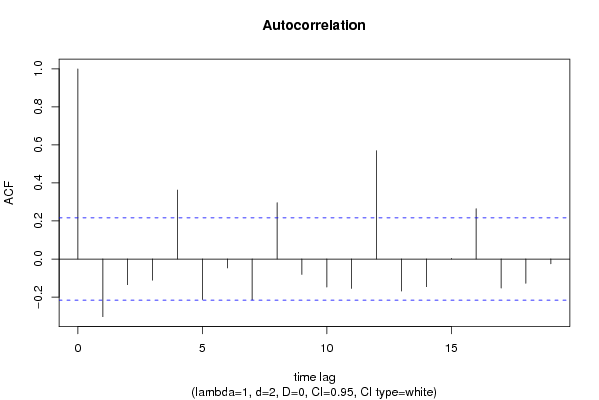
Autocorrelation Function
Time lag kACF(k)T-STATP-value
1-0.303351-2.7470.003696
2-0.134916-1.22170.112658
3-0.111397-1.00870.158033
40.3628673.28590.000749
5-0.21361-1.93430.028261
6-0.047105-0.42660.335412
7-0.214576-1.94310.02772
80.2962712.68280.004414
9-0.081372-0.73690.231658
10-0.147814-1.33850.092214
11-0.15483-1.4020.082338
120.5701365.16281e-06
13-0.168899-1.52940.065001
14-0.145505-1.31760.095654
150.0029680.02690.489311
160.2644792.3950.009451
17-0.152877-1.38440.085002
18-0.128043-1.15950.124813
19-0.025485-0.23080.409031

\begin{tabular}{lllllllll}
\hline
Autocorrelation Function \tabularnewline
Time lag k & ACF(k) & T-STAT & P-value \tabularnewline
1 & -0.303351 & -2.747 & 0.003696 \tabularnewline
2 & -0.134916 & -1.2217 & 0.112658 \tabularnewline
3 & -0.111397 & -1.0087 & 0.158033 \tabularnewline
4 & 0.362867 & 3.2859 & 0.000749 \tabularnewline
5 & -0.21361 & -1.9343 & 0.028261 \tabularnewline
6 & -0.047105 & -0.4266 & 0.335412 \tabularnewline
7 & -0.214576 & -1.9431 & 0.02772 \tabularnewline
8 & 0.296271 & 2.6828 & 0.004414 \tabularnewline
9 & -0.081372 & -0.7369 & 0.231658 \tabularnewline
10 & -0.147814 & -1.3385 & 0.092214 \tabularnewline
11 & -0.15483 & -1.402 & 0.082338 \tabularnewline
12 & 0.570136 & 5.1628 & 1e-06 \tabularnewline
13 & -0.168899 & -1.5294 & 0.065001 \tabularnewline
14 & -0.145505 & -1.3176 & 0.095654 \tabularnewline
15 & 0.002968 & 0.0269 & 0.489311 \tabularnewline
16 & 0.264479 & 2.395 & 0.009451 \tabularnewline
17 & -0.152877 & -1.3844 & 0.085002 \tabularnewline
18 & -0.128043 & -1.1595 & 0.124813 \tabularnewline
19 & -0.025485 & -0.2308 & 0.409031 \tabularnewline
\hline
\end{tabular}
%Source: https://freestatistics.org/blog/index.php?pk=79084&T=1

[TABLE]
[ROW][C]Autocorrelation Function[/C][/ROW]
[ROW][C]Time lag k[/C][C]ACF(k)[/C][C]T-STAT[/C][C]P-value[/C][/ROW]
[ROW][C]1[/C][C]-0.303351[/C][C]-2.747[/C][C]0.003696[/C][/ROW]
[ROW][C]2[/C][C]-0.134916[/C][C]-1.2217[/C][C]0.112658[/C][/ROW]
[ROW][C]3[/C][C]-0.111397[/C][C]-1.0087[/C][C]0.158033[/C][/ROW]
[ROW][C]4[/C][C]0.362867[/C][C]3.2859[/C][C]0.000749[/C][/ROW]
[ROW][C]5[/C][C]-0.21361[/C][C]-1.9343[/C][C]0.028261[/C][/ROW]
[ROW][C]6[/C][C]-0.047105[/C][C]-0.4266[/C][C]0.335412[/C][/ROW]
[ROW][C]7[/C][C]-0.214576[/C][C]-1.9431[/C][C]0.02772[/C][/ROW]
[ROW][C]8[/C][C]0.296271[/C][C]2.6828[/C][C]0.004414[/C][/ROW]
[ROW][C]9[/C][C]-0.081372[/C][C]-0.7369[/C][C]0.231658[/C][/ROW]
[ROW][C]10[/C][C]-0.147814[/C][C]-1.3385[/C][C]0.092214[/C][/ROW]
[ROW][C]11[/C][C]-0.15483[/C][C]-1.402[/C][C]0.082338[/C][/ROW]
[ROW][C]12[/C][C]0.570136[/C][C]5.1628[/C][C]1e-06[/C][/ROW]
[ROW][C]13[/C][C]-0.168899[/C][C]-1.5294[/C][C]0.065001[/C][/ROW]
[ROW][C]14[/C][C]-0.145505[/C][C]-1.3176[/C][C]0.095654[/C][/ROW]
[ROW][C]15[/C][C]0.002968[/C][C]0.0269[/C][C]0.489311[/C][/ROW]
[ROW][C]16[/C][C]0.264479[/C][C]2.395[/C][C]0.009451[/C][/ROW]
[ROW][C]17[/C][C]-0.152877[/C][C]-1.3844[/C][C]0.085002[/C][/ROW]
[ROW][C]18[/C][C]-0.128043[/C][C]-1.1595[/C][C]0.124813[/C][/ROW]
[ROW][C]19[/C][C]-0.025485[/C][C]-0.2308[/C][C]0.409031[/C][/ROW]
[/TABLE]
Source: https://freestatistics.org/blog/index.php?pk=79084&T=1

Globally Unique Identifier (entire table): ba.freestatistics.org/blog/index.php?pk=79084&T=1

As an alternative you can also use a QR Code:  

The GUIDs for individual cells are displayed in the table below:

Autocorrelation Function
Time lag kACF(k)T-STATP-value
1-0.303351-2.7470.003696
2-0.134916-1.22170.112658
3-0.111397-1.00870.158033
40.3628673.28590.000749
5-0.21361-1.93430.028261
6-0.047105-0.42660.335412
7-0.214576-1.94310.02772
80.2962712.68280.004414
9-0.081372-0.73690.231658
10-0.147814-1.33850.092214
11-0.15483-1.4020.082338
120.5701365.16281e-06
13-0.168899-1.52940.065001
14-0.145505-1.31760.095654
150.0029680.02690.489311
160.2644792.3950.009451
17-0.152877-1.38440.085002
18-0.128043-1.15950.124813
19-0.025485-0.23080.409031


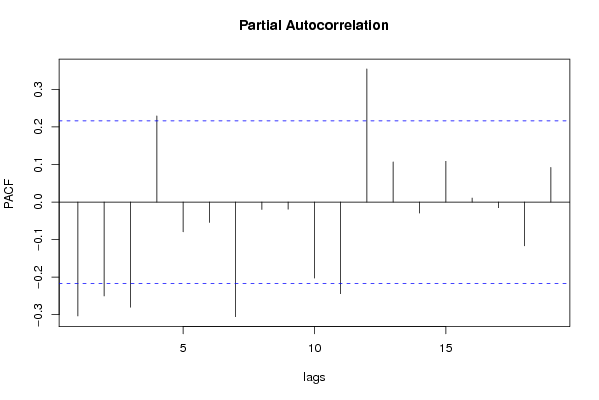
Partial Autocorrelation Function
Time lag kPACF(k)T-STATP-value
1-0.303351-2.7470.003696
2-0.249937-2.26330.013131
3-0.280022-2.53570.00656
40.2292412.07590.02052
5-0.079166-0.71690.237743
6-0.054315-0.49180.312073
7-0.305216-2.76390.003526
8-0.019707-0.17850.429403
9-0.019018-0.17220.431847
10-0.202435-1.83310.035206
11-0.243921-2.20880.01499
120.3544143.20940.00095
130.106830.96740.168097
14-0.029262-0.2650.395846
150.1086280.98370.164087
160.0105680.09570.461997
17-0.015026-0.13610.446051
18-0.116738-1.05710.146783
190.0920330.83340.203523

\begin{tabular}{lllllllll}
\hline
Partial Autocorrelation Function \tabularnewline
Time lag k & PACF(k) & T-STAT & P-value \tabularnewline
1 & -0.303351 & -2.747 & 0.003696 \tabularnewline
2 & -0.249937 & -2.2633 & 0.013131 \tabularnewline
3 & -0.280022 & -2.5357 & 0.00656 \tabularnewline
4 & 0.229241 & 2.0759 & 0.02052 \tabularnewline
5 & -0.079166 & -0.7169 & 0.237743 \tabularnewline
6 & -0.054315 & -0.4918 & 0.312073 \tabularnewline
7 & -0.305216 & -2.7639 & 0.003526 \tabularnewline
8 & -0.019707 & -0.1785 & 0.429403 \tabularnewline
9 & -0.019018 & -0.1722 & 0.431847 \tabularnewline
10 & -0.202435 & -1.8331 & 0.035206 \tabularnewline
11 & -0.243921 & -2.2088 & 0.01499 \tabularnewline
12 & 0.354414 & 3.2094 & 0.00095 \tabularnewline
13 & 0.10683 & 0.9674 & 0.168097 \tabularnewline
14 & -0.029262 & -0.265 & 0.395846 \tabularnewline
15 & 0.108628 & 0.9837 & 0.164087 \tabularnewline
16 & 0.010568 & 0.0957 & 0.461997 \tabularnewline
17 & -0.015026 & -0.1361 & 0.446051 \tabularnewline
18 & -0.116738 & -1.0571 & 0.146783 \tabularnewline
19 & 0.092033 & 0.8334 & 0.203523 \tabularnewline
\hline
\end{tabular}
%Source: https://freestatistics.org/blog/index.php?pk=79084&T=2

[TABLE]
[ROW][C]Partial Autocorrelation Function[/C][/ROW]
[ROW][C]Time lag k[/C][C]PACF(k)[/C][C]T-STAT[/C][C]P-value[/C][/ROW]
[ROW][C]1[/C][C]-0.303351[/C][C]-2.747[/C][C]0.003696[/C][/ROW]
[ROW][C]2[/C][C]-0.249937[/C][C]-2.2633[/C][C]0.013131[/C][/ROW]
[ROW][C]3[/C][C]-0.280022[/C][C]-2.5357[/C][C]0.00656[/C][/ROW]
[ROW][C]4[/C][C]0.229241[/C][C]2.0759[/C][C]0.02052[/C][/ROW]
[ROW][C]5[/C][C]-0.079166[/C][C]-0.7169[/C][C]0.237743[/C][/ROW]
[ROW][C]6[/C][C]-0.054315[/C][C]-0.4918[/C][C]0.312073[/C][/ROW]
[ROW][C]7[/C][C]-0.305216[/C][C]-2.7639[/C][C]0.003526[/C][/ROW]
[ROW][C]8[/C][C]-0.019707[/C][C]-0.1785[/C][C]0.429403[/C][/ROW]
[ROW][C]9[/C][C]-0.019018[/C][C]-0.1722[/C][C]0.431847[/C][/ROW]
[ROW][C]10[/C][C]-0.202435[/C][C]-1.8331[/C][C]0.035206[/C][/ROW]
[ROW][C]11[/C][C]-0.243921[/C][C]-2.2088[/C][C]0.01499[/C][/ROW]
[ROW][C]12[/C][C]0.354414[/C][C]3.2094[/C][C]0.00095[/C][/ROW]
[ROW][C]13[/C][C]0.10683[/C][C]0.9674[/C][C]0.168097[/C][/ROW]
[ROW][C]14[/C][C]-0.029262[/C][C]-0.265[/C][C]0.395846[/C][/ROW]
[ROW][C]15[/C][C]0.108628[/C][C]0.9837[/C][C]0.164087[/C][/ROW]
[ROW][C]16[/C][C]0.010568[/C][C]0.0957[/C][C]0.461997[/C][/ROW]
[ROW][C]17[/C][C]-0.015026[/C][C]-0.1361[/C][C]0.446051[/C][/ROW]
[ROW][C]18[/C][C]-0.116738[/C][C]-1.0571[/C][C]0.146783[/C][/ROW]
[ROW][C]19[/C][C]0.092033[/C][C]0.8334[/C][C]0.203523[/C][/ROW]
[/TABLE]
Source: https://freestatistics.org/blog/index.php?pk=79084&T=2

Globally Unique Identifier (entire table): ba.freestatistics.org/blog/index.php?pk=79084&T=2

As an alternative you can also use a QR Code:  

The GUIDs for individual cells are displayed in the table below:

Partial Autocorrelation Function
Time lag kPACF(k)T-STATP-value
1-0.303351-2.7470.003696
2-0.249937-2.26330.013131
3-0.280022-2.53570.00656
40.2292412.07590.02052
5-0.079166-0.71690.237743
6-0.054315-0.49180.312073
7-0.305216-2.76390.003526
8-0.019707-0.17850.429403
9-0.019018-0.17220.431847
10-0.202435-1.83310.035206
11-0.243921-2.20880.01499
120.3544143.20940.00095
130.106830.96740.168097
14-0.029262-0.2650.395846
150.1086280.98370.164087
160.0105680.09570.461997
17-0.015026-0.13610.446051
18-0.116738-1.05710.146783
190.0920330.83340.203523


Parameters (Session):
par1 = Default ; par2 = 1 ; par3 = 2 ; par4 = 0 ; par5 = 12 ; par6 = White Noise ; par7 = 0.95 ;
Parameters (R input):
par1 = Default ; par2 = 1 ; par3 = 2 ; par4 = 0 ; par5 = 12 ; par6 = White Noise ; par7 = 0.95 ;
R code (references can be found in the software module):
if (par1 == 'Default') {
par1 = 10*log10(length(x))
} else {
par1 <- as.numeric(par1)
}
par2 <- as.numeric(par2)
par3 <- as.numeric(par3)
par4 <- as.numeric(par4)
par5 <- as.numeric(par5)
if (par6 == 'White Noise') par6 <- 'white' else par6 <- 'ma'
par7 <- as.numeric(par7)
if (par2 == 0) {
x <- log(x)
} else {
x <- (x ^ par2 - 1) / par2
}
if (par3 > 0) x <- diff(x,lag=1,difference=par3)
if (par4 > 0) x <- diff(x,lag=par5,difference=par4)
bitmap(file='pic1.png')
racf <- acf(x, par1, main='Autocorrelation', xlab='time lag', ylab='ACF', ci.type=par6, ci=par7, sub=paste('(lambda=',par2,', d=',par3,', D=',par4,', CI=', par7, ', CI type=',par6,')',sep=''))
dev.off()
bitmap(file='pic2.png')
rpacf <- pacf(x,par1,main='Partial Autocorrelation',xlab='lags',ylab='PACF')
dev.off()
(myacf <- c(racf$acf))
(mypacf <- c(rpacf$acf))
lengthx <- length(x)
sqrtn <- sqrt(lengthx)
load(file='createtable')
a<-table.start()
a<-table.row.start(a)
a<-table.element(a,'Autocorrelation Function',4,TRUE)
a<-table.row.end(a)
a<-table.row.start(a)
a<-table.element(a,'Time lag k',header=TRUE)
a<-table.element(a,hyperlink('basics.htm','ACF(k)','click here for more information about the Autocorrelation Function'),header=TRUE)
a<-table.element(a,'T-STAT',header=TRUE)
a<-table.element(a,'P-value',header=TRUE)
a<-table.row.end(a)
for (i in 2:(par1+1)) {
a<-table.row.start(a)
a<-table.element(a,i-1,header=TRUE)
a<-table.element(a,round(myacf[i],6))
mytstat <- myacf[i]*sqrtn
a<-table.element(a,round(mytstat,4))
a<-table.element(a,round(1-pt(abs(mytstat),lengthx),6))
a<-table.row.end(a)
}
a<-table.end(a)
table.save(a,file='mytable.tab')
a<-table.start()
a<-table.row.start(a)
a<-table.element(a,'Partial Autocorrelation Function',4,TRUE)
a<-table.row.end(a)
a<-table.row.start(a)
a<-table.element(a,'Time lag k',header=TRUE)
a<-table.element(a,hyperlink('basics.htm','PACF(k)','click here for more information about the Partial Autocorrelation Function'),header=TRUE)
a<-table.element(a,'T-STAT',header=TRUE)
a<-table.element(a,'P-value',header=TRUE)
a<-table.row.end(a)
for (i in 1:par1) {
a<-table.row.start(a)
a<-table.element(a,i,header=TRUE)
a<-table.element(a,round(mypacf[i],6))
mytstat <- mypacf[i]*sqrtn
a<-table.element(a,round(mytstat,4))
a<-table.element(a,round(1-pt(abs(mytstat),lengthx),6))
a<-table.row.end(a)
}
a<-table.end(a)
table.save(a,file='mytable1.tab')