Free Statistics

of Irreproducible Research!

Author's title

Author*Unverified author*
R Software Modulerwasp_autocorrelation.wasp
Title produced by software(Partial) Autocorrelation Function
Date of computationWed, 18 Aug 2010 00:13:18 +0000
Cite this page as followsStatistical Computations at FreeStatistics.org, Office for Research Development and Education, URL https://freestatistics.org/blog/index.php?v=date/2010/Aug/18/t1282090412wbasrgswbie7ohy.htm/, Retrieved Thu, 31 Oct 2024 22:49:56 +0000
Statistical Computations at FreeStatistics.org, Office for Research Development and Education, URL https://freestatistics.org/blog/index.php?pk=79167, Retrieved Thu, 31 Oct 2024 22:49:56 +0000
QR Codes:

Original text written by user:
IsPrivate?No (this computation is public)
User-defined keywords
Estimated Impact172
Family? (F = Feedback message, R = changed R code, M = changed R Module, P = changed Parameters, D = changed Data)
-       [(Partial) Autocorrelation Function] [] [2010-08-18 00:13:18] [ea4db07d8da34007b79212461ea6aa7b] [Current]
Feedback Forum

Post a new message
Dataseries X:
158
157
156
154
152
151
152
154
155
155
156
158
155
151
152
156
147
159
152
148
146
148
142
141
139
143
146
150
141
153
142
139
134
152
142
139
137
132
137
134
127
140
127
120
112
128
119
117
115
104
108
104
98
111
104
98
91
94
82
81
70
64
71
73
71
80
72
68
60
71
62
69
55
58
67
69
71
85
76
79
69
95
94
99


Summary of computational transaction
Raw Inputview raw input (R code)
Raw Outputview raw output of R engine
Computing time1 seconds
R Server'George Udny Yule' @ 72.249.76.132

\begin{tabular}{lllllllll}
\hline
Summary of computational transaction \tabularnewline
Raw Input & view raw input (R code)  \tabularnewline
Raw Output & view raw output of R engine  \tabularnewline
Computing time & 1 seconds \tabularnewline
R Server & 'George Udny Yule' @ 72.249.76.132 \tabularnewline
\hline
\end{tabular}
%Source: https://freestatistics.org/blog/index.php?pk=79167&T=0

[TABLE]
[ROW][C]Summary of computational transaction[/C][/ROW]
[ROW][C]Raw Input[/C][C]view raw input (R code) [/C][/ROW]
[ROW][C]Raw Output[/C][C]view raw output of R engine [/C][/ROW]
[ROW][C]Computing time[/C][C]1 seconds[/C][/ROW]
[ROW][C]R Server[/C][C]'George Udny Yule' @ 72.249.76.132[/C][/ROW]
[/TABLE]
Source: https://freestatistics.org/blog/index.php?pk=79167&T=0

Globally Unique Identifier (entire table): ba.freestatistics.org/blog/index.php?pk=79167&T=0

As an alternative you can also use a QR Code:  

The GUIDs for individual cells are displayed in the table below:

Summary of computational transaction
Raw Inputview raw input (R code)
Raw Outputview raw output of R engine
Computing time1 seconds
R Server'George Udny Yule' @ 72.249.76.132


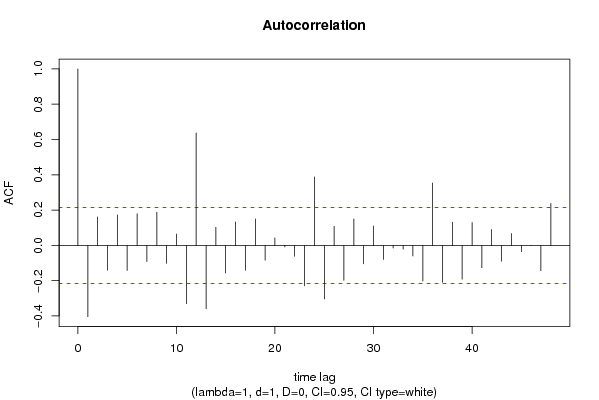
Autocorrelation Function
Time lag kACF(k)T-STATP-value
1-0.403897-3.67970.000207
20.1610451.46720.073052
3-0.140659-1.28150.1018
40.1722941.56970.060148
5-0.141671-1.29070.100198
60.1791641.63230.053207
7-0.091413-0.83280.20367
80.1883521.7160.044949
9-0.101858-0.9280.178056
100.0640940.58390.280427
11-0.33046-3.01060.001727
120.6374235.80720
13-0.359804-3.2780.000764
140.1025290.93410.176486
15-0.156127-1.42240.079331
160.1327721.20960.114931
17-0.141381-1.2880.100656
180.1501171.36760.08756
19-0.084142-0.76660.222756
200.0425530.38770.349623
21-0.008954-0.08160.467591
22-0.061879-0.56370.287223
23-0.229101-2.08720.019968
240.3878583.53360.000336
25-0.303445-2.76450.003511
260.1080130.9840.163976
27-0.198217-1.80580.037284
280.1496131.3630.088278
29-0.104416-0.95130.172113
300.1092330.99520.161275
31-0.079695-0.72610.234923
32-0.015388-0.14020.444424
33-0.02168-0.19750.421956
34-0.059531-0.54240.294515
35-0.202382-1.84380.034391
360.3535573.22110.000912
37-0.209239-1.90630.030039
380.1316661.19950.116867
39-0.191558-1.74520.042327
400.1292721.17770.121137
41-0.12641-1.15160.126386
420.0902730.82240.206595
43-0.089599-0.81630.208338
440.0670110.61050.271599
45-0.036426-0.33190.370417
460.0004130.00380.498505
47-0.143674-1.30890.097086
480.2375112.16380.016676

\begin{tabular}{lllllllll}
\hline
Autocorrelation Function \tabularnewline
Time lag k & ACF(k) & T-STAT & P-value \tabularnewline
1 & -0.403897 & -3.6797 & 0.000207 \tabularnewline
2 & 0.161045 & 1.4672 & 0.073052 \tabularnewline
3 & -0.140659 & -1.2815 & 0.1018 \tabularnewline
4 & 0.172294 & 1.5697 & 0.060148 \tabularnewline
5 & -0.141671 & -1.2907 & 0.100198 \tabularnewline
6 & 0.179164 & 1.6323 & 0.053207 \tabularnewline
7 & -0.091413 & -0.8328 & 0.20367 \tabularnewline
8 & 0.188352 & 1.716 & 0.044949 \tabularnewline
9 & -0.101858 & -0.928 & 0.178056 \tabularnewline
10 & 0.064094 & 0.5839 & 0.280427 \tabularnewline
11 & -0.33046 & -3.0106 & 0.001727 \tabularnewline
12 & 0.637423 & 5.8072 & 0 \tabularnewline
13 & -0.359804 & -3.278 & 0.000764 \tabularnewline
14 & 0.102529 & 0.9341 & 0.176486 \tabularnewline
15 & -0.156127 & -1.4224 & 0.079331 \tabularnewline
16 & 0.132772 & 1.2096 & 0.114931 \tabularnewline
17 & -0.141381 & -1.288 & 0.100656 \tabularnewline
18 & 0.150117 & 1.3676 & 0.08756 \tabularnewline
19 & -0.084142 & -0.7666 & 0.222756 \tabularnewline
20 & 0.042553 & 0.3877 & 0.349623 \tabularnewline
21 & -0.008954 & -0.0816 & 0.467591 \tabularnewline
22 & -0.061879 & -0.5637 & 0.287223 \tabularnewline
23 & -0.229101 & -2.0872 & 0.019968 \tabularnewline
24 & 0.387858 & 3.5336 & 0.000336 \tabularnewline
25 & -0.303445 & -2.7645 & 0.003511 \tabularnewline
26 & 0.108013 & 0.984 & 0.163976 \tabularnewline
27 & -0.198217 & -1.8058 & 0.037284 \tabularnewline
28 & 0.149613 & 1.363 & 0.088278 \tabularnewline
29 & -0.104416 & -0.9513 & 0.172113 \tabularnewline
30 & 0.109233 & 0.9952 & 0.161275 \tabularnewline
31 & -0.079695 & -0.7261 & 0.234923 \tabularnewline
32 & -0.015388 & -0.1402 & 0.444424 \tabularnewline
33 & -0.02168 & -0.1975 & 0.421956 \tabularnewline
34 & -0.059531 & -0.5424 & 0.294515 \tabularnewline
35 & -0.202382 & -1.8438 & 0.034391 \tabularnewline
36 & 0.353557 & 3.2211 & 0.000912 \tabularnewline
37 & -0.209239 & -1.9063 & 0.030039 \tabularnewline
38 & 0.131666 & 1.1995 & 0.116867 \tabularnewline
39 & -0.191558 & -1.7452 & 0.042327 \tabularnewline
40 & 0.129272 & 1.1777 & 0.121137 \tabularnewline
41 & -0.12641 & -1.1516 & 0.126386 \tabularnewline
42 & 0.090273 & 0.8224 & 0.206595 \tabularnewline
43 & -0.089599 & -0.8163 & 0.208338 \tabularnewline
44 & 0.067011 & 0.6105 & 0.271599 \tabularnewline
45 & -0.036426 & -0.3319 & 0.370417 \tabularnewline
46 & 0.000413 & 0.0038 & 0.498505 \tabularnewline
47 & -0.143674 & -1.3089 & 0.097086 \tabularnewline
48 & 0.237511 & 2.1638 & 0.016676 \tabularnewline
\hline
\end{tabular}
%Source: https://freestatistics.org/blog/index.php?pk=79167&T=1

[TABLE]
[ROW][C]Autocorrelation Function[/C][/ROW]
[ROW][C]Time lag k[/C][C]ACF(k)[/C][C]T-STAT[/C][C]P-value[/C][/ROW]
[ROW][C]1[/C][C]-0.403897[/C][C]-3.6797[/C][C]0.000207[/C][/ROW]
[ROW][C]2[/C][C]0.161045[/C][C]1.4672[/C][C]0.073052[/C][/ROW]
[ROW][C]3[/C][C]-0.140659[/C][C]-1.2815[/C][C]0.1018[/C][/ROW]
[ROW][C]4[/C][C]0.172294[/C][C]1.5697[/C][C]0.060148[/C][/ROW]
[ROW][C]5[/C][C]-0.141671[/C][C]-1.2907[/C][C]0.100198[/C][/ROW]
[ROW][C]6[/C][C]0.179164[/C][C]1.6323[/C][C]0.053207[/C][/ROW]
[ROW][C]7[/C][C]-0.091413[/C][C]-0.8328[/C][C]0.20367[/C][/ROW]
[ROW][C]8[/C][C]0.188352[/C][C]1.716[/C][C]0.044949[/C][/ROW]
[ROW][C]9[/C][C]-0.101858[/C][C]-0.928[/C][C]0.178056[/C][/ROW]
[ROW][C]10[/C][C]0.064094[/C][C]0.5839[/C][C]0.280427[/C][/ROW]
[ROW][C]11[/C][C]-0.33046[/C][C]-3.0106[/C][C]0.001727[/C][/ROW]
[ROW][C]12[/C][C]0.637423[/C][C]5.8072[/C][C]0[/C][/ROW]
[ROW][C]13[/C][C]-0.359804[/C][C]-3.278[/C][C]0.000764[/C][/ROW]
[ROW][C]14[/C][C]0.102529[/C][C]0.9341[/C][C]0.176486[/C][/ROW]
[ROW][C]15[/C][C]-0.156127[/C][C]-1.4224[/C][C]0.079331[/C][/ROW]
[ROW][C]16[/C][C]0.132772[/C][C]1.2096[/C][C]0.114931[/C][/ROW]
[ROW][C]17[/C][C]-0.141381[/C][C]-1.288[/C][C]0.100656[/C][/ROW]
[ROW][C]18[/C][C]0.150117[/C][C]1.3676[/C][C]0.08756[/C][/ROW]
[ROW][C]19[/C][C]-0.084142[/C][C]-0.7666[/C][C]0.222756[/C][/ROW]
[ROW][C]20[/C][C]0.042553[/C][C]0.3877[/C][C]0.349623[/C][/ROW]
[ROW][C]21[/C][C]-0.008954[/C][C]-0.0816[/C][C]0.467591[/C][/ROW]
[ROW][C]22[/C][C]-0.061879[/C][C]-0.5637[/C][C]0.287223[/C][/ROW]
[ROW][C]23[/C][C]-0.229101[/C][C]-2.0872[/C][C]0.019968[/C][/ROW]
[ROW][C]24[/C][C]0.387858[/C][C]3.5336[/C][C]0.000336[/C][/ROW]
[ROW][C]25[/C][C]-0.303445[/C][C]-2.7645[/C][C]0.003511[/C][/ROW]
[ROW][C]26[/C][C]0.108013[/C][C]0.984[/C][C]0.163976[/C][/ROW]
[ROW][C]27[/C][C]-0.198217[/C][C]-1.8058[/C][C]0.037284[/C][/ROW]
[ROW][C]28[/C][C]0.149613[/C][C]1.363[/C][C]0.088278[/C][/ROW]
[ROW][C]29[/C][C]-0.104416[/C][C]-0.9513[/C][C]0.172113[/C][/ROW]
[ROW][C]30[/C][C]0.109233[/C][C]0.9952[/C][C]0.161275[/C][/ROW]
[ROW][C]31[/C][C]-0.079695[/C][C]-0.7261[/C][C]0.234923[/C][/ROW]
[ROW][C]32[/C][C]-0.015388[/C][C]-0.1402[/C][C]0.444424[/C][/ROW]
[ROW][C]33[/C][C]-0.02168[/C][C]-0.1975[/C][C]0.421956[/C][/ROW]
[ROW][C]34[/C][C]-0.059531[/C][C]-0.5424[/C][C]0.294515[/C][/ROW]
[ROW][C]35[/C][C]-0.202382[/C][C]-1.8438[/C][C]0.034391[/C][/ROW]
[ROW][C]36[/C][C]0.353557[/C][C]3.2211[/C][C]0.000912[/C][/ROW]
[ROW][C]37[/C][C]-0.209239[/C][C]-1.9063[/C][C]0.030039[/C][/ROW]
[ROW][C]38[/C][C]0.131666[/C][C]1.1995[/C][C]0.116867[/C][/ROW]
[ROW][C]39[/C][C]-0.191558[/C][C]-1.7452[/C][C]0.042327[/C][/ROW]
[ROW][C]40[/C][C]0.129272[/C][C]1.1777[/C][C]0.121137[/C][/ROW]
[ROW][C]41[/C][C]-0.12641[/C][C]-1.1516[/C][C]0.126386[/C][/ROW]
[ROW][C]42[/C][C]0.090273[/C][C]0.8224[/C][C]0.206595[/C][/ROW]
[ROW][C]43[/C][C]-0.089599[/C][C]-0.8163[/C][C]0.208338[/C][/ROW]
[ROW][C]44[/C][C]0.067011[/C][C]0.6105[/C][C]0.271599[/C][/ROW]
[ROW][C]45[/C][C]-0.036426[/C][C]-0.3319[/C][C]0.370417[/C][/ROW]
[ROW][C]46[/C][C]0.000413[/C][C]0.0038[/C][C]0.498505[/C][/ROW]
[ROW][C]47[/C][C]-0.143674[/C][C]-1.3089[/C][C]0.097086[/C][/ROW]
[ROW][C]48[/C][C]0.237511[/C][C]2.1638[/C][C]0.016676[/C][/ROW]
[/TABLE]
Source: https://freestatistics.org/blog/index.php?pk=79167&T=1

Globally Unique Identifier (entire table): ba.freestatistics.org/blog/index.php?pk=79167&T=1

As an alternative you can also use a QR Code:  

The GUIDs for individual cells are displayed in the table below:

Autocorrelation Function
Time lag kACF(k)T-STATP-value
1-0.403897-3.67970.000207
20.1610451.46720.073052
3-0.140659-1.28150.1018
40.1722941.56970.060148
5-0.141671-1.29070.100198
60.1791641.63230.053207
7-0.091413-0.83280.20367
80.1883521.7160.044949
9-0.101858-0.9280.178056
100.0640940.58390.280427
11-0.33046-3.01060.001727
120.6374235.80720
13-0.359804-3.2780.000764
140.1025290.93410.176486
15-0.156127-1.42240.079331
160.1327721.20960.114931
17-0.141381-1.2880.100656
180.1501171.36760.08756
19-0.084142-0.76660.222756
200.0425530.38770.349623
21-0.008954-0.08160.467591
22-0.061879-0.56370.287223
23-0.229101-2.08720.019968
240.3878583.53360.000336
25-0.303445-2.76450.003511
260.1080130.9840.163976
27-0.198217-1.80580.037284
280.1496131.3630.088278
29-0.104416-0.95130.172113
300.1092330.99520.161275
31-0.079695-0.72610.234923
32-0.015388-0.14020.444424
33-0.02168-0.19750.421956
34-0.059531-0.54240.294515
35-0.202382-1.84380.034391
360.3535573.22110.000912
37-0.209239-1.90630.030039
380.1316661.19950.116867
39-0.191558-1.74520.042327
400.1292721.17770.121137
41-0.12641-1.15160.126386
420.0902730.82240.206595
43-0.089599-0.81630.208338
440.0670110.61050.271599
45-0.036426-0.33190.370417
460.0004130.00380.498505
47-0.143674-1.30890.097086
480.2375112.16380.016676


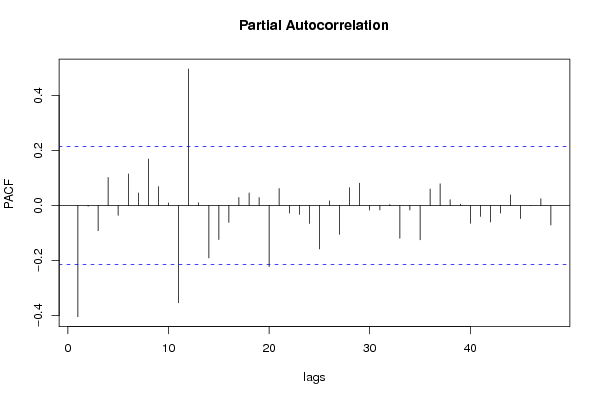
Partial Autocorrelation Function
Time lag kPACF(k)T-STATP-value
1-0.403897-3.67970.000207
2-0.002495-0.02270.490961
3-0.091363-0.83240.203797
40.1021440.93060.177386
5-0.035507-0.32350.373569
60.1149541.04730.149006
70.0458440.41770.338638
80.1689481.53920.063781
90.0689830.62850.265711
100.0092260.08410.466609
11-0.353737-3.22270.000908
120.4963424.52191e-05
130.0097550.08890.464697
14-0.190636-1.73680.043068
15-0.123798-1.12790.131315
16-0.061582-0.5610.288143
170.0293640.26750.394865
180.045790.41720.338817
190.028770.26210.396944
20-0.221674-2.01950.023329
210.0617960.5630.28748
22-0.027352-0.24920.401915
23-0.032597-0.2970.383613
24-0.064912-0.59140.277938
25-0.157779-1.43740.077177
260.0170180.1550.438584
27-0.105236-0.95870.170235
280.0648950.59120.27799
290.0809870.73780.231349
30-0.016526-0.15060.440344
31-0.015985-0.14560.442284
320.0033110.03020.488004
33-0.119156-1.08560.140408
34-0.016674-0.15190.439815
35-0.1245-1.13420.129978
360.0596680.54360.294086
370.0788220.71810.237356
380.0211280.19250.423917
390.0050180.04570.481823
40-0.064894-0.59120.277993
41-0.039889-0.36340.358614
42-0.059701-0.54390.293983
43-0.027553-0.2510.401211
440.0383830.34970.363729
45-0.047554-0.43320.332984
460.0005420.00490.498036
470.0248790.22670.410624
48-0.070995-0.64680.259774

\begin{tabular}{lllllllll}
\hline
Partial Autocorrelation Function \tabularnewline
Time lag k & PACF(k) & T-STAT & P-value \tabularnewline
1 & -0.403897 & -3.6797 & 0.000207 \tabularnewline
2 & -0.002495 & -0.0227 & 0.490961 \tabularnewline
3 & -0.091363 & -0.8324 & 0.203797 \tabularnewline
4 & 0.102144 & 0.9306 & 0.177386 \tabularnewline
5 & -0.035507 & -0.3235 & 0.373569 \tabularnewline
6 & 0.114954 & 1.0473 & 0.149006 \tabularnewline
7 & 0.045844 & 0.4177 & 0.338638 \tabularnewline
8 & 0.168948 & 1.5392 & 0.063781 \tabularnewline
9 & 0.068983 & 0.6285 & 0.265711 \tabularnewline
10 & 0.009226 & 0.0841 & 0.466609 \tabularnewline
11 & -0.353737 & -3.2227 & 0.000908 \tabularnewline
12 & 0.496342 & 4.5219 & 1e-05 \tabularnewline
13 & 0.009755 & 0.0889 & 0.464697 \tabularnewline
14 & -0.190636 & -1.7368 & 0.043068 \tabularnewline
15 & -0.123798 & -1.1279 & 0.131315 \tabularnewline
16 & -0.061582 & -0.561 & 0.288143 \tabularnewline
17 & 0.029364 & 0.2675 & 0.394865 \tabularnewline
18 & 0.04579 & 0.4172 & 0.338817 \tabularnewline
19 & 0.02877 & 0.2621 & 0.396944 \tabularnewline
20 & -0.221674 & -2.0195 & 0.023329 \tabularnewline
21 & 0.061796 & 0.563 & 0.28748 \tabularnewline
22 & -0.027352 & -0.2492 & 0.401915 \tabularnewline
23 & -0.032597 & -0.297 & 0.383613 \tabularnewline
24 & -0.064912 & -0.5914 & 0.277938 \tabularnewline
25 & -0.157779 & -1.4374 & 0.077177 \tabularnewline
26 & 0.017018 & 0.155 & 0.438584 \tabularnewline
27 & -0.105236 & -0.9587 & 0.170235 \tabularnewline
28 & 0.064895 & 0.5912 & 0.27799 \tabularnewline
29 & 0.080987 & 0.7378 & 0.231349 \tabularnewline
30 & -0.016526 & -0.1506 & 0.440344 \tabularnewline
31 & -0.015985 & -0.1456 & 0.442284 \tabularnewline
32 & 0.003311 & 0.0302 & 0.488004 \tabularnewline
33 & -0.119156 & -1.0856 & 0.140408 \tabularnewline
34 & -0.016674 & -0.1519 & 0.439815 \tabularnewline
35 & -0.1245 & -1.1342 & 0.129978 \tabularnewline
36 & 0.059668 & 0.5436 & 0.294086 \tabularnewline
37 & 0.078822 & 0.7181 & 0.237356 \tabularnewline
38 & 0.021128 & 0.1925 & 0.423917 \tabularnewline
39 & 0.005018 & 0.0457 & 0.481823 \tabularnewline
40 & -0.064894 & -0.5912 & 0.277993 \tabularnewline
41 & -0.039889 & -0.3634 & 0.358614 \tabularnewline
42 & -0.059701 & -0.5439 & 0.293983 \tabularnewline
43 & -0.027553 & -0.251 & 0.401211 \tabularnewline
44 & 0.038383 & 0.3497 & 0.363729 \tabularnewline
45 & -0.047554 & -0.4332 & 0.332984 \tabularnewline
46 & 0.000542 & 0.0049 & 0.498036 \tabularnewline
47 & 0.024879 & 0.2267 & 0.410624 \tabularnewline
48 & -0.070995 & -0.6468 & 0.259774 \tabularnewline
\hline
\end{tabular}
%Source: https://freestatistics.org/blog/index.php?pk=79167&T=2

[TABLE]
[ROW][C]Partial Autocorrelation Function[/C][/ROW]
[ROW][C]Time lag k[/C][C]PACF(k)[/C][C]T-STAT[/C][C]P-value[/C][/ROW]
[ROW][C]1[/C][C]-0.403897[/C][C]-3.6797[/C][C]0.000207[/C][/ROW]
[ROW][C]2[/C][C]-0.002495[/C][C]-0.0227[/C][C]0.490961[/C][/ROW]
[ROW][C]3[/C][C]-0.091363[/C][C]-0.8324[/C][C]0.203797[/C][/ROW]
[ROW][C]4[/C][C]0.102144[/C][C]0.9306[/C][C]0.177386[/C][/ROW]
[ROW][C]5[/C][C]-0.035507[/C][C]-0.3235[/C][C]0.373569[/C][/ROW]
[ROW][C]6[/C][C]0.114954[/C][C]1.0473[/C][C]0.149006[/C][/ROW]
[ROW][C]7[/C][C]0.045844[/C][C]0.4177[/C][C]0.338638[/C][/ROW]
[ROW][C]8[/C][C]0.168948[/C][C]1.5392[/C][C]0.063781[/C][/ROW]
[ROW][C]9[/C][C]0.068983[/C][C]0.6285[/C][C]0.265711[/C][/ROW]
[ROW][C]10[/C][C]0.009226[/C][C]0.0841[/C][C]0.466609[/C][/ROW]
[ROW][C]11[/C][C]-0.353737[/C][C]-3.2227[/C][C]0.000908[/C][/ROW]
[ROW][C]12[/C][C]0.496342[/C][C]4.5219[/C][C]1e-05[/C][/ROW]
[ROW][C]13[/C][C]0.009755[/C][C]0.0889[/C][C]0.464697[/C][/ROW]
[ROW][C]14[/C][C]-0.190636[/C][C]-1.7368[/C][C]0.043068[/C][/ROW]
[ROW][C]15[/C][C]-0.123798[/C][C]-1.1279[/C][C]0.131315[/C][/ROW]
[ROW][C]16[/C][C]-0.061582[/C][C]-0.561[/C][C]0.288143[/C][/ROW]
[ROW][C]17[/C][C]0.029364[/C][C]0.2675[/C][C]0.394865[/C][/ROW]
[ROW][C]18[/C][C]0.04579[/C][C]0.4172[/C][C]0.338817[/C][/ROW]
[ROW][C]19[/C][C]0.02877[/C][C]0.2621[/C][C]0.396944[/C][/ROW]
[ROW][C]20[/C][C]-0.221674[/C][C]-2.0195[/C][C]0.023329[/C][/ROW]
[ROW][C]21[/C][C]0.061796[/C][C]0.563[/C][C]0.28748[/C][/ROW]
[ROW][C]22[/C][C]-0.027352[/C][C]-0.2492[/C][C]0.401915[/C][/ROW]
[ROW][C]23[/C][C]-0.032597[/C][C]-0.297[/C][C]0.383613[/C][/ROW]
[ROW][C]24[/C][C]-0.064912[/C][C]-0.5914[/C][C]0.277938[/C][/ROW]
[ROW][C]25[/C][C]-0.157779[/C][C]-1.4374[/C][C]0.077177[/C][/ROW]
[ROW][C]26[/C][C]0.017018[/C][C]0.155[/C][C]0.438584[/C][/ROW]
[ROW][C]27[/C][C]-0.105236[/C][C]-0.9587[/C][C]0.170235[/C][/ROW]
[ROW][C]28[/C][C]0.064895[/C][C]0.5912[/C][C]0.27799[/C][/ROW]
[ROW][C]29[/C][C]0.080987[/C][C]0.7378[/C][C]0.231349[/C][/ROW]
[ROW][C]30[/C][C]-0.016526[/C][C]-0.1506[/C][C]0.440344[/C][/ROW]
[ROW][C]31[/C][C]-0.015985[/C][C]-0.1456[/C][C]0.442284[/C][/ROW]
[ROW][C]32[/C][C]0.003311[/C][C]0.0302[/C][C]0.488004[/C][/ROW]
[ROW][C]33[/C][C]-0.119156[/C][C]-1.0856[/C][C]0.140408[/C][/ROW]
[ROW][C]34[/C][C]-0.016674[/C][C]-0.1519[/C][C]0.439815[/C][/ROW]
[ROW][C]35[/C][C]-0.1245[/C][C]-1.1342[/C][C]0.129978[/C][/ROW]
[ROW][C]36[/C][C]0.059668[/C][C]0.5436[/C][C]0.294086[/C][/ROW]
[ROW][C]37[/C][C]0.078822[/C][C]0.7181[/C][C]0.237356[/C][/ROW]
[ROW][C]38[/C][C]0.021128[/C][C]0.1925[/C][C]0.423917[/C][/ROW]
[ROW][C]39[/C][C]0.005018[/C][C]0.0457[/C][C]0.481823[/C][/ROW]
[ROW][C]40[/C][C]-0.064894[/C][C]-0.5912[/C][C]0.277993[/C][/ROW]
[ROW][C]41[/C][C]-0.039889[/C][C]-0.3634[/C][C]0.358614[/C][/ROW]
[ROW][C]42[/C][C]-0.059701[/C][C]-0.5439[/C][C]0.293983[/C][/ROW]
[ROW][C]43[/C][C]-0.027553[/C][C]-0.251[/C][C]0.401211[/C][/ROW]
[ROW][C]44[/C][C]0.038383[/C][C]0.3497[/C][C]0.363729[/C][/ROW]
[ROW][C]45[/C][C]-0.047554[/C][C]-0.4332[/C][C]0.332984[/C][/ROW]
[ROW][C]46[/C][C]0.000542[/C][C]0.0049[/C][C]0.498036[/C][/ROW]
[ROW][C]47[/C][C]0.024879[/C][C]0.2267[/C][C]0.410624[/C][/ROW]
[ROW][C]48[/C][C]-0.070995[/C][C]-0.6468[/C][C]0.259774[/C][/ROW]
[/TABLE]
Source: https://freestatistics.org/blog/index.php?pk=79167&T=2

Globally Unique Identifier (entire table): ba.freestatistics.org/blog/index.php?pk=79167&T=2

As an alternative you can also use a QR Code:  

The GUIDs for individual cells are displayed in the table below:

Partial Autocorrelation Function
Time lag kPACF(k)T-STATP-value
1-0.403897-3.67970.000207
2-0.002495-0.02270.490961
3-0.091363-0.83240.203797
40.1021440.93060.177386
5-0.035507-0.32350.373569
60.1149541.04730.149006
70.0458440.41770.338638
80.1689481.53920.063781
90.0689830.62850.265711
100.0092260.08410.466609
11-0.353737-3.22270.000908
120.4963424.52191e-05
130.0097550.08890.464697
14-0.190636-1.73680.043068
15-0.123798-1.12790.131315
16-0.061582-0.5610.288143
170.0293640.26750.394865
180.045790.41720.338817
190.028770.26210.396944
20-0.221674-2.01950.023329
210.0617960.5630.28748
22-0.027352-0.24920.401915
23-0.032597-0.2970.383613
24-0.064912-0.59140.277938
25-0.157779-1.43740.077177
260.0170180.1550.438584
27-0.105236-0.95870.170235
280.0648950.59120.27799
290.0809870.73780.231349
30-0.016526-0.15060.440344
31-0.015985-0.14560.442284
320.0033110.03020.488004
33-0.119156-1.08560.140408
34-0.016674-0.15190.439815
35-0.1245-1.13420.129978
360.0596680.54360.294086
370.0788220.71810.237356
380.0211280.19250.423917
390.0050180.04570.481823
40-0.064894-0.59120.277993
41-0.039889-0.36340.358614
42-0.059701-0.54390.293983
43-0.027553-0.2510.401211
440.0383830.34970.363729
45-0.047554-0.43320.332984
460.0005420.00490.498036
470.0248790.22670.410624
48-0.070995-0.64680.259774


Parameters (Session):
par1 = 48 ; par2 = 1 ; par3 = 1 ; par4 = 0 ; par5 = 12 ; par6 = White Noise ; par7 = 0.95 ;
Parameters (R input):
par1 = 48 ; par2 = 1 ; par3 = 1 ; par4 = 0 ; par5 = 12 ; par6 = White Noise ; par7 = 0.95 ;
R code (references can be found in the software module):
if (par1 == 'Default') {
par1 = 10*log10(length(x))
} else {
par1 <- as.numeric(par1)
}
par2 <- as.numeric(par2)
par3 <- as.numeric(par3)
par4 <- as.numeric(par4)
par5 <- as.numeric(par5)
if (par6 == 'White Noise') par6 <- 'white' else par6 <- 'ma'
par7 <- as.numeric(par7)
if (par2 == 0) {
x <- log(x)
} else {
x <- (x ^ par2 - 1) / par2
}
if (par3 > 0) x <- diff(x,lag=1,difference=par3)
if (par4 > 0) x <- diff(x,lag=par5,difference=par4)
bitmap(file='pic1.png')
racf <- acf(x, par1, main='Autocorrelation', xlab='time lag', ylab='ACF', ci.type=par6, ci=par7, sub=paste('(lambda=',par2,', d=',par3,', D=',par4,', CI=', par7, ', CI type=',par6,')',sep=''))
dev.off()
bitmap(file='pic2.png')
rpacf <- pacf(x,par1,main='Partial Autocorrelation',xlab='lags',ylab='PACF')
dev.off()
(myacf <- c(racf$acf))
(mypacf <- c(rpacf$acf))
lengthx <- length(x)
sqrtn <- sqrt(lengthx)
load(file='createtable')
a<-table.start()
a<-table.row.start(a)
a<-table.element(a,'Autocorrelation Function',4,TRUE)
a<-table.row.end(a)
a<-table.row.start(a)
a<-table.element(a,'Time lag k',header=TRUE)
a<-table.element(a,hyperlink('basics.htm','ACF(k)','click here for more information about the Autocorrelation Function'),header=TRUE)
a<-table.element(a,'T-STAT',header=TRUE)
a<-table.element(a,'P-value',header=TRUE)
a<-table.row.end(a)
for (i in 2:(par1+1)) {
a<-table.row.start(a)
a<-table.element(a,i-1,header=TRUE)
a<-table.element(a,round(myacf[i],6))
mytstat <- myacf[i]*sqrtn
a<-table.element(a,round(mytstat,4))
a<-table.element(a,round(1-pt(abs(mytstat),lengthx),6))
a<-table.row.end(a)
}
a<-table.end(a)
table.save(a,file='mytable.tab')
a<-table.start()
a<-table.row.start(a)
a<-table.element(a,'Partial Autocorrelation Function',4,TRUE)
a<-table.row.end(a)
a<-table.row.start(a)
a<-table.element(a,'Time lag k',header=TRUE)
a<-table.element(a,hyperlink('basics.htm','PACF(k)','click here for more information about the Partial Autocorrelation Function'),header=TRUE)
a<-table.element(a,'T-STAT',header=TRUE)
a<-table.element(a,'P-value',header=TRUE)
a<-table.row.end(a)
for (i in 1:par1) {
a<-table.row.start(a)
a<-table.element(a,i,header=TRUE)
a<-table.element(a,round(mypacf[i],6))
mytstat <- mypacf[i]*sqrtn
a<-table.element(a,round(mytstat,4))
a<-table.element(a,round(1-pt(abs(mytstat),lengthx),6))
a<-table.row.end(a)
}
a<-table.end(a)
table.save(a,file='mytable1.tab')