Free Statistics

of Irreproducible Research!

Author's title

Author*The author of this computation has been verified*
R Software Modulerwasp_regression_trees1.wasp
Title produced by softwareRecursive Partitioning (Regression Trees)
Date of computationFri, 23 Dec 2011 12:16:43 -0500
Cite this page as followsStatistical Computations at FreeStatistics.org, Office for Research Development and Education, URL https://freestatistics.org/blog/index.php?v=date/2011/Dec/23/t13246607702t8euerq089191i.htm/, Retrieved Thu, 31 Oct 2024 23:37:40 +0000
Statistical Computations at FreeStatistics.org, Office for Research Development and Education, URL https://freestatistics.org/blog/index.php?pk=160599, Retrieved Thu, 31 Oct 2024 23:37:40 +0000
QR Codes:

Original text written by user:
IsPrivate?No (this computation is public)
User-defined keywords
Estimated Impact113
Family? (F = Feedback message, R = changed R code, M = changed R Module, P = changed Parameters, D = changed Data)
-     [Recursive Partitioning (Regression Trees)] [] [2010-12-05 19:35:21] [b98453cac15ba1066b407e146608df68]
- R PD  [Recursive Partitioning (Regression Trees)] [] [2011-12-12 18:21:51] [e32f7fcc4522d286f7101d32ccf9e2fd]
-   PD      [Recursive Partitioning (Regression Trees)] [RFC: analyse 1] [2011-12-23 17:16:43] [5e0d67387daac495c180286b1f543191] [Current]
Feedback Forum

Post a new message
Dataseries X:
79	94	24188	2
58	103	18273	NA
60	93	14130	NA
108	103	32287	4
49	51	8654	NA
0	70	9245	NA
121	91	33251	NA
1	22	1271	NA
20	38	5279	NA
43	93	27101	0
69	60	16373	NA
78	123	19716	0
86	148	17753	-4
44	90	9028	4
104	124	18653	4
63	70	8828	NA
158	168	29498	0
102	115	27563	-1
77	71	18293	0
82	66	22530	NA
115	134	15977	NA
101	117	35082	NA
80	108	16116	1
50	84	15849	NA
83	156	16026	NA
123	120	26569	0
73	114	24785	3
81	94	17569	NA
105	120	23825	-1
47	81	7869	NA
105	110	14975	NA
94	133	37791	NA
44	122	9605	NA
114	158	27295	NA
38	109	2746	NA
107	124	34461	4
30	39	8098	NA
71	92	4787	NA
84	126	24919	3
0	0	603	NA
59	70	16329	NA
33	37	12558	1
42	38	7784	0
96	120	28522	-2
106	93	22265	-3
56	95	14459	-4
57	77	14526	NA
59	90	22240	2
39	80	11802	NA
34	31	7623	NA
76	110	11912	2
20	66	7935	NA
91	138	18220	-4
115	133	19199	3
85	113	19918	NA
76	100	21884	NA
8	7	2694	NA
79	140	15808	NA
21	61	3597	NA
30	41	5296	NA
76	96	25239	2
101	164	29801	2
94	78	18450	0
27	49	7132	NA
92	102	34861	5
123	124	35940	NA
75	99	16688	-2
128	129	24683	0
105	62	46230	NA
55	73	10387	NA
56	114	21436	-2
41	99	30546	-3
72	70	19746	NA
67	104	15977	2
75	116	22583	NA
114	91	17274	NA
118	74	16469	NA
77	138	14251	2
22	67	3007	NA
66	151	16851	2
69	72	21113	0
105	120	17401	4
116	115	23958	4
88	105	23567	NA
73	104	13065	NA
99	108	15358	NA
62	98	14587	2
53	69	12770	NA
118	111	24021	NA
30	99	9648	NA
100	71	20537	2
49	27	7905	NA
24	69	4527	NA
67	107	30495	-4
46	73	7117	3
57	107	17719	NA
75	93	27056	NA
135	129	33473	3
68	69	9758	NA
124	118	21115	2
33	73	7236	NA
98	119	13790	NA
58	104	32902	-1
68	107	25131	-3
81	99	30910	NA
131	90	35947	NA
110	197	29848	NA
37	36	6943	0
130	85	42705	NA
93	139	31808	1
118	106	26675	NA
39	50	8435	NA
13	64	7409	NA
74	31	14993	NA
81	63	36867	NA
109	92	33835	NA
151	106	24164	NA
51	63	12607	NA
28	69	22609	NA
40	41	5892	NA
56	56	17014	-3
27	25	5394	NA
37	65	9178	NA
83	93	6440	3
54	114	21916	NA
27	38	4011	NA
28	44	5818	NA
59	87	18647	0
133	110	20556	0
12	0	238	NA
0	27	70	NA
106	83	22392	0
23	30	3913	NA
44	80	12237	NA
71	98	8388	3
116	82	22120	-3
4	0	338	NA
62	60	11727	NA
12	28	3704	NA
18	9	3988	NA
14	33	3030	NA
60	59	13520	NA
7	49	1421	NA
98	115	20923	0
64	140	20237	-4
29	49	3219	NA
32	120	3769	2
25	66	12252	-1
16	21	1888	NA
48	124	14497	NA
100	152	28864	NA
46	139	21721	3
45	38	4821	NA
129	144	33644	NA
130	120	15923	NA
136	160	42935	NA
59	114	18864	NA
25	39	4977	NA
32	78	7785	NA
63	119	17939	2
95	141	23436	5
14	101	325	NA
36	56	13539	NA
113	133	34538	2
47	83	12198	NA
92	116	26924	NA
70	90	12716	NA
19	36	8172	NA
50	50	10855	NA
41	61	11932	NA
91	97	14300	NA
111	98	25515	-2
41	78	2805	NA
120	117	29402	0
135	148	16440	NA
27	41	11221	NA
87	105	28732	3
25	55	5250	-2
131	132	28608	0
45	44	8092	NA
29	21	4473	NA
58	50	1572	NA
4	0	2065	NA
47	73	14817	6
109	86	16714	-3
7	0	556	NA
12	13	2089	NA
0	4	2658	NA
37	57	10695	NA
37	48	1669	3
46	46	16267	NA
15	48	7768	0
42	32	7252	NA
7	68	6387	NA
54	87	18715	NA
54	43	7936	-2
14	67	8643	NA
16	46	7294	1
33	46	4570	NA
32	56	7185	NA
21	48	10058	NA
15	44	2342	NA
38	60	8509	NA
22	65	13275	0
28	55	6816	NA
10	38	1930	NA
31	52	8086	NA
32	60	10737	NA
32	54	8033	NA
43	86	7058	NA
27	24	6782	NA
37	52	5401	2
20	49	6521	NA
32	61	10856	NA
0	61	2154	NA
5	81	6117	NA
26	43	5238	NA
10	40	4820	NA
27	40	5615	NA
11	56	4272	NA
29	68	8702	2
25	79	15340	NA
55	47	8030	-3
23	57	9526	NA
5	41	1278	-2
43	29	4236	NA
23	3	3023	NA
34	60	7196	NA
36	30	3394	NA
35	79	6371	NA
0	47	1574	1
37	40	9620	NA
28	48	6978	NA
16	36	4911	NA
26	42	8645	NA
38	49	8987	NA
23	57	5544	NA
22	12	3083	NA
30	40	6909	NA
16	43	3189	NA
18	33	6745	NA
28	77	16724	NA
32	43	4850	NA
21	45	7025	NA
23	47	6047	NA
29	43	7377	NA
50	45	9078	NA
12	50	4605	NA
21	35	3238	NA
18	7	8100	NA
27	71	9653	-4
41	67	8914	NA
13	0	786	NA
12	62	6700	NA
21	54	5788	NA
8	4	593	NA
26	25	4506	NA
27	40	6382	NA
13	38	5621	NA
16	19	3997	NA
2	17	520	NA
42	67	8891	NA
5	14	999	NA
37	30	7067	0
17	54	4639	NA
38	35	5654	NA
37	59	6928	NA
29	24	1514	1
32	58	9238	NA
35	42	8204	NA
17	46	5926	NA
20	61	5785	NA
7	3	4	NA
46	52	5930	NA
24	25	3710	NA
40	40	705	NA
3	32	443	NA
10	4	2416	NA
37	49	7747	NA
17	63	5432	0
28	67	4913	NA
19	32	2650	NA
29	23	2370	NA
8	7	775	NA
10	54	5576	NA
15	37	1352	NA
15	35	3080	NA
28	51	10205	NA
17	39	6095	NA


Summary of computational transaction
Raw Inputview raw input (R code)
Raw Outputview raw output of R engine
Computing time4 seconds
R Server'Gertrude Mary Cox' @ cox.wessa.net
R Framework error message
The field 'Names of X columns' contains a hard return which cannot be interpreted.
Please, resubmit your request without hard returns in the 'Names of X columns'.

\begin{tabular}{lllllllll}
\hline
Summary of computational transaction \tabularnewline
Raw Input & view raw input (R code)  \tabularnewline
Raw Output & view raw output of R engine  \tabularnewline
Computing time & 4 seconds \tabularnewline
R Server & 'Gertrude Mary Cox' @ cox.wessa.net \tabularnewline
R Framework error message & 
The field 'Names of X columns' contains a hard return which cannot be interpreted.
Please, resubmit your request without hard returns in the 'Names of X columns'.
\tabularnewline \hline \end{tabular} %Source: https://freestatistics.org/blog/index.php?pk=160599&T=0

[TABLE]
[ROW][C]Summary of computational transaction[/C][/ROW]
[ROW][C]Raw Input[/C][C]view raw input (R code) [/C][/ROW]
[ROW][C]Raw Output[/C][C]view raw output of R engine [/C][/ROW]
[ROW][C]Computing time[/C][C]4 seconds[/C][/ROW]
[ROW][C]R Server[/C][C]'Gertrude Mary Cox' @ cox.wessa.net[/C][/ROW]
[ROW][C]R Framework error message[/C][C]
The field 'Names of X columns' contains a hard return which cannot be interpreted.
Please, resubmit your request without hard returns in the 'Names of X columns'.
[/C][/ROW] [/TABLE] Source: https://freestatistics.org/blog/index.php?pk=160599&T=0

Globally Unique Identifier (entire table): ba.freestatistics.org/blog/index.php?pk=160599&T=0

As an alternative you can also use a QR Code:  

The GUIDs for individual cells are displayed in the table below:

Summary of computational transaction
Raw Inputview raw input (R code)
Raw Outputview raw output of R engine
Computing time4 seconds
R Server'Gertrude Mary Cox' @ cox.wessa.net
R Framework error message
The field 'Names of X columns' contains a hard return which cannot be interpreted.
Please, resubmit your request without hard returns in the 'Names of X columns'.


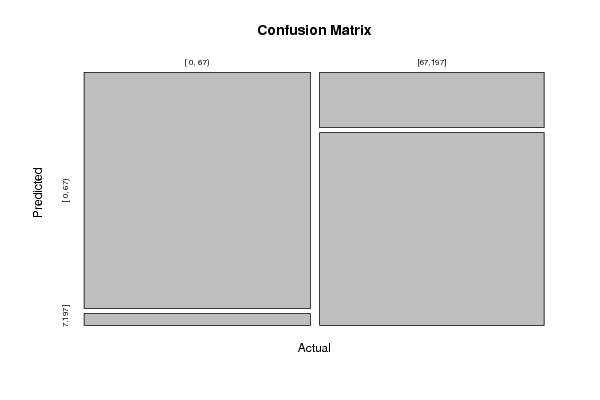
Confusion Matrix (predicted in columns / actuals in rows)
C1C2
C11387
C232112

\begin{tabular}{lllllllll}
\hline
Confusion Matrix (predicted in columns / actuals in rows) \tabularnewline
 & C1 & C2 \tabularnewline
C1 & 138 & 7 \tabularnewline
C2 & 32 & 112 \tabularnewline
\hline
\end{tabular}
%Source: https://freestatistics.org/blog/index.php?pk=160599&T=1

[TABLE]
[ROW][C]Confusion Matrix (predicted in columns / actuals in rows)[/C][/ROW]
[ROW][C][/C][C]C1[/C][C]C2[/C][/ROW]
[ROW][C]C1[/C][C]138[/C][C]7[/C][/ROW]
[ROW][C]C2[/C][C]32[/C][C]112[/C][/ROW]
[/TABLE]
Source: https://freestatistics.org/blog/index.php?pk=160599&T=1

Globally Unique Identifier (entire table): ba.freestatistics.org/blog/index.php?pk=160599&T=1

As an alternative you can also use a QR Code:  

The GUIDs for individual cells are displayed in the table below:

Confusion Matrix (predicted in columns / actuals in rows)
C1C2
C11387
C232112


Parameters (Session):
par1 = 2 ; par2 = quantiles ; par3 = 2 ; par4 = no ;
Parameters (R input):
par1 = 2 ; par2 = quantiles ; par3 = 2 ; par4 = no ;
R code (references can be found in the software module):
library(party)
library(Hmisc)
par1 <- as.numeric(par1)
par3 <- as.numeric(par3)
x <- data.frame(t(y))
is.data.frame(x)
x <- x[!is.na(x[,par1]),]
k <- length(x[1,])
n <- length(x[,1])
colnames(x)[par1]
x[,par1]
if (par2 == 'kmeans') {
cl <- kmeans(x[,par1], par3)
print(cl)
clm <- matrix(cbind(cl$centers,1:par3),ncol=2)
clm <- clm[sort.list(clm[,1]),]
for (i in 1:par3) {
cl$cluster[cl$cluster==clm[i,2]] <- paste('C',i,sep='')
}
cl$cluster <- as.factor(cl$cluster)
print(cl$cluster)
x[,par1] <- cl$cluster
}
if (par2 == 'quantiles') {
x[,par1] <- cut2(x[,par1],g=par3)
}
if (par2 == 'hclust') {
hc <- hclust(dist(x[,par1])^2, 'cen')
print(hc)
memb <- cutree(hc, k = par3)
dum <- c(mean(x[memb==1,par1]))
for (i in 2:par3) {
dum <- c(dum, mean(x[memb==i,par1]))
}
hcm <- matrix(cbind(dum,1:par3),ncol=2)
hcm <- hcm[sort.list(hcm[,1]),]
for (i in 1:par3) {
memb[memb==hcm[i,2]] <- paste('C',i,sep='')
}
memb <- as.factor(memb)
print(memb)
x[,par1] <- memb
}
if (par2=='equal') {
ed <- cut(as.numeric(x[,par1]),par3,labels=paste('C',1:par3,sep=''))
x[,par1] <- as.factor(ed)
}
table(x[,par1])
colnames(x)
colnames(x)[par1]
x[,par1]
if (par2 == 'none') {
m <- ctree(as.formula(paste(colnames(x)[par1],' ~ .',sep='')),data = x)
}
load(file='createtable')
if (par2 != 'none') {
m <- ctree(as.formula(paste('as.factor(',colnames(x)[par1],') ~ .',sep='')),data = x)
if (par4=='yes') {
a<-table.start()
a<-table.row.start(a)
a<-table.element(a,'10-Fold Cross Validation',3+2*par3,TRUE)
a<-table.row.end(a)
a<-table.row.start(a)
a<-table.element(a,'',1,TRUE)
a<-table.element(a,'Prediction (training)',par3+1,TRUE)
a<-table.element(a,'Prediction (testing)',par3+1,TRUE)
a<-table.row.end(a)
a<-table.row.start(a)
a<-table.element(a,'Actual',1,TRUE)
for (jjj in 1:par3) a<-table.element(a,paste('C',jjj,sep=''),1,TRUE)
a<-table.element(a,'CV',1,TRUE)
for (jjj in 1:par3) a<-table.element(a,paste('C',jjj,sep=''),1,TRUE)
a<-table.element(a,'CV',1,TRUE)
a<-table.row.end(a)
for (i in 1:10) {
ind <- sample(2, nrow(x), replace=T, prob=c(0.9,0.1))
m.ct <- ctree(as.formula(paste('as.factor(',colnames(x)[par1],') ~ .',sep='')),data =x[ind==1,])
if (i==1) {
m.ct.i.pred <- predict(m.ct, newdata=x[ind==1,])
m.ct.i.actu <- x[ind==1,par1]
m.ct.x.pred <- predict(m.ct, newdata=x[ind==2,])
m.ct.x.actu <- x[ind==2,par1]
} else {
m.ct.i.pred <- c(m.ct.i.pred,predict(m.ct, newdata=x[ind==1,]))
m.ct.i.actu <- c(m.ct.i.actu,x[ind==1,par1])
m.ct.x.pred <- c(m.ct.x.pred,predict(m.ct, newdata=x[ind==2,]))
m.ct.x.actu <- c(m.ct.x.actu,x[ind==2,par1])
}
}
print(m.ct.i.tab <- table(m.ct.i.actu,m.ct.i.pred))
numer <- 0
for (i in 1:par3) {
print(m.ct.i.tab[i,i] / sum(m.ct.i.tab[i,]))
numer <- numer + m.ct.i.tab[i,i]
}
print(m.ct.i.cp <- numer / sum(m.ct.i.tab))
print(m.ct.x.tab <- table(m.ct.x.actu,m.ct.x.pred))
numer <- 0
for (i in 1:par3) {
print(m.ct.x.tab[i,i] / sum(m.ct.x.tab[i,]))
numer <- numer + m.ct.x.tab[i,i]
}
print(m.ct.x.cp <- numer / sum(m.ct.x.tab))
for (i in 1:par3) {
a<-table.row.start(a)
a<-table.element(a,paste('C',i,sep=''),1,TRUE)
for (jjj in 1:par3) a<-table.element(a,m.ct.i.tab[i,jjj])
a<-table.element(a,round(m.ct.i.tab[i,i]/sum(m.ct.i.tab[i,]),4))
for (jjj in 1:par3) a<-table.element(a,m.ct.x.tab[i,jjj])
a<-table.element(a,round(m.ct.x.tab[i,i]/sum(m.ct.x.tab[i,]),4))
a<-table.row.end(a)
}
a<-table.row.start(a)
a<-table.element(a,'Overall',1,TRUE)
for (jjj in 1:par3) a<-table.element(a,'-')
a<-table.element(a,round(m.ct.i.cp,4))
for (jjj in 1:par3) a<-table.element(a,'-')
a<-table.element(a,round(m.ct.x.cp,4))
a<-table.row.end(a)
a<-table.end(a)
table.save(a,file='mytable3.tab')
}
}
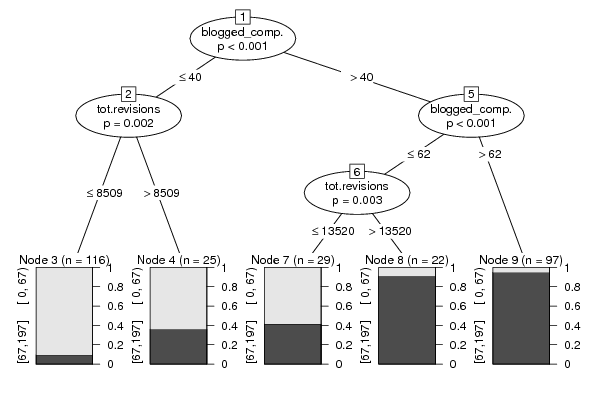
m
bitmap(file='test1.png')
plot(m)
dev.off()
bitmap(file='test1a.png')
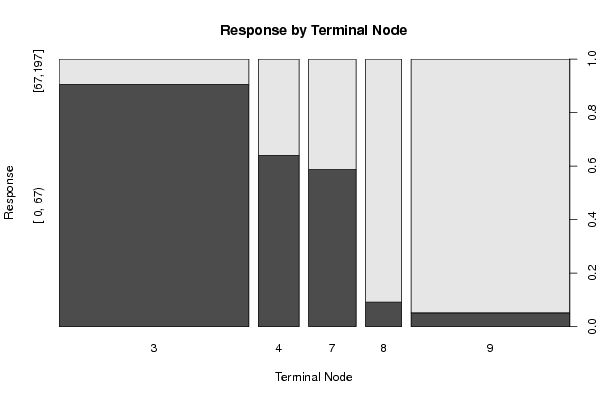
plot(x[,par1] ~ as.factor(where(m)),main='Response by Terminal Node',xlab='Terminal Node',ylab='Response')
dev.off()
if (par2 == 'none') {
forec <- predict(m)
result <- as.data.frame(cbind(x[,par1],forec,x[,par1]-forec))
colnames(result) <- c('Actuals','Forecasts','Residuals')
print(result)
}
if (par2 != 'none') {
print(cbind(as.factor(x[,par1]),predict(m)))
myt <- table(as.factor(x[,par1]),predict(m))
print(myt)
}
bitmap(file='test2.png')
if(par2=='none') {
op <- par(mfrow=c(2,2))
plot(density(result$Actuals),main='Kernel Density Plot of Actuals')
plot(density(result$Residuals),main='Kernel Density Plot of Residuals')
plot(result$Forecasts,result$Actuals,main='Actuals versus Predictions',xlab='Predictions',ylab='Actuals')
plot(density(result$Forecasts),main='Kernel Density Plot of Predictions')
par(op)
}
if(par2!='none') {
plot(myt,main='Confusion Matrix',xlab='Actual',ylab='Predicted')
}
dev.off()
if (par2 == 'none') {
detcoef <- cor(result$Forecasts,result$Actuals)
a<-table.start()
a<-table.row.start(a)
a<-table.element(a,'Goodness of Fit',2,TRUE)
a<-table.row.end(a)
a<-table.row.start(a)
a<-table.element(a,'Correlation',1,TRUE)
a<-table.element(a,round(detcoef,4))
a<-table.row.end(a)
a<-table.row.start(a)
a<-table.element(a,'R-squared',1,TRUE)
a<-table.element(a,round(detcoef*detcoef,4))
a<-table.row.end(a)
a<-table.row.start(a)
a<-table.element(a,'RMSE',1,TRUE)
a<-table.element(a,round(sqrt(mean((result$Residuals)^2)),4))
a<-table.row.end(a)
a<-table.end(a)
table.save(a,file='mytable1.tab')
a<-table.start()
a<-table.row.start(a)
a<-table.element(a,'Actuals, Predictions, and Residuals',4,TRUE)
a<-table.row.end(a)
a<-table.row.start(a)
a<-table.element(a,'#',header=TRUE)
a<-table.element(a,'Actuals',header=TRUE)
a<-table.element(a,'Forecasts',header=TRUE)
a<-table.element(a,'Residuals',header=TRUE)
a<-table.row.end(a)
for (i in 1:length(result$Actuals)) {
a<-table.row.start(a)
a<-table.element(a,i,header=TRUE)
a<-table.element(a,result$Actuals[i])
a<-table.element(a,result$Forecasts[i])
a<-table.element(a,result$Residuals[i])
a<-table.row.end(a)
}
a<-table.end(a)
table.save(a,file='mytable.tab')
}
if (par2 != 'none') {
a<-table.start()
a<-table.row.start(a)
a<-table.element(a,'Confusion Matrix (predicted in columns / actuals in rows)',par3+1,TRUE)
a<-table.row.end(a)
a<-table.row.start(a)
a<-table.element(a,'',1,TRUE)
for (i in 1:par3) {
a<-table.element(a,paste('C',i,sep=''),1,TRUE)
}
a<-table.row.end(a)
for (i in 1:par3) {
a<-table.row.start(a)
a<-table.element(a,paste('C',i,sep=''),1,TRUE)
for (j in 1:par3) {
a<-table.element(a,myt[i,j])
}
a<-table.row.end(a)
}
a<-table.end(a)
table.save(a,file='mytable2.tab')
}