If you paste this QR Code into your document, anyone with a smartphone or tablet will be able to scan it and view this table in a browser.
If you paste this QR Code into your document, anyone with a smartphone or tablet will be able to scan it and view this table in a browser.
If you paste this QR Code into your document, anyone with a smartphone or tablet will be able to scan it and view this table in a browser.
If you paste this QR Code into your document, anyone with a smartphone or tablet will be able to scan it and view this table in a browser.
If you paste this QR Code into your document, anyone with a smartphone or tablet will be able to scan it and view this table in a browser.
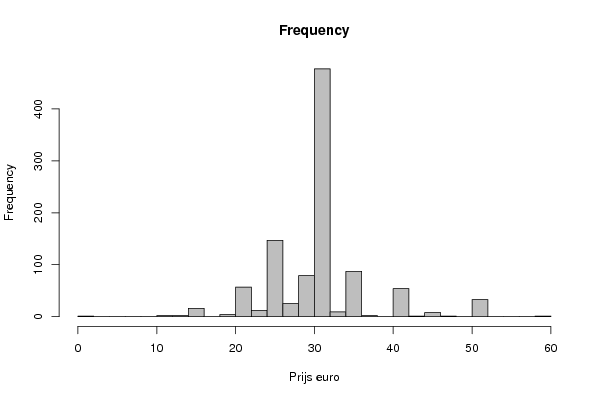
| Frequency Table (Histogram) | | Bins | Midpoint | Abs. Frequency | Rel. Frequency | Cumul. Rel. Freq. | Density | | [0,2[ | 1 | 1 | 0.000982 | 0.000982 | 0.000491 | | [2,4[ | 3 | 0 | 0 | 0.000982 | 0 | | [4,6[ | 5 | 0 | 0 | 0.000982 | 0 | | [6,8[ | 7 | 0 | 0 | 0.000982 | 0 | | [8,10[ | 9 | 0 | 0 | 0.000982 | 0 | | [10,12[ | 11 | 2 | 0.001965 | 0.002947 | 0.000982 | | [12,14[ | 13 | 2 | 0.001965 | 0.004912 | 0.000982 | | [14,16[ | 15 | 16 | 0.015717 | 0.020629 | 0.007859 | | [16,18[ | 17 | 0 | 0 | 0.020629 | 0 | | [18,20[ | 19 | 4 | 0.003929 | 0.024558 | 0.001965 | | [20,22[ | 21 | 57 | 0.055992 | 0.08055 | 0.027996 | | [22,24[ | 23 | 12 | 0.011788 | 0.092338 | 0.005894 | | [24,26[ | 25 | 147 | 0.144401 | 0.236739 | 0.0722 | | [26,28[ | 27 | 25 | 0.024558 | 0.261297 | 0.012279 | | [28,30[ | 29 | 79 | 0.077603 | 0.3389 | 0.038802 | | [30,32[ | 31 | 477 | 0.468566 | 0.807466 | 0.234283 | | [32,34[ | 33 | 9 | 0.008841 | 0.816306 | 0.00442 | | [34,36[ | 35 | 87 | 0.085462 | 0.901768 | 0.042731 | | [36,38[ | 37 | 2 | 0.001965 | 0.903733 | 0.000982 | | [38,40[ | 39 | 0 | 0 | 0.903733 | 0 | | [40,42[ | 41 | 54 | 0.053045 | 0.956778 | 0.026523 | | [42,44[ | 43 | 1 | 0.000982 | 0.95776 | 0.000491 | | [44,46[ | 45 | 8 | 0.007859 | 0.965619 | 0.003929 | | [46,48[ | 47 | 1 | 0.000982 | 0.966601 | 0.000491 | | [48,50[ | 49 | 0 | 0 | 0.966601 | 0 | | [50,52[ | 51 | 33 | 0.032417 | 0.999018 | 0.016208 | | [52,54[ | 53 | 0 | 0 | 0.999018 | 0 | | [54,56[ | 55 | 0 | 0 | 0.999018 | 0 | | [56,58[ | 57 | 0 | 0 | 0.999018 | 0 | | [58,60] | 59 | 1 | 0.000982 | 1 | 0.000491 |
\begin{tabular}{lllllllll}
\hline
Frequency Table (Histogram) \tabularnewline
Bins & Midpoint & Abs. Frequency & Rel. Frequency & Cumul. Rel. Freq. & Density \tabularnewline
[0,2[ & 1 & 1 & 0.000982 & 0.000982 & 0.000491 \tabularnewline
[2,4[ & 3 & 0 & 0 & 0.000982 & 0 \tabularnewline
[4,6[ & 5 & 0 & 0 & 0.000982 & 0 \tabularnewline
[6,8[ & 7 & 0 & 0 & 0.000982 & 0 \tabularnewline
[8,10[ & 9 & 0 & 0 & 0.000982 & 0 \tabularnewline
[10,12[ & 11 & 2 & 0.001965 & 0.002947 & 0.000982 \tabularnewline
[12,14[ & 13 & 2 & 0.001965 & 0.004912 & 0.000982 \tabularnewline
[14,16[ & 15 & 16 & 0.015717 & 0.020629 & 0.007859 \tabularnewline
[16,18[ & 17 & 0 & 0 & 0.020629 & 0 \tabularnewline
[18,20[ & 19 & 4 & 0.003929 & 0.024558 & 0.001965 \tabularnewline
[20,22[ & 21 & 57 & 0.055992 & 0.08055 & 0.027996 \tabularnewline
[22,24[ & 23 & 12 & 0.011788 & 0.092338 & 0.005894 \tabularnewline
[24,26[ & 25 & 147 & 0.144401 & 0.236739 & 0.0722 \tabularnewline
[26,28[ & 27 & 25 & 0.024558 & 0.261297 & 0.012279 \tabularnewline
[28,30[ & 29 & 79 & 0.077603 & 0.3389 & 0.038802 \tabularnewline
[30,32[ & 31 & 477 & 0.468566 & 0.807466 & 0.234283 \tabularnewline
[32,34[ & 33 & 9 & 0.008841 & 0.816306 & 0.00442 \tabularnewline
[34,36[ & 35 & 87 & 0.085462 & 0.901768 & 0.042731 \tabularnewline
[36,38[ & 37 & 2 & 0.001965 & 0.903733 & 0.000982 \tabularnewline
[38,40[ & 39 & 0 & 0 & 0.903733 & 0 \tabularnewline
[40,42[ & 41 & 54 & 0.053045 & 0.956778 & 0.026523 \tabularnewline
[42,44[ & 43 & 1 & 0.000982 & 0.95776 & 0.000491 \tabularnewline
[44,46[ & 45 & 8 & 0.007859 & 0.965619 & 0.003929 \tabularnewline
[46,48[ & 47 & 1 & 0.000982 & 0.966601 & 0.000491 \tabularnewline
[48,50[ & 49 & 0 & 0 & 0.966601 & 0 \tabularnewline
[50,52[ & 51 & 33 & 0.032417 & 0.999018 & 0.016208 \tabularnewline
[52,54[ & 53 & 0 & 0 & 0.999018 & 0 \tabularnewline
[54,56[ & 55 & 0 & 0 & 0.999018 & 0 \tabularnewline
[56,58[ & 57 & 0 & 0 & 0.999018 & 0 \tabularnewline
[58,60] & 59 & 1 & 0.000982 & 1 & 0.000491 \tabularnewline
\hline
\end{tabular}
%Source: https://freestatistics.org/blog/index.php?pk=162645&T=1
[TABLE]
[ROW][C]Frequency Table (Histogram)[/C][/ROW]
[ROW][C]Bins[/C][C]Midpoint[/C][C]Abs. Frequency[/C][C]Rel. Frequency[/C][C]Cumul. Rel. Freq.[/C][C]Density[/C][/ROW]
[ROW][C][0,2[[/C][C]1[/C][C]1[/C][C]0.000982[/C][C]0.000982[/C][C]0.000491[/C][/ROW]
[ROW][C][2,4[[/C][C]3[/C][C]0[/C][C]0[/C][C]0.000982[/C][C]0[/C][/ROW]
[ROW][C][4,6[[/C][C]5[/C][C]0[/C][C]0[/C][C]0.000982[/C][C]0[/C][/ROW]
[ROW][C][6,8[[/C][C]7[/C][C]0[/C][C]0[/C][C]0.000982[/C][C]0[/C][/ROW]
[ROW][C][8,10[[/C][C]9[/C][C]0[/C][C]0[/C][C]0.000982[/C][C]0[/C][/ROW]
[ROW][C][10,12[[/C][C]11[/C][C]2[/C][C]0.001965[/C][C]0.002947[/C][C]0.000982[/C][/ROW]
[ROW][C][12,14[[/C][C]13[/C][C]2[/C][C]0.001965[/C][C]0.004912[/C][C]0.000982[/C][/ROW]
[ROW][C][14,16[[/C][C]15[/C][C]16[/C][C]0.015717[/C][C]0.020629[/C][C]0.007859[/C][/ROW]
[ROW][C][16,18[[/C][C]17[/C][C]0[/C][C]0[/C][C]0.020629[/C][C]0[/C][/ROW]
[ROW][C][18,20[[/C][C]19[/C][C]4[/C][C]0.003929[/C][C]0.024558[/C][C]0.001965[/C][/ROW]
[ROW][C][20,22[[/C][C]21[/C][C]57[/C][C]0.055992[/C][C]0.08055[/C][C]0.027996[/C][/ROW]
[ROW][C][22,24[[/C][C]23[/C][C]12[/C][C]0.011788[/C][C]0.092338[/C][C]0.005894[/C][/ROW]
[ROW][C][24,26[[/C][C]25[/C][C]147[/C][C]0.144401[/C][C]0.236739[/C][C]0.0722[/C][/ROW]
[ROW][C][26,28[[/C][C]27[/C][C]25[/C][C]0.024558[/C][C]0.261297[/C][C]0.012279[/C][/ROW]
[ROW][C][28,30[[/C][C]29[/C][C]79[/C][C]0.077603[/C][C]0.3389[/C][C]0.038802[/C][/ROW]
[ROW][C][30,32[[/C][C]31[/C][C]477[/C][C]0.468566[/C][C]0.807466[/C][C]0.234283[/C][/ROW]
[ROW][C][32,34[[/C][C]33[/C][C]9[/C][C]0.008841[/C][C]0.816306[/C][C]0.00442[/C][/ROW]
[ROW][C][34,36[[/C][C]35[/C][C]87[/C][C]0.085462[/C][C]0.901768[/C][C]0.042731[/C][/ROW]
[ROW][C][36,38[[/C][C]37[/C][C]2[/C][C]0.001965[/C][C]0.903733[/C][C]0.000982[/C][/ROW]
[ROW][C][38,40[[/C][C]39[/C][C]0[/C][C]0[/C][C]0.903733[/C][C]0[/C][/ROW]
[ROW][C][40,42[[/C][C]41[/C][C]54[/C][C]0.053045[/C][C]0.956778[/C][C]0.026523[/C][/ROW]
[ROW][C][42,44[[/C][C]43[/C][C]1[/C][C]0.000982[/C][C]0.95776[/C][C]0.000491[/C][/ROW]
[ROW][C][44,46[[/C][C]45[/C][C]8[/C][C]0.007859[/C][C]0.965619[/C][C]0.003929[/C][/ROW]
[ROW][C][46,48[[/C][C]47[/C][C]1[/C][C]0.000982[/C][C]0.966601[/C][C]0.000491[/C][/ROW]
[ROW][C][48,50[[/C][C]49[/C][C]0[/C][C]0[/C][C]0.966601[/C][C]0[/C][/ROW]
[ROW][C][50,52[[/C][C]51[/C][C]33[/C][C]0.032417[/C][C]0.999018[/C][C]0.016208[/C][/ROW]
[ROW][C][52,54[[/C][C]53[/C][C]0[/C][C]0[/C][C]0.999018[/C][C]0[/C][/ROW]
[ROW][C][54,56[[/C][C]55[/C][C]0[/C][C]0[/C][C]0.999018[/C][C]0[/C][/ROW]
[ROW][C][56,58[[/C][C]57[/C][C]0[/C][C]0[/C][C]0.999018[/C][C]0[/C][/ROW]
[ROW][C][58,60][/C][C]59[/C][C]1[/C][C]0.000982[/C][C]1[/C][C]0.000491[/C][/ROW]
[/TABLE]
Source: https://freestatistics.org/blog/index.php?pk=162645&T=1
Globally Unique Identifier (entire table): ba.freestatistics.org/blog/index.php?pk=162645&T=1
As an alternative you can also use a QR Code:
The GUIDs for individual cells are displayed in the table below:
| Frequency Table (Histogram) | | Bins | Midpoint | Abs. Frequency | Rel. Frequency | Cumul. Rel. Freq. | Density | | [0,2[ | 1 | 1 | 0.000982 | 0.000982 | 0.000491 | | [2,4[ | 3 | 0 | 0 | 0.000982 | 0 | | [4,6[ | 5 | 0 | 0 | 0.000982 | 0 | | [6,8[ | 7 | 0 | 0 | 0.000982 | 0 | | [8,10[ | 9 | 0 | 0 | 0.000982 | 0 | | [10,12[ | 11 | 2 | 0.001965 | 0.002947 | 0.000982 | | [12,14[ | 13 | 2 | 0.001965 | 0.004912 | 0.000982 | | [14,16[ | 15 | 16 | 0.015717 | 0.020629 | 0.007859 | | [16,18[ | 17 | 0 | 0 | 0.020629 | 0 | | [18,20[ | 19 | 4 | 0.003929 | 0.024558 | 0.001965 | | [20,22[ | 21 | 57 | 0.055992 | 0.08055 | 0.027996 | | [22,24[ | 23 | 12 | 0.011788 | 0.092338 | 0.005894 | | [24,26[ | 25 | 147 | 0.144401 | 0.236739 | 0.0722 | | [26,28[ | 27 | 25 | 0.024558 | 0.261297 | 0.012279 | | [28,30[ | 29 | 79 | 0.077603 | 0.3389 | 0.038802 | | [30,32[ | 31 | 477 | 0.468566 | 0.807466 | 0.234283 | | [32,34[ | 33 | 9 | 0.008841 | 0.816306 | 0.00442 | | [34,36[ | 35 | 87 | 0.085462 | 0.901768 | 0.042731 | | [36,38[ | 37 | 2 | 0.001965 | 0.903733 | 0.000982 | | [38,40[ | 39 | 0 | 0 | 0.903733 | 0 | | [40,42[ | 41 | 54 | 0.053045 | 0.956778 | 0.026523 | | [42,44[ | 43 | 1 | 0.000982 | 0.95776 | 0.000491 | | [44,46[ | 45 | 8 | 0.007859 | 0.965619 | 0.003929 | | [46,48[ | 47 | 1 | 0.000982 | 0.966601 | 0.000491 | | [48,50[ | 49 | 0 | 0 | 0.966601 | 0 | | [50,52[ | 51 | 33 | 0.032417 | 0.999018 | 0.016208 | | [52,54[ | 53 | 0 | 0 | 0.999018 | 0 | | [54,56[ | 55 | 0 | 0 | 0.999018 | 0 | | [56,58[ | 57 | 0 | 0 | 0.999018 | 0 | | [58,60] | 59 | 1 | 0.000982 | 1 | 0.000491 |
If you paste this QR Code into your document, anyone with a smartphone or tablet will be able to scan it and view this table in a browser.
If you paste this QR Code into your document, anyone with a smartphone or tablet will be able to scan it and view this table in a browser.
If you paste this QR Code into your document, anyone with a smartphone or tablet will be able to scan it and view this table in a browser.
If you paste this QR Code into your document, anyone with a smartphone or tablet will be able to scan it and view this table in a browser.
If you paste this QR Code into your document, anyone with a smartphone or tablet will be able to scan it and view this table in a browser.
|