myxlabs <- 'NA'
image.plot <- function (..., add = FALSE, nlevel = 64, horizontal = FALSE,
legend.shrink = 0.9, legend.width = 1.2, legend.mar = ifelse(horizontal,
3.1, 5.1), legend.lab = NULL, graphics.reset = FALSE,
bigplot = NULL, smallplot = NULL, legend.only = FALSE, col = tim.colors(nlevel),
lab.breaks = NULL, axis.args = NULL, legend.args = NULL,
midpoint = FALSE)
{
old.par <- par(no.readonly = TRUE)
info <- image.plot.info(...)
if (add) {
big.plot <- old.par$plt
}
if (legend.only) {
graphics.reset <- TRUE
}
if (is.null(legend.mar)) {
legend.mar <- ifelse(horizontal, 3.1, 5.1)
}
temp <- image.plot.plt(add = add, legend.shrink = legend.shrink,
legend.width = legend.width, legend.mar = legend.mar,
horizontal = horizontal, bigplot = bigplot, smallplot = smallplot)
smallplot <- temp$smallplot
bigplot <- temp$bigplot
if (!legend.only) {
if (!add) {
par(plt = bigplot)
}
if (!info$poly.grid) {
image(..., add = add, col = col)
}
else {
poly.image(..., add = add, col = col, midpoint = midpoint)
}
big.par <- par(no.readonly = TRUE)
}
if ((smallplot[2] < smallplot[1]) | (smallplot[4] < smallplot[3])) {
par(old.par)
stop('plot region too small to add legend
')
}
ix <- 1
minz <- info$zlim[1]
maxz <- info$zlim[2]
binwidth <- (maxz - minz)/nlevel
midpoints <- seq(minz + binwidth/2, maxz - binwidth/2, by = binwidth)
iy <- midpoints
iz <- matrix(iy, nrow = 1, ncol = length(iy))
breaks <- list(...)$breaks
par(new = TRUE, pty = 'm', plt = smallplot, err = -1)
if (is.null(breaks)) {
axis.args <- c(list(side = ifelse(horizontal, 1, 4),
mgp = c(3, 1, 0), las = ifelse(horizontal, 0, 2)),
axis.args)
}
else {
if (is.null(lab.breaks)) {
lab.breaks <- format(breaks)
}
axis.args <- c(list(side = ifelse(horizontal, 1, 4),
mgp = c(3, 1, 0), las = ifelse(horizontal, 0, 2),
at = breaks, labels = lab.breaks), axis.args)
}
if (!horizontal) {
if (is.null(breaks)) {
image(ix, iy, iz, xaxt = 'n', yaxt = 'n', xlab = '',
ylab = '', col = col)
}
else {
image(ix, iy, iz, xaxt = 'n', yaxt = 'n', xlab = '',
ylab = '', col = col, breaks = breaks)
}
}
else {
if (is.null(breaks)) {
image(iy, ix, t(iz), xaxt = 'n', yaxt = 'n', xlab = '',
ylab = '', col = col)
}
else {
image(iy, ix, t(iz), xaxt = 'n', yaxt = 'n', xlab = '',
ylab = '', col = col, breaks = breaks)
}
}
box()
if (!is.null(legend.lab)) {
legend.args <- list(text = legend.lab, side = ifelse(horizontal,
1, 4), line = legend.mar - 2)
}
if (!is.null(legend.args)) {
}
mfg.save <- par()$mfg
if (graphics.reset | add) {
par(old.par)
par(mfg = mfg.save, new = FALSE)
invisible()
}
else {
par(big.par)
par(plt = big.par$plt, xpd = FALSE)
par(mfg = mfg.save, new = FALSE)
invisible()
}
}
image.plot.plt <- function (x, add = FALSE, legend.shrink = 0.9, legend.width = 1,
horizontal = FALSE, legend.mar = NULL, bigplot = NULL, smallplot = NULL,
...)
{
old.par <- par(no.readonly = TRUE)
if (is.null(smallplot))
stick <- TRUE
else stick <- FALSE
if (is.null(legend.mar)) {
legend.mar <- ifelse(horizontal, 3.1, 5.1)
}
char.size <- ifelse(horizontal, par()$cin[2]/par()$din[2],
par()$cin[1]/par()$din[1])
offset <- char.size * ifelse(horizontal, par()$mar[1], par()$mar[4])
legend.width <- char.size * legend.width
legend.mar <- legend.mar * char.size
if (is.null(smallplot)) {
smallplot <- old.par$plt
if (horizontal) {
smallplot[3] <- legend.mar
smallplot[4] <- legend.width + smallplot[3]
pr <- (smallplot[2] - smallplot[1]) * ((1 - legend.shrink)/2)
smallplot[1] <- smallplot[1] + pr
smallplot[2] <- smallplot[2] - pr
}
else {
smallplot[2] <- 1 - legend.mar
smallplot[1] <- smallplot[2] - legend.width
pr <- (smallplot[4] - smallplot[3]) * ((1 - legend.shrink)/2)
smallplot[4] <- smallplot[4] - pr
smallplot[3] <- smallplot[3] + pr
}
}
if (is.null(bigplot)) {
bigplot <- old.par$plt
if (!horizontal) {
bigplot[2] <- min(bigplot[2], smallplot[1] - offset)
}
else {
bottom.space <- old.par$mar[1] * char.size
bigplot[3] <- smallplot[4] + offset
}
}
if (stick & (!horizontal)) {
dp <- smallplot[2] - smallplot[1]
smallplot[1] <- min(bigplot[2] + offset, smallplot[1])
smallplot[2] <- smallplot[1] + dp
}
return(list(smallplot = smallplot, bigplot = bigplot))
}
image.plot.info <- function (...)
{
temp <- list(...)
xlim <- NA
ylim <- NA
zlim <- NA
poly.grid <- FALSE
if (is.list(temp[[1]])) {
xlim <- range(temp[[1]]$x, na.rm = TRUE)
ylim <- range(temp[[1]]$y, na.rm = TRUE)
zlim <- range(temp[[1]]$z, na.rm = TRUE)
if (is.matrix(temp[[1]]$x) & is.matrix(temp[[1]]$y) &
is.matrix(temp[[1]]$z)) {
poly.grid <- TRUE
}
}
if (length(temp) >= 3) {
if (is.matrix(temp[[1]]) & is.matrix(temp[[2]]) & is.matrix(temp[[3]])) {
poly.grid <- TRUE
}
}
if (is.matrix(temp[[1]]) & !poly.grid) {
xlim <- c(0, 1)
ylim <- c(0, 1)
zlim <- range(temp[[1]], na.rm = TRUE)
}
if (length(temp) >= 3) {
if (is.matrix(temp[[3]])) {
xlim <- range(temp[[1]], na.rm = TRUE)
ylim <- range(temp[[2]], na.rm = TRUE)
zlim <- range(temp[[3]], na.rm = TRUE)
}
}
if (is.matrix(temp$x) & is.matrix(temp$y) & is.matrix(temp$z)) {
poly.grid <- TRUE
}
xthere <- match('x', names(temp))
ythere <- match('y', names(temp))
zthere <- match('z', names(temp))
if (!is.na(zthere))
zlim <- range(temp$z, na.rm = TRUE)
if (!is.na(xthere))
xlim <- range(temp$x, na.rm = TRUE)
if (!is.na(ythere))
ylim <- range(temp$y, na.rm = TRUE)
if (!is.null(temp$zlim))
zlim <- temp$zlim
if (!is.null(temp$xlim))
xlim <- temp$xlim
if (!is.null(temp$ylim))
ylim <- temp$ylim
list(xlim = xlim, ylim = ylim, zlim = zlim, poly.grid = poly.grid)
}
matcor <- function (X, Y, method='kendall') {
matcorX = cor(X, use = 'pairwise', method=method)
matcorY = cor(Y, use = 'pairwise', method=method)
matcorXY = cor(cbind(X, Y), use = 'pairwise', method=method)
return(list(Xcor = matcorX, Ycor = matcorY, XYcor = matcorXY))
}
matcor.p <- function (X, Y, method='kendall') {
lx <- length(X[1,])
ly <- length(Y[1,])
myretarr <- array(NA,dim=c(lx,ly))
mymetaarr.x <- array(0,dim=c(lx,10))
mymetaarr.y <- array(0,dim=c(ly,10))
mymetaarr.xp <- array(0,dim=c(lx,10))
mymetaarr.yp <- array(0,dim=c(ly,10))
for (xi in 1:lx) {
for (yi in 1:ly) {
myretarr[xi,yi] <- cor.test(X[,xi],Y[,yi],method=method)$p.value
for (myp in (1:10)) {
if (myretarr[xi,yi] < myp/1000) {
mymetaarr.x[xi,myp] = mymetaarr.x[xi,myp] + 1
mymetaarr.y[yi,myp] = mymetaarr.y[yi,myp] + 1
}
}
}
}
mymetaarr.xp = mymetaarr.x / ly
mymetaarr.yp = mymetaarr.y / lx
return(list(XYcor = myretarr, Xmeta = mymetaarr.x, Ymeta = mymetaarr.y, Xmetap = mymetaarr.xp, Ymetap = mymetaarr.yp))
}
tim.colors <- function (n = 64) {
orig <- c('#00008F', '#00009F', '#0000AF', '#0000BF', '#0000CF',
'#0000DF', '#0000EF', '#0000FF', '#0010FF', '#0020FF',
'#0030FF', '#0040FF', '#0050FF', '#0060FF', '#0070FF',
'#0080FF', '#008FFF', '#009FFF', '#00AFFF', '#00BFFF',
'#00CFFF', '#00DFFF', '#00EFFF', '#00FFFF', '#10FFEF',
'#20FFDF', '#30FFCF', '#40FFBF', '#50FFAF', '#60FF9F',
'#70FF8F', '#80FF80', '#8FFF70', '#9FFF60', '#AFFF50',
'#BFFF40', '#CFFF30', '#DFFF20', '#EFFF10', '#999999',
'#FFEF00', '#FFDF00', '#FFCF00', '#FFBF00', '#FFAF00',
'#FF9F00', '#FF8F00', '#FF8000', '#FF7000', '#FF6000',
'#FF5000', '#FF4000', '#FF3000', '#FF2000', '#FF1000',
'#FF0000', '#EF0000', '#DF0000', '#CF0000', '#BF0000',
'#AF0000', '#9F0000', '#8F0000', '#800000')
if (n == 64)
return(orig)
rgb.tim <- t(col2rgb(orig))
temp <- matrix(NA, ncol = 3, nrow = n)
x <- seq(0, 1, , 64)
xg <- seq(0, 1, , n)
for (k in 1:3) {
hold <- splint(x, rgb.tim[, k], xg)
hold[hold < 0] <- 0
hold[hold > 255] <- 255
temp[, k] <- round(hold)
}
rgb(temp[, 1], temp[, 2], temp[, 3], maxColorValue = 255)
}
img.matcor <- function (correl, title='XY correlation') {
matcorX = correl$Xcor
matcorY = correl$Ycor
matcorXY = correl$XYcor
lX = ncol(matcorX)
lY = ncol(matcorY)
def.par <- par(no.readonly = TRUE)
par(mfrow = c(1, 1), pty = 's')
image(1:(lX + lY), 1:(lX + lY), t(matcorXY[nrow(matcorXY):1,]), zlim = c(-1, 1), main = title,
col = tim.colors(64), axes = FALSE, , xlab = '', ylab = '')
box()
abline(h = lY + 0.5, v = lX + 0.5, lwd = 2, lty = 2)
image.plot(legend.only = TRUE, zlim = c(-1, 1), col = tim.colors(64), horizontal = TRUE)
par(def.par)
}
x <- as.data.frame(read.table(file='https://automated.biganalytics.eu/download/utaut.csv',sep=',',header=T))
x$U25 <- 6-x$U25
if(par4 == 'female') x <- x[x$Gender==0,]
if(par4 == 'male') x <- x[x$Gender==1,]
if(par5 == 'prep') x <- x[x$Pop==1,]
if(par5 == 'bachelor') x <- x[x$Pop==0,]
if(par6 != 'all') {
x <- x[x$Year==as.numeric(par6),]
}
cAc <- with(x,cbind( A1, A2, A3, A4, A5, A6, A7, A8, A9,A10))
cAs <- with(x,cbind(A11,A12,A13,A14,A15,A16,A17,A18,A19,A20))
cA <- cbind(cAc,cAs)
cCa <- with(x,cbind(C1,C3,C5,C7, C9,C11,C13,C15,C17,C19,C21,C23,C25,C27,C29,C31,C33,C35,C37,C39,C41,C43,C45,C47))
cCp <- with(x,cbind(C2,C4,C6,C8,C10,C12,C14,C16,C18,C20,C22,C24,C26,C28,C30,C32,C34,C36,C38,C40,C42,C44,C46,C48))
cC <- cbind(cCa,cCp)
cU <- with(x,cbind(U1,U2,U3,U4,U5,U6,U7,U8,U9,U10,U11,U12,U13,U14,U15,U16,U17,U18,U19,U20,U21,U22,U23,U24,U25,U26,U27,U28,U29,U30,U31,U32,U33))
cE <- with(x,cbind(BC,NNZFG,MRT,AFL,LPM,LPC,W,WPA))
cX <- with(x,cbind(X1,X2,X3,X4,X5,X6,X7,X8,X9,X10,X11,X12,X13,X14,X15,X16,X17,X18))
if (par2=='ATTLES connected') myX <- cAc
if (par3=='ATTLES connected') myY <- cAc
if (par2=='ATTLES separate') myX <- cAs
if (par3=='ATTLES separate') myY <- cAs
if (par2=='ATTLES all') myX <- cA
if (par3=='ATTLES all') myY <- cA
if (par2=='COLLES actuals') myX <- cCa
if (par3=='COLLES actuals') myY <- cCa
if (par2=='COLLES preferred') myX <- cCp
if (par3=='COLLES preferred') myY <- cCp
if (par2=='COLLES all') myX <- cC
if (par3=='COLLES all') myY <- cC
if (par2=='CSUQ') myX <- cU
if (par3=='CSUQ') myY <- cU
if (par2=='Learning Activities') myX <- cE
if (par3=='Learning Activities') myY <- cE
if (par2=='Exam Items') myX <- cX
if (par3=='Exam Items') myY <- cX
bitmap(file='pic1.png')
if (par1=='correlation matrix') {
correl <- with(x,matcor(myX,myY))
myoutput <- correl
myxlabs <- colnames(myX)
myylabs <- colnames(myY)
img.matcor(correl, title=paste(par2,' and ',par3,sep=''))
dev.off()
}
if (par1=='meta analysis (separate)') {
myl <- length(myY[1,])
nr <- round(sqrt(myl))
nc <- nr
if (nr*nr < myl) nc = nc +1
r <- matcor.p(myX,myY)
myoutput <- r$Ymetap
myylabs <- colnames(myY)
op <- par(mfrow=c(nr,nc))
for (i in 1:myl) {
plot((1:10)/1000,r$Ymetap[i,],xlab='type I error',ylab='#sign./#corr.',main=colnames(myY)[i], type='b',ylim=c(0,max(r$Ymetap[i,])))
abline(0,1)
grid()
}
par(op)
dev.off()
}
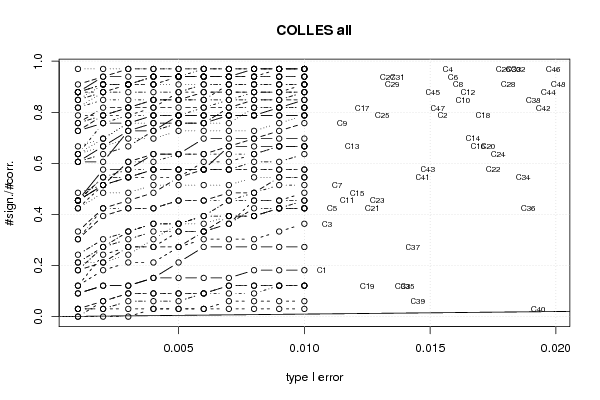
if (par1=='meta analysis (overlay)') {
myl <- length(myY[1,])
r <- matcor.p(myX,myY)
myoutput <- r$Ymetap
myylabs <- colnames(myY)
plot((1:10)/1000,r$Ymetap[1,], xlab='type I error', ylab='#sign./#corr.', main=par3, type='b', ylim=c(0,max(r$Ymetap)), xlim=c(0.001,0.01+ (myl+1)*0.0002))
abline(0,1)
grid()
for (i in 2:myl) {
lines((1:10)/1000,r$Ymetap[i,],type='b',lty=i)
}
for (i in 1:myl) text(0.0105+0.0002*i, r$Ymetap[i,10], labels = colnames(myY)[i], cex=0.7)
dev.off()
}
load(file='createtable')
a<-table.start()
a<-table.row.start(a)
a<-table.element(a,'Computational Result',1,TRUE)
a<-table.row.end(a)
a<-table.row.start(a)
a<-table.element(a,paste('',RC.texteval('myoutput; myxlabs; myylabs'),'',sep=''))
a<-table.row.end(a)
a<-table.end(a)
table.save(a,file='mytable.tab')
|