Free Statistics
of Irreproducible Research!
Description of Statistical Computation | ||||||||||||||||||||||||||||||
|---|---|---|---|---|---|---|---|---|---|---|---|---|---|---|---|---|---|---|---|---|---|---|---|---|---|---|---|---|---|---|
| Author's title | ||||||||||||||||||||||||||||||
| Author | *The author of this computation has been verified* | |||||||||||||||||||||||||||||
| R Software Module | rwasp_Distributional Plots.wasp | |||||||||||||||||||||||||||||
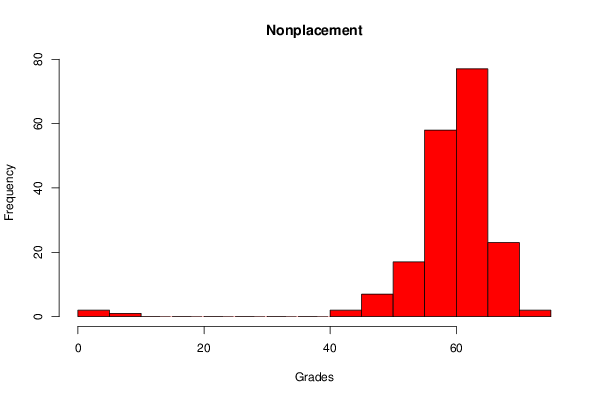
| Title produced by software | Histogram, QQplot and Density | |||||||||||||||||||||||||||||
| Date of computation | Mon, 22 Oct 2012 17:13:53 -0400 | |||||||||||||||||||||||||||||
| Cite this page as follows | Statistical Computations at FreeStatistics.org, Office for Research Development and Education, URL https://freestatistics.org/blog/index.php?v=date/2012/Oct/22/t1350940479icapfcdrc8cu8mi.htm/, Retrieved Sat, 16 May 2026 06:38:47 +0000 | |||||||||||||||||||||||||||||
| Statistical Computations at FreeStatistics.org, Office for Research Development and Education, URL https://freestatistics.org/blog/index.php?pk=182385, Retrieved Sat, 16 May 2026 06:38:47 +0000 | ||||||||||||||||||||||||||||||
| QR Codes: | ||||||||||||||||||||||||||||||
|
| ||||||||||||||||||||||||||||||
| Original text written by user: | ||||||||||||||||||||||||||||||
| IsPrivate? | No (this computation is public) | |||||||||||||||||||||||||||||
| User-defined keywords | non placement data histogram and QQ plots | |||||||||||||||||||||||||||||
| Estimated Impact | 284 | |||||||||||||||||||||||||||||
Tree of Dependent Computations | ||||||||||||||||||||||||||||||
| Family? (F = Feedback message, R = changed R code, M = changed R Module, P = changed Parameters, D = changed Data) | ||||||||||||||||||||||||||||||
| - [CARE Data - Boxplots and Scatterplot Matrix] [Wk3 box plot and ...] [2012-10-22 21:02:22] [dd169dda621c71c4398ebb0f9fdc99bc] - RMPD [Histogram, QQplot and Density] [wk 3 non placemen...] [2012-10-22 21:13:53] [6bec54867f5ba167e77f27db5daf98c2] [Current] | ||||||||||||||||||||||||||||||
| Feedback Forum | ||||||||||||||||||||||||||||||
Post a new message | ||||||||||||||||||||||||||||||
Dataset | ||||||||||||||||||||||||||||||
| Dataseries X: | ||||||||||||||||||||||||||||||
66.67 66.33 64.33 64 63.33 61.33 64.67 63 60.67 63.67 60.67 61.67 62.33 60.33 59.67 60.33 59.33 58.67 58.67 59.33 57.33 59.33 56 53.67 58.67 49.33 71.33 70.33 69 66 66 63.33 65.33 64.33 64 61.67 63.67 64.67 61.67 62 61.33 63.67 61.33 62.33 59.67 59.33 61.67 58.67 58 56.67 59.67 58 57 57.67 58.67 55.33 56 55.67 53.33 53.67 51 47 4.33 70 68.67 67.67 66 65.67 65.67 63.67 63.67 64 62 62 61.67 61.67 63.33 61 62.33 60.33 60.33 60.67 57.67 58.33 58 57.33 56.67 58 55.33 55.67 54.67 56.33 55 55 54.67 54.33 49 48.33 49.67 43.67 6.33 3 66.67 67.33 65.33 66 65.67 66.67 65.67 65 64.67 66.67 63.67 63.33 63.67 63.33 63.67 63 61.67 61.33 60.67 60 61.67 61.33 58.67 60.33 59.67 59.33 59.67 61 61 60 60 58.67 58.33 58 56.33 54.67 55.33 54 52.67 44 65.67 65 66.33 64 62.33 61.33 63 63.67 62 61.33 64.67 62.67 64 61 60.67 59.67 60.33 56.67 56.67 54.33 51 51 47 68 65 64 64 64 62 61 60 60 62 60 59 61 60 60 58 58 60 58 59 56 54 51 47 | ||||||||||||||||||||||||||||||
Tables (Output of Computation) | ||||||||||||||||||||||||||||||
| ||||||||||||||||||||||||||||||
Figures (Output of Computation) | ||||||||||||||||||||||||||||||
Input Parameters & R Code | ||||||||||||||||||||||||||||||
| Parameters (Session): | ||||||||||||||||||||||||||||||
| par1 = 10 ; | ||||||||||||||||||||||||||||||
| Parameters (R input): | ||||||||||||||||||||||||||||||
| par1 = 10 ; | ||||||||||||||||||||||||||||||
| R code (references can be found in the software module): | ||||||||||||||||||||||||||||||
x <- x[!is.na(x)] | ||||||||||||||||||||||||||||||