Free Statistics

of Irreproducible Research!

Author's title

Author*The author of this computation has been verified*
R Software Modulerwasp_pairs.wasp
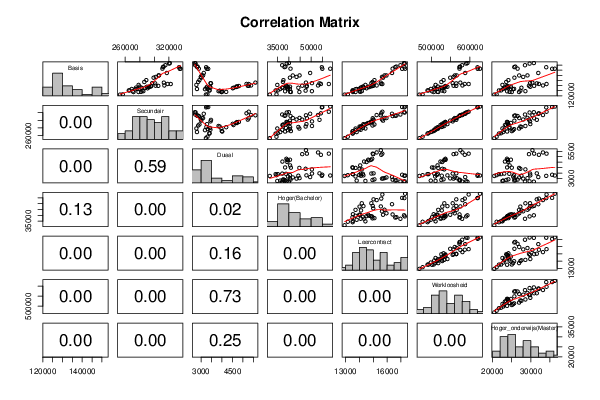
Title produced by softwareKendall tau Correlation Matrix
Date of computationThu, 06 Dec 2012 12:30:13 -0500
Cite this page as followsStatistical Computations at FreeStatistics.org, Office for Research Development and Education, URL https://freestatistics.org/blog/index.php?v=date/2012/Dec/06/t1354815071cm1vecjtrzb1zpy.htm/, Retrieved Thu, 31 Oct 2024 22:46:38 +0000
Statistical Computations at FreeStatistics.org, Office for Research Development and Education, URL https://freestatistics.org/blog/index.php?pk=197185, Retrieved Thu, 31 Oct 2024 22:46:38 +0000
QR Codes:

Original text written by user:
IsPrivate?No (this computation is public)
User-defined keywords
Estimated Impact118
Family? (F = Feedback message, R = changed R code, M = changed R Module, P = changed Parameters, D = changed Data)
-     [Kendall tau Correlation Matrix] [] [2010-12-05 17:44:33] [b98453cac15ba1066b407e146608df68]
- RMPD    [Kendall tau Correlation Matrix] [WS10 Werkloosheid...] [2012-12-06 17:30:13] [4cf5995ff1ac45697158e3095d381e89] [Current]
Feedback Forum

Post a new message
Dataseries X:
132838	312991	5599	47645	15545	575093	30406
129842	301647	5234	45970	15001	557560	29511
129694	305353	5279	48069	14961	564478	30857
130080	313665	5391	53080	15245	580523	33161
131496	322402	5280	57896	15656	596594	34097
131556	318280	5173	54344	15577	586570	32108
128925	292852	4724	40482	14630	536214	24789
127836	287481	4554	37110	14336	523597	23238
129164	295210	4713	39263	14834	536535	23915
129531	295650	4811	38889	14921	536322	23764
128548	292919	4668	39593	14707	532638	23990
127330	290649	4516	39305	14516	528222	24071
123815	281687	4203	40560	14055	516141	24448
124393	270336	4016	38306	13493	501866	23794
123707	271420	3993	40911	13528	506174	25025
123736	278183	3971	44700	13719	517945	26921
124507	284913	3838	50328	14170	533590	28575
125005	283487	3891	47499	14009	528379	27256
121383	256677	3306	34446	13159	477580	21065
121200	252945	3235	31434	12927	469357	20454
125249	264963	3404	34066	13510	490243	21672
125253	265988	3400	35044	13520	492622	22217
127977	274857	3447	37040	14089	507561	23046
128984	279650	3431	38706	14251	516922	24364
126770	276715	3321	40430	13980	514258	25631
126448	273887	3189	39613	13715	509846	25360
127845	282308	3256	44236	14112	527070	27534
128818	289847	3290	47859	14289	541657	29853
132127	301101	3475	53711	15020	564591	31554
132338	297008	3454	50352	14860	555362	29788
126645	268909	2806	36142	13800	498662	22779
130625	278383	2777	34819	14431	511038	22576
133506	286226	2865	37353	14944	525919	23572
135277	288936	2924	37550	15083	531673	24132
137664	298953	3011	40462	15707	548854	25699
139821	305837	3099	41753	15954	560576	26960
138440	301979	2988	43437	15631	557274	28005
139879	306281	3032	44784	15813	565742	29114
142256	317057	3131	49537	16356	587625	31945
146322	334780	3343	54974	17086	619916	35559
146389	335895	3275	58535	17302	625809	36259
147841	333874	3243	54762	17247	619567	34018
146449	311028	2897	40738	16398	572942	26543
147960	311767	2818	38052	16590	572775	25672
148487	312575	2836	38436	16673	574205	25925
149802	315040	2721	36993	16962	579799	28472
151387	320325	2742	39056	17278	590072	29669
151936	321178	2707	39996	17224	593408	30786


Summary of computational transaction
Raw Inputview raw input (R code)
Raw Outputview raw output of R engine
Computing time3 seconds
R Server'George Udny Yule' @ yule.wessa.net

\begin{tabular}{lllllllll}
\hline
Summary of computational transaction \tabularnewline
Raw Input & view raw input (R code)  \tabularnewline
Raw Output & view raw output of R engine  \tabularnewline
Computing time & 3 seconds \tabularnewline
R Server & 'George Udny Yule' @ yule.wessa.net \tabularnewline
\hline
\end{tabular}
%Source: https://freestatistics.org/blog/index.php?pk=197185&T=0

[TABLE]
[ROW][C]Summary of computational transaction[/C][/ROW]
[ROW][C]Raw Input[/C][C]view raw input (R code) [/C][/ROW]
[ROW][C]Raw Output[/C][C]view raw output of R engine [/C][/ROW]
[ROW][C]Computing time[/C][C]3 seconds[/C][/ROW]
[ROW][C]R Server[/C][C]'George Udny Yule' @ yule.wessa.net[/C][/ROW]
[/TABLE]
Source: https://freestatistics.org/blog/index.php?pk=197185&T=0

Globally Unique Identifier (entire table): ba.freestatistics.org/blog/index.php?pk=197185&T=0

As an alternative you can also use a QR Code:  

The GUIDs for individual cells are displayed in the table below:

Summary of computational transaction
Raw Inputview raw input (R code)
Raw Outputview raw output of R engine
Computing time3 seconds
R Server'George Udny Yule' @ yule.wessa.net


Correlations for all pairs of data series (method=pearson)
BasisSecundairDuaalHoger(Bachelor)LeercontractWerkloosheidHoger_onderwijs(Master)
Basis10.815-0.440.2220.9580.8050.524
Secundair0.81510.080.6660.940.9930.841
Duaal-0.440.0810.343-0.2060.0510.17
Hoger(Bachelor)0.2220.6660.34310.4230.720.917
Leercontract0.9580.94-0.2060.42310.9260.678
Werkloosheid0.8050.9930.0510.720.92610.888
Hoger_onderwijs(Master)0.5240.8410.170.9170.6780.8881

\begin{tabular}{lllllllll}
\hline
Correlations for all pairs of data series (method=pearson) \tabularnewline
  & Basis & Secundair & Duaal & Hoger(Bachelor) & Leercontract & Werkloosheid & Hoger_onderwijs(Master) \tabularnewline
Basis & 1 & 0.815 & -0.44 & 0.222 & 0.958 & 0.805 & 0.524 \tabularnewline
Secundair & 0.815 & 1 & 0.08 & 0.666 & 0.94 & 0.993 & 0.841 \tabularnewline
Duaal & -0.44 & 0.08 & 1 & 0.343 & -0.206 & 0.051 & 0.17 \tabularnewline
Hoger(Bachelor) & 0.222 & 0.666 & 0.343 & 1 & 0.423 & 0.72 & 0.917 \tabularnewline
Leercontract & 0.958 & 0.94 & -0.206 & 0.423 & 1 & 0.926 & 0.678 \tabularnewline
Werkloosheid & 0.805 & 0.993 & 0.051 & 0.72 & 0.926 & 1 & 0.888 \tabularnewline
Hoger_onderwijs(Master) & 0.524 & 0.841 & 0.17 & 0.917 & 0.678 & 0.888 & 1 \tabularnewline
\hline
\end{tabular}
%Source: https://freestatistics.org/blog/index.php?pk=197185&T=1

[TABLE]
[ROW][C]Correlations for all pairs of data series (method=pearson)[/C][/ROW]
[ROW][C] [/C][C]Basis[/C][C]Secundair[/C][C]Duaal[/C][C]Hoger(Bachelor)[/C][C]Leercontract[/C][C]Werkloosheid[/C][C]Hoger_onderwijs(Master)[/C][/ROW]
[ROW][C]Basis[/C][C]1[/C][C]0.815[/C][C]-0.44[/C][C]0.222[/C][C]0.958[/C][C]0.805[/C][C]0.524[/C][/ROW]
[ROW][C]Secundair[/C][C]0.815[/C][C]1[/C][C]0.08[/C][C]0.666[/C][C]0.94[/C][C]0.993[/C][C]0.841[/C][/ROW]
[ROW][C]Duaal[/C][C]-0.44[/C][C]0.08[/C][C]1[/C][C]0.343[/C][C]-0.206[/C][C]0.051[/C][C]0.17[/C][/ROW]
[ROW][C]Hoger(Bachelor)[/C][C]0.222[/C][C]0.666[/C][C]0.343[/C][C]1[/C][C]0.423[/C][C]0.72[/C][C]0.917[/C][/ROW]
[ROW][C]Leercontract[/C][C]0.958[/C][C]0.94[/C][C]-0.206[/C][C]0.423[/C][C]1[/C][C]0.926[/C][C]0.678[/C][/ROW]
[ROW][C]Werkloosheid[/C][C]0.805[/C][C]0.993[/C][C]0.051[/C][C]0.72[/C][C]0.926[/C][C]1[/C][C]0.888[/C][/ROW]
[ROW][C]Hoger_onderwijs(Master)[/C][C]0.524[/C][C]0.841[/C][C]0.17[/C][C]0.917[/C][C]0.678[/C][C]0.888[/C][C]1[/C][/ROW]
[/TABLE]
Source: https://freestatistics.org/blog/index.php?pk=197185&T=1

Globally Unique Identifier (entire table): ba.freestatistics.org/blog/index.php?pk=197185&T=1

As an alternative you can also use a QR Code:  

The GUIDs for individual cells are displayed in the table below:

Correlations for all pairs of data series (method=pearson)
BasisSecundairDuaalHoger(Bachelor)LeercontractWerkloosheidHoger_onderwijs(Master)
Basis10.815-0.440.2220.9580.8050.524
Secundair0.81510.080.6660.940.9930.841
Duaal-0.440.0810.343-0.2060.0510.17
Hoger(Bachelor)0.2220.6660.34310.4230.720.917
Leercontract0.9580.94-0.2060.42310.9260.678
Werkloosheid0.8050.9930.0510.720.92610.888
Hoger_onderwijs(Master)0.5240.8410.170.9170.6780.8881


Correlations for all pairs of data series with p-values
pairPearson rSpearman rhoKendall tau
Basis;Secundair0.8150.85880.6862
p-value(0)(0)(0)
Basis;Duaal-0.4396-0.4607-0.2695
p-value(0.0018)(0.0011)(0.0066)
Basis;Hoger(Bachelor)0.22190.26820.195
p-value(0.1296)(0.0655)(0.0512)
Basis;Leercontract0.95820.95850.8351
p-value(0)(0)(0)
Basis;Werkloosheid0.80540.83890.6596
p-value(0)(0)(0)
Basis;Hoger_onderwijs(Master)0.52410.56490.3865
p-value(1e-04)(0)(1e-04)
Secundair;Duaal0.0804-0.0550.0018
p-value(0.5869)(0.7095)(0.9929)
Secundair;Hoger(Bachelor)0.66570.60740.4663
p-value(0)(0)(0)
Secundair;Leercontract0.93980.9520.8298
p-value(0)(0)(0)
Secundair;Werkloosheid0.99330.99110.9379
p-value(0)(0)(0)
Secundair;Hoger_onderwijs(Master)0.84090.8130.633
p-value(0)(0)(0)
Duaal;Hoger(Bachelor)0.3430.36890.2482
p-value(0.017)(0.0103)(0.0126)
Duaal;Leercontract-0.2065-0.2977-0.1365
p-value(0.1591)(0.0403)(0.1748)
Duaal;Werkloosheid0.0511-0.0535-0.0071
p-value(0.7303)(0.7172)(0.9507)
Duaal;Hoger_onderwijs(Master)0.17040.09910.0603
p-value(0.247)(0.5015)(0.5535)
Hoger(Bachelor);Leercontract0.42290.42870.3067
p-value(0.0027)(0.0026)(0.0019)
Hoger(Bachelor);Werkloosheid0.71970.66340.5177
p-value(0)(0)(0)
Hoger(Bachelor);Hoger_onderwijs(Master)0.91670.89180.773
p-value(0)(0)(0)
Leercontract;Werkloosheid0.9260.93250.789
p-value(0)(0)(0)
Leercontract;Hoger_onderwijs(Master)0.67820.67990.4911
p-value(0)(0)(0)
Werkloosheid;Hoger_onderwijs(Master)0.88850.86380.6879
p-value(0)(0)(0)

\begin{tabular}{lllllllll}
\hline
Correlations for all pairs of data series with p-values \tabularnewline
pair & Pearson r & Spearman rho & Kendall tau \tabularnewline
Basis;Secundair & 0.815 & 0.8588 & 0.6862 \tabularnewline
p-value & (0) & (0) & (0) \tabularnewline
Basis;Duaal & -0.4396 & -0.4607 & -0.2695 \tabularnewline
p-value & (0.0018) & (0.0011) & (0.0066) \tabularnewline
Basis;Hoger(Bachelor) & 0.2219 & 0.2682 & 0.195 \tabularnewline
p-value & (0.1296) & (0.0655) & (0.0512) \tabularnewline
Basis;Leercontract & 0.9582 & 0.9585 & 0.8351 \tabularnewline
p-value & (0) & (0) & (0) \tabularnewline
Basis;Werkloosheid & 0.8054 & 0.8389 & 0.6596 \tabularnewline
p-value & (0) & (0) & (0) \tabularnewline
Basis;Hoger_onderwijs(Master) & 0.5241 & 0.5649 & 0.3865 \tabularnewline
p-value & (1e-04) & (0) & (1e-04) \tabularnewline
Secundair;Duaal & 0.0804 & -0.055 & 0.0018 \tabularnewline
p-value & (0.5869) & (0.7095) & (0.9929) \tabularnewline
Secundair;Hoger(Bachelor) & 0.6657 & 0.6074 & 0.4663 \tabularnewline
p-value & (0) & (0) & (0) \tabularnewline
Secundair;Leercontract & 0.9398 & 0.952 & 0.8298 \tabularnewline
p-value & (0) & (0) & (0) \tabularnewline
Secundair;Werkloosheid & 0.9933 & 0.9911 & 0.9379 \tabularnewline
p-value & (0) & (0) & (0) \tabularnewline
Secundair;Hoger_onderwijs(Master) & 0.8409 & 0.813 & 0.633 \tabularnewline
p-value & (0) & (0) & (0) \tabularnewline
Duaal;Hoger(Bachelor) & 0.343 & 0.3689 & 0.2482 \tabularnewline
p-value & (0.017) & (0.0103) & (0.0126) \tabularnewline
Duaal;Leercontract & -0.2065 & -0.2977 & -0.1365 \tabularnewline
p-value & (0.1591) & (0.0403) & (0.1748) \tabularnewline
Duaal;Werkloosheid & 0.0511 & -0.0535 & -0.0071 \tabularnewline
p-value & (0.7303) & (0.7172) & (0.9507) \tabularnewline
Duaal;Hoger_onderwijs(Master) & 0.1704 & 0.0991 & 0.0603 \tabularnewline
p-value & (0.247) & (0.5015) & (0.5535) \tabularnewline
Hoger(Bachelor);Leercontract & 0.4229 & 0.4287 & 0.3067 \tabularnewline
p-value & (0.0027) & (0.0026) & (0.0019) \tabularnewline
Hoger(Bachelor);Werkloosheid & 0.7197 & 0.6634 & 0.5177 \tabularnewline
p-value & (0) & (0) & (0) \tabularnewline
Hoger(Bachelor);Hoger_onderwijs(Master) & 0.9167 & 0.8918 & 0.773 \tabularnewline
p-value & (0) & (0) & (0) \tabularnewline
Leercontract;Werkloosheid & 0.926 & 0.9325 & 0.789 \tabularnewline
p-value & (0) & (0) & (0) \tabularnewline
Leercontract;Hoger_onderwijs(Master) & 0.6782 & 0.6799 & 0.4911 \tabularnewline
p-value & (0) & (0) & (0) \tabularnewline
Werkloosheid;Hoger_onderwijs(Master) & 0.8885 & 0.8638 & 0.6879 \tabularnewline
p-value & (0) & (0) & (0) \tabularnewline
\hline
\end{tabular}
%Source: https://freestatistics.org/blog/index.php?pk=197185&T=2

[TABLE]
[ROW][C]Correlations for all pairs of data series with p-values[/C][/ROW]
[ROW][C]pair[/C][C]Pearson r[/C][C]Spearman rho[/C][C]Kendall tau[/C][/ROW]
[ROW][C]Basis;Secundair[/C][C]0.815[/C][C]0.8588[/C][C]0.6862[/C][/ROW]
[ROW][C]p-value[/C][C](0)[/C][C](0)[/C][C](0)[/C][/ROW]
[ROW][C]Basis;Duaal[/C][C]-0.4396[/C][C]-0.4607[/C][C]-0.2695[/C][/ROW]
[ROW][C]p-value[/C][C](0.0018)[/C][C](0.0011)[/C][C](0.0066)[/C][/ROW]
[ROW][C]Basis;Hoger(Bachelor)[/C][C]0.2219[/C][C]0.2682[/C][C]0.195[/C][/ROW]
[ROW][C]p-value[/C][C](0.1296)[/C][C](0.0655)[/C][C](0.0512)[/C][/ROW]
[ROW][C]Basis;Leercontract[/C][C]0.9582[/C][C]0.9585[/C][C]0.8351[/C][/ROW]
[ROW][C]p-value[/C][C](0)[/C][C](0)[/C][C](0)[/C][/ROW]
[ROW][C]Basis;Werkloosheid[/C][C]0.8054[/C][C]0.8389[/C][C]0.6596[/C][/ROW]
[ROW][C]p-value[/C][C](0)[/C][C](0)[/C][C](0)[/C][/ROW]
[ROW][C]Basis;Hoger_onderwijs(Master)[/C][C]0.5241[/C][C]0.5649[/C][C]0.3865[/C][/ROW]
[ROW][C]p-value[/C][C](1e-04)[/C][C](0)[/C][C](1e-04)[/C][/ROW]
[ROW][C]Secundair;Duaal[/C][C]0.0804[/C][C]-0.055[/C][C]0.0018[/C][/ROW]
[ROW][C]p-value[/C][C](0.5869)[/C][C](0.7095)[/C][C](0.9929)[/C][/ROW]
[ROW][C]Secundair;Hoger(Bachelor)[/C][C]0.6657[/C][C]0.6074[/C][C]0.4663[/C][/ROW]
[ROW][C]p-value[/C][C](0)[/C][C](0)[/C][C](0)[/C][/ROW]
[ROW][C]Secundair;Leercontract[/C][C]0.9398[/C][C]0.952[/C][C]0.8298[/C][/ROW]
[ROW][C]p-value[/C][C](0)[/C][C](0)[/C][C](0)[/C][/ROW]
[ROW][C]Secundair;Werkloosheid[/C][C]0.9933[/C][C]0.9911[/C][C]0.9379[/C][/ROW]
[ROW][C]p-value[/C][C](0)[/C][C](0)[/C][C](0)[/C][/ROW]
[ROW][C]Secundair;Hoger_onderwijs(Master)[/C][C]0.8409[/C][C]0.813[/C][C]0.633[/C][/ROW]
[ROW][C]p-value[/C][C](0)[/C][C](0)[/C][C](0)[/C][/ROW]
[ROW][C]Duaal;Hoger(Bachelor)[/C][C]0.343[/C][C]0.3689[/C][C]0.2482[/C][/ROW]
[ROW][C]p-value[/C][C](0.017)[/C][C](0.0103)[/C][C](0.0126)[/C][/ROW]
[ROW][C]Duaal;Leercontract[/C][C]-0.2065[/C][C]-0.2977[/C][C]-0.1365[/C][/ROW]
[ROW][C]p-value[/C][C](0.1591)[/C][C](0.0403)[/C][C](0.1748)[/C][/ROW]
[ROW][C]Duaal;Werkloosheid[/C][C]0.0511[/C][C]-0.0535[/C][C]-0.0071[/C][/ROW]
[ROW][C]p-value[/C][C](0.7303)[/C][C](0.7172)[/C][C](0.9507)[/C][/ROW]
[ROW][C]Duaal;Hoger_onderwijs(Master)[/C][C]0.1704[/C][C]0.0991[/C][C]0.0603[/C][/ROW]
[ROW][C]p-value[/C][C](0.247)[/C][C](0.5015)[/C][C](0.5535)[/C][/ROW]
[ROW][C]Hoger(Bachelor);Leercontract[/C][C]0.4229[/C][C]0.4287[/C][C]0.3067[/C][/ROW]
[ROW][C]p-value[/C][C](0.0027)[/C][C](0.0026)[/C][C](0.0019)[/C][/ROW]
[ROW][C]Hoger(Bachelor);Werkloosheid[/C][C]0.7197[/C][C]0.6634[/C][C]0.5177[/C][/ROW]
[ROW][C]p-value[/C][C](0)[/C][C](0)[/C][C](0)[/C][/ROW]
[ROW][C]Hoger(Bachelor);Hoger_onderwijs(Master)[/C][C]0.9167[/C][C]0.8918[/C][C]0.773[/C][/ROW]
[ROW][C]p-value[/C][C](0)[/C][C](0)[/C][C](0)[/C][/ROW]
[ROW][C]Leercontract;Werkloosheid[/C][C]0.926[/C][C]0.9325[/C][C]0.789[/C][/ROW]
[ROW][C]p-value[/C][C](0)[/C][C](0)[/C][C](0)[/C][/ROW]
[ROW][C]Leercontract;Hoger_onderwijs(Master)[/C][C]0.6782[/C][C]0.6799[/C][C]0.4911[/C][/ROW]
[ROW][C]p-value[/C][C](0)[/C][C](0)[/C][C](0)[/C][/ROW]
[ROW][C]Werkloosheid;Hoger_onderwijs(Master)[/C][C]0.8885[/C][C]0.8638[/C][C]0.6879[/C][/ROW]
[ROW][C]p-value[/C][C](0)[/C][C](0)[/C][C](0)[/C][/ROW]
[/TABLE]
Source: https://freestatistics.org/blog/index.php?pk=197185&T=2

Globally Unique Identifier (entire table): ba.freestatistics.org/blog/index.php?pk=197185&T=2

As an alternative you can also use a QR Code:  

The GUIDs for individual cells are displayed in the table below:

Correlations for all pairs of data series with p-values
pairPearson rSpearman rhoKendall tau
Basis;Secundair0.8150.85880.6862
p-value(0)(0)(0)
Basis;Duaal-0.4396-0.4607-0.2695
p-value(0.0018)(0.0011)(0.0066)
Basis;Hoger(Bachelor)0.22190.26820.195
p-value(0.1296)(0.0655)(0.0512)
Basis;Leercontract0.95820.95850.8351
p-value(0)(0)(0)
Basis;Werkloosheid0.80540.83890.6596
p-value(0)(0)(0)
Basis;Hoger_onderwijs(Master)0.52410.56490.3865
p-value(1e-04)(0)(1e-04)
Secundair;Duaal0.0804-0.0550.0018
p-value(0.5869)(0.7095)(0.9929)
Secundair;Hoger(Bachelor)0.66570.60740.4663
p-value(0)(0)(0)
Secundair;Leercontract0.93980.9520.8298
p-value(0)(0)(0)
Secundair;Werkloosheid0.99330.99110.9379
p-value(0)(0)(0)
Secundair;Hoger_onderwijs(Master)0.84090.8130.633
p-value(0)(0)(0)
Duaal;Hoger(Bachelor)0.3430.36890.2482
p-value(0.017)(0.0103)(0.0126)
Duaal;Leercontract-0.2065-0.2977-0.1365
p-value(0.1591)(0.0403)(0.1748)
Duaal;Werkloosheid0.0511-0.0535-0.0071
p-value(0.7303)(0.7172)(0.9507)
Duaal;Hoger_onderwijs(Master)0.17040.09910.0603
p-value(0.247)(0.5015)(0.5535)
Hoger(Bachelor);Leercontract0.42290.42870.3067
p-value(0.0027)(0.0026)(0.0019)
Hoger(Bachelor);Werkloosheid0.71970.66340.5177
p-value(0)(0)(0)
Hoger(Bachelor);Hoger_onderwijs(Master)0.91670.89180.773
p-value(0)(0)(0)
Leercontract;Werkloosheid0.9260.93250.789
p-value(0)(0)(0)
Leercontract;Hoger_onderwijs(Master)0.67820.67990.4911
p-value(0)(0)(0)
Werkloosheid;Hoger_onderwijs(Master)0.88850.86380.6879
p-value(0)(0)(0)


Parameters (Session):
par1 = pearson ;
Parameters (R input):
par1 = pearson ;
R code (references can be found in the software module):
panel.tau <- function(x, y, digits=2, prefix='', cex.cor)
{
usr <- par('usr'); on.exit(par(usr))
par(usr = c(0, 1, 0, 1))
rr <- cor.test(x, y, method=par1)
r <- round(rr$p.value,2)
txt <- format(c(r, 0.123456789), digits=digits)[1]
txt <- paste(prefix, txt, sep='')
if(missing(cex.cor)) cex <- 0.5/strwidth(txt)
text(0.5, 0.5, txt, cex = cex)
}
panel.hist <- function(x, ...)
{
usr <- par('usr'); on.exit(par(usr))
par(usr = c(usr[1:2], 0, 1.5) )
h <- hist(x, plot = FALSE)
breaks <- h$breaks; nB <- length(breaks)
y <- h$counts; y <- y/max(y)
rect(breaks[-nB], 0, breaks[-1], y, col='grey', ...)
}
bitmap(file='test1.png')
pairs(t(y),diag.panel=panel.hist, upper.panel=panel.smooth, lower.panel=panel.tau, main=main)
dev.off()
load(file='createtable')
n <- length(y[,1])
n
a<-table.start()
a<-table.row.start(a)
a<-table.element(a,paste('Correlations for all pairs of data series (method=',par1,')',sep=''),n+1,TRUE)
a<-table.row.end(a)
a<-table.row.start(a)
a<-table.element(a,' ',header=TRUE)
for (i in 1:n) {
a<-table.element(a,dimnames(t(x))[[2]][i],header=TRUE)
}
a<-table.row.end(a)
for (i in 1:n) {
a<-table.row.start(a)
a<-table.element(a,dimnames(t(x))[[2]][i],header=TRUE)
for (j in 1:n) {
r <- cor.test(y[i,],y[j,],method=par1)
a<-table.element(a,round(r$estimate,3))
}
a<-table.row.end(a)
}
a<-table.end(a)
table.save(a,file='mytable.tab')
a<-table.start()
a<-table.row.start(a)
a<-table.element(a,'Correlations for all pairs of data series with p-values',4,TRUE)
a<-table.row.end(a)
a<-table.row.start(a)
a<-table.element(a,'pair',1,TRUE)
a<-table.element(a,'Pearson r',1,TRUE)
a<-table.element(a,'Spearman rho',1,TRUE)
a<-table.element(a,'Kendall tau',1,TRUE)
a<-table.row.end(a)
cor.test(y[1,],y[2,],method=par1)
for (i in 1:(n-1))
{
for (j in (i+1):n)
{
a<-table.row.start(a)
dum <- paste(dimnames(t(x))[[2]][i],';',dimnames(t(x))[[2]][j],sep='')
a<-table.element(a,dum,header=TRUE)
rp <- cor.test(y[i,],y[j,],method='pearson')
a<-table.element(a,round(rp$estimate,4))
rs <- cor.test(y[i,],y[j,],method='spearman')
a<-table.element(a,round(rs$estimate,4))
rk <- cor.test(y[i,],y[j,],method='kendall')
a<-table.element(a,round(rk$estimate,4))
a<-table.row.end(a)
a<-table.row.start(a)
a<-table.element(a,'p-value',header=T)
a<-table.element(a,paste('(',round(rp$p.value,4),')',sep=''))
a<-table.element(a,paste('(',round(rs$p.value,4),')',sep=''))
a<-table.element(a,paste('(',round(rk$p.value,4),')',sep=''))
a<-table.row.end(a)
}
}
a<-table.end(a)
table.save(a,file='mytable1.tab')