Free Statistics
of Irreproducible Research!
Description of Statistical Computation | ||||||||||||||||||||||||||||||
|---|---|---|---|---|---|---|---|---|---|---|---|---|---|---|---|---|---|---|---|---|---|---|---|---|---|---|---|---|---|---|
| Author's title | ||||||||||||||||||||||||||||||
| Author | *The author of this computation has been verified* | |||||||||||||||||||||||||||||
| R Software Module | rwasp_Distributional Plots.wasp | |||||||||||||||||||||||||||||
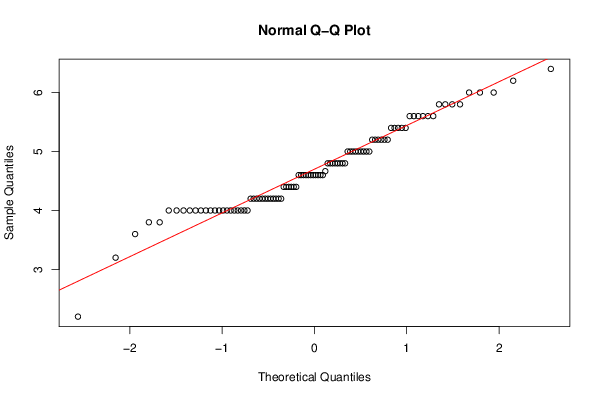
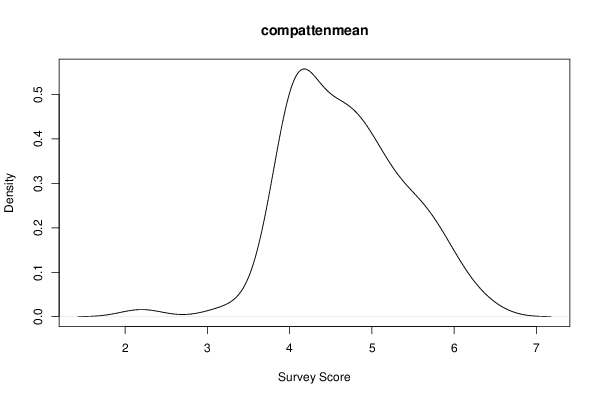
| Title produced by software | Histogram, QQplot and Density | |||||||||||||||||||||||||||||
| Date of computation | Fri, 22 Nov 2013 10:57:57 -0500 | |||||||||||||||||||||||||||||
| Cite this page as follows | Statistical Computations at FreeStatistics.org, Office for Research Development and Education, URL https://freestatistics.org/blog/index.php?v=date/2013/Nov/22/t13851359046u599o8zyfhz2p5.htm/, Retrieved Wed, 29 Jul 2026 11:40:07 +0000 | |||||||||||||||||||||||||||||
| Statistical Computations at FreeStatistics.org, Office for Research Development and Education, URL https://freestatistics.org/blog/index.php?pk=227633, Retrieved Wed, 29 Jul 2026 11:40:07 +0000 | ||||||||||||||||||||||||||||||
| QR Codes: | ||||||||||||||||||||||||||||||
|
| ||||||||||||||||||||||||||||||
| Original text written by user: | ||||||||||||||||||||||||||||||
| IsPrivate? | No (this computation is public) | |||||||||||||||||||||||||||||
| User-defined keywords | ||||||||||||||||||||||||||||||
| Estimated Impact | 387 | |||||||||||||||||||||||||||||
Tree of Dependent Computations | ||||||||||||||||||||||||||||||
| Family? (F = Feedback message, R = changed R code, M = changed R Module, P = changed Parameters, D = changed Data) | ||||||||||||||||||||||||||||||
| - [Variability] [Pregnancy and Cog...] [2009-10-24 23:53:36] [98fd0e87c3eb04e0cc2efde01dbafab6] - RMPD [Correlation] [Cognition in Preg...] [2011-10-24 17:01:26] [98fd0e87c3eb04e0cc2efde01dbafab6] - RMPD [Histogram, QQplot and Density] [specappliedmean 6 ] [2013-11-22 15:53:59] [5b69c1186613d2f4d89c392b6b886a7e] - R [Histogram, QQplot and Density] [specappliedmean 6] [2013-11-22 15:55:35] [5b69c1186613d2f4d89c392b6b886a7e] - D [Histogram, QQplot and Density] [compattenmean 2 ] [2013-11-22 15:57:57] [f3b5625034ff491f0521c1f4163da565] [Current] | ||||||||||||||||||||||||||||||
| Feedback Forum | ||||||||||||||||||||||||||||||
Post a new message | ||||||||||||||||||||||||||||||
Dataset | ||||||||||||||||||||||||||||||
| Dataseries X: | ||||||||||||||||||||||||||||||
5 5.4 5.6 5.6 5.4 6 4 4.2 4.6 4.2 4.2 4.6666666667 3.6 5 4.6 4 5.8 5.8 4 5.4 4.8 5.8 5.4 4.8 4.6 4.6 4 4 4.8 5 4 5.2 4 4.4 5.6 4.6 2.2 4 4.6 4.2 4 5 5 4.8 5 3.8 4.6 4.2 5 4 5.2 4.8 4.2 5 4.2 4 3.2 6.2 5.6 4.6 5.2 6 4.8 4 4.4 4.4 4.8 4.6 6.4 6 4.2 4 5.2 4.4 4.6 4.8 4.2 4 4.2 4 5 4 5.6 4 5.8 4.4 5.4 4.2 5.2 4.6 5.2 4.4 4.2 4 3.8 5.6 | ||||||||||||||||||||||||||||||
Tables (Output of Computation) | ||||||||||||||||||||||||||||||
| ||||||||||||||||||||||||||||||
Figures (Output of Computation) | ||||||||||||||||||||||||||||||
Input Parameters & R Code | ||||||||||||||||||||||||||||||
| Parameters (Session): | ||||||||||||||||||||||||||||||
| Parameters (R input): | ||||||||||||||||||||||||||||||
| par1 = 10 ; | ||||||||||||||||||||||||||||||
| R code (references can be found in the software module): | ||||||||||||||||||||||||||||||
par1 <- '10' | ||||||||||||||||||||||||||||||