Free Statistics
of Irreproducible Research!
Description of Statistical Computation | ||||||||||||||||||||||||||||||
|---|---|---|---|---|---|---|---|---|---|---|---|---|---|---|---|---|---|---|---|---|---|---|---|---|---|---|---|---|---|---|
| Author's title | ||||||||||||||||||||||||||||||
| Author | *The author of this computation has been verified* | |||||||||||||||||||||||||||||
| R Software Module | rwasp_Distributional Plots.wasp | |||||||||||||||||||||||||||||
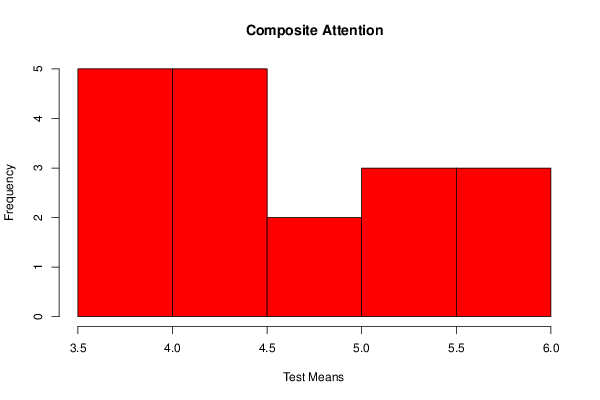
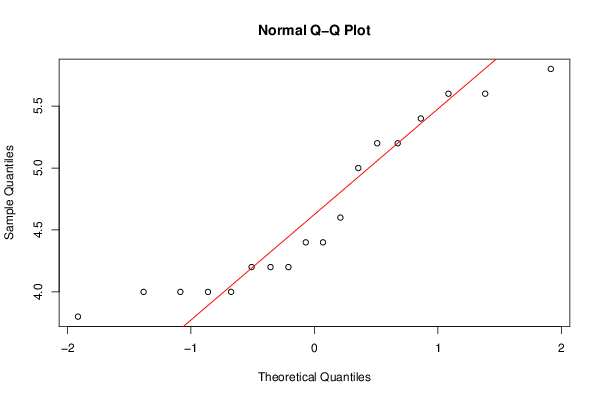
| Title produced by software | Histogram, QQplot and Density | |||||||||||||||||||||||||||||
| Date of computation | Mon, 25 Nov 2013 16:17:38 -0500 | |||||||||||||||||||||||||||||
| Cite this page as follows | Statistical Computations at FreeStatistics.org, Office for Research Development and Education, URL https://freestatistics.org/blog/index.php?v=date/2013/Nov/25/t1385414280hzyvmnyko7k6a83.htm/, Retrieved Tue, 28 Jul 2026 02:49:52 +0000 | |||||||||||||||||||||||||||||
| Statistical Computations at FreeStatistics.org, Office for Research Development and Education, URL https://freestatistics.org/blog/index.php?pk=228461, Retrieved Tue, 28 Jul 2026 02:49:52 +0000 | ||||||||||||||||||||||||||||||
| QR Codes: | ||||||||||||||||||||||||||||||
|
| ||||||||||||||||||||||||||||||
| Original text written by user: | ||||||||||||||||||||||||||||||
| IsPrivate? | No (this computation is public) | |||||||||||||||||||||||||||||
| User-defined keywords | ||||||||||||||||||||||||||||||
| Estimated Impact | 377 | |||||||||||||||||||||||||||||
Tree of Dependent Computations | ||||||||||||||||||||||||||||||
| Family? (F = Feedback message, R = changed R code, M = changed R Module, P = changed Parameters, D = changed Data) | ||||||||||||||||||||||||||||||
| - [Histogram, QQplot and Density] [Workshop 1 ] [2010-09-29 15:04:17] [98fd0e87c3eb04e0cc2efde01dbafab6] - RM [Histogram, QQplot and Density] [Workshop 1] [2011-10-03 09:04:15] [74be16979710d4c4e7c6647856088456] - R PD [Histogram, QQplot and Density] [CompositeMemory] [2013-11-25 19:08:22] [beb7c88064e145de2402131a13492f82] - D [Histogram, QQplot and Density] [Composite Attention] [2013-11-25 21:17:38] [31bdd247a9cc375eedc157c9a3723618] [Current] - D [Histogram, QQplot and Density] [Composite Applied...] [2013-11-25 21:28:31] [beb7c88064e145de2402131a13492f82] - D [Histogram, QQplot and Density] [Composite Attention] [2013-11-25 21:40:08] [beb7c88064e145de2402131a13492f82] - D [Histogram, QQplot and Density] [Composite Applied...] [2013-11-25 21:42:13] [beb7c88064e145de2402131a13492f82] - D [Histogram, QQplot and Density] [Spec Memory] [2013-11-25 21:44:22] [beb7c88064e145de2402131a13492f82] - D [Histogram, QQplot and Density] [Spec Attention] [2013-11-25 21:47:01] [beb7c88064e145de2402131a13492f82] - D [Histogram, QQplot and Density] [Spec Cog] [2013-11-25 21:50:46] [beb7c88064e145de2402131a13492f82] | ||||||||||||||||||||||||||||||
| Feedback Forum | ||||||||||||||||||||||||||||||
Post a new message | ||||||||||||||||||||||||||||||
Dataset | ||||||||||||||||||||||||||||||
| Dataseries X: | ||||||||||||||||||||||||||||||
4.2 4 5 4 5.6 4 5.8 4.4 5.4 4.2 5.2 4.6 5.2 4.4 4.2 4 3.8 5.6 | ||||||||||||||||||||||||||||||
Tables (Output of Computation) | ||||||||||||||||||||||||||||||
| ||||||||||||||||||||||||||||||
Figures (Output of Computation) | ||||||||||||||||||||||||||||||
Input Parameters & R Code | ||||||||||||||||||||||||||||||
| Parameters (Session): | ||||||||||||||||||||||||||||||
| par1 = 5 ; | ||||||||||||||||||||||||||||||
| Parameters (R input): | ||||||||||||||||||||||||||||||
| par1 = 5 ; | ||||||||||||||||||||||||||||||
| R code (references can be found in the software module): | ||||||||||||||||||||||||||||||
bitmap(file='test1.png') | ||||||||||||||||||||||||||||||