Free Statistics

of Irreproducible Research!

Author's title

Author*Unverified author*
R Software Modulerwasp_histogram.wasp
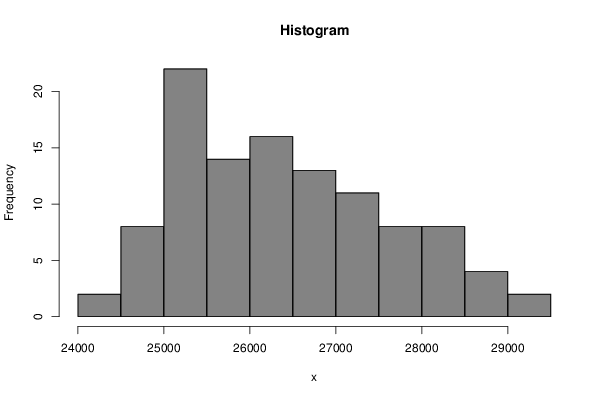
Title produced by softwareHistogram
Date of computationSat, 03 Oct 2015 13:39:22 +0100
Cite this page as followsStatistical Computations at FreeStatistics.org, Office for Research Development and Education, URL https://freestatistics.org/blog/index.php?v=date/2015/Oct/03/t1443875981nr0uark5rv06u8r.htm/, Retrieved Thu, 31 Oct 2024 23:18:41 +0000
Statistical Computations at FreeStatistics.org, Office for Research Development and Education, URL https://freestatistics.org/blog/index.php?pk=281253, Retrieved Thu, 31 Oct 2024 23:18:41 +0000
QR Codes:

Original text written by user:
IsPrivate?No (this computation is public)
User-defined keywords
Estimated Impact138
Family? (F = Feedback message, R = changed R code, M = changed R Module, P = changed Parameters, D = changed Data)
-     [Univariate Data Series] [] [2015-10-01 15:34:10] [1180f538a3418dff23ac5dbc89e7b03d]
- RMP     [Histogram] [] [2015-10-03 12:39:22] [002d4cc575a6d7b5895f2103ed304b4f] [Current]
Feedback Forum

Post a new message
Dataseries X:
24158
24359
24628
25021
25315
25481
26043
26207
26466
26276
26236
26211
26265
25996
25794
25752
25491
25092
25759
25624
25138
25042
25014
25244
25493
25269
25170
25332
24966
24851
25518
25403
25028
24895
24905
25317
25718
25822
25967
25907
25940
26247
26900
26980
26677
26701
26808
27469
27586
27567
27508
27444
27380
27500
28217
28355
27627
27565
27496
27453
27705
27462
27152
27016
26836
26722
27391
27139
26644
26455
26294
26437
26954
26620
26307
26003
25798
25603
26242
26051
25658
25489
25425
25183
24774
24977
24980
25081
25240
25419
26309
26600
26690
26889
27109
27646
28330
28332
28202
28163
28077
28351
28950
28972
28812
28979
29112
29139


Summary of computational transaction
Raw Inputview raw input (R code)
Raw Outputview raw output of R engine
Computing time1 seconds
R Server'Sir Maurice George Kendall' @ kendall.wessa.net

\begin{tabular}{lllllllll}
\hline
Summary of computational transaction \tabularnewline
Raw Input & view raw input (R code)  \tabularnewline
Raw Output & view raw output of R engine  \tabularnewline
Computing time & 1 seconds \tabularnewline
R Server & 'Sir Maurice George Kendall' @ kendall.wessa.net \tabularnewline
\hline
\end{tabular}
%Source: https://freestatistics.org/blog/index.php?pk=281253&T=0

[TABLE]
[ROW][C]Summary of computational transaction[/C][/ROW]
[ROW][C]Raw Input[/C][C]view raw input (R code) [/C][/ROW]
[ROW][C]Raw Output[/C][C]view raw output of R engine [/C][/ROW]
[ROW][C]Computing time[/C][C]1 seconds[/C][/ROW]
[ROW][C]R Server[/C][C]'Sir Maurice George Kendall' @ kendall.wessa.net[/C][/ROW]
[/TABLE]
Source: https://freestatistics.org/blog/index.php?pk=281253&T=0

Globally Unique Identifier (entire table): ba.freestatistics.org/blog/index.php?pk=281253&T=0

As an alternative you can also use a QR Code:  

The GUIDs for individual cells are displayed in the table below:

Summary of computational transaction
Raw Inputview raw input (R code)
Raw Outputview raw output of R engine
Computing time1 seconds
R Server'Sir Maurice George Kendall' @ kendall.wessa.net


Frequency Table (Histogram)
BinsMidpointAbs. FrequencyRel. FrequencyCumul. Rel. Freq.Density
[24000,24500[2425020.0185190.0185193.7e-05
[24500,25000[2475080.0740740.0925930.000148
[25000,25500[25250220.2037040.2962960.000407
[25500,26000[25750140.129630.4259260.000259
[26000,26500[26250160.1481480.5740740.000296
[26500,27000[26750130.120370.6944440.000241
[27000,27500[27250110.1018520.7962960.000204
[27500,28000[2775080.0740740.870370.000148
[28000,28500[2825080.0740740.9444440.000148
[28500,29000[2875040.0370370.9814817.4e-05
[29000,29500]2925020.01851913.7e-05

\begin{tabular}{lllllllll}
\hline
Frequency Table (Histogram) \tabularnewline
Bins & Midpoint & Abs. Frequency & Rel. Frequency & Cumul. Rel. Freq. & Density \tabularnewline
[24000,24500[ & 24250 & 2 & 0.018519 & 0.018519 & 3.7e-05 \tabularnewline
[24500,25000[ & 24750 & 8 & 0.074074 & 0.092593 & 0.000148 \tabularnewline
[25000,25500[ & 25250 & 22 & 0.203704 & 0.296296 & 0.000407 \tabularnewline
[25500,26000[ & 25750 & 14 & 0.12963 & 0.425926 & 0.000259 \tabularnewline
[26000,26500[ & 26250 & 16 & 0.148148 & 0.574074 & 0.000296 \tabularnewline
[26500,27000[ & 26750 & 13 & 0.12037 & 0.694444 & 0.000241 \tabularnewline
[27000,27500[ & 27250 & 11 & 0.101852 & 0.796296 & 0.000204 \tabularnewline
[27500,28000[ & 27750 & 8 & 0.074074 & 0.87037 & 0.000148 \tabularnewline
[28000,28500[ & 28250 & 8 & 0.074074 & 0.944444 & 0.000148 \tabularnewline
[28500,29000[ & 28750 & 4 & 0.037037 & 0.981481 & 7.4e-05 \tabularnewline
[29000,29500] & 29250 & 2 & 0.018519 & 1 & 3.7e-05 \tabularnewline
\hline
\end{tabular}
%Source: https://freestatistics.org/blog/index.php?pk=281253&T=1

[TABLE]
[ROW][C]Frequency Table (Histogram)[/C][/ROW]
[ROW][C]Bins[/C][C]Midpoint[/C][C]Abs. Frequency[/C][C]Rel. Frequency[/C][C]Cumul. Rel. Freq.[/C][C]Density[/C][/ROW]
[ROW][C][24000,24500[[/C][C]24250[/C][C]2[/C][C]0.018519[/C][C]0.018519[/C][C]3.7e-05[/C][/ROW]
[ROW][C][24500,25000[[/C][C]24750[/C][C]8[/C][C]0.074074[/C][C]0.092593[/C][C]0.000148[/C][/ROW]
[ROW][C][25000,25500[[/C][C]25250[/C][C]22[/C][C]0.203704[/C][C]0.296296[/C][C]0.000407[/C][/ROW]
[ROW][C][25500,26000[[/C][C]25750[/C][C]14[/C][C]0.12963[/C][C]0.425926[/C][C]0.000259[/C][/ROW]
[ROW][C][26000,26500[[/C][C]26250[/C][C]16[/C][C]0.148148[/C][C]0.574074[/C][C]0.000296[/C][/ROW]
[ROW][C][26500,27000[[/C][C]26750[/C][C]13[/C][C]0.12037[/C][C]0.694444[/C][C]0.000241[/C][/ROW]
[ROW][C][27000,27500[[/C][C]27250[/C][C]11[/C][C]0.101852[/C][C]0.796296[/C][C]0.000204[/C][/ROW]
[ROW][C][27500,28000[[/C][C]27750[/C][C]8[/C][C]0.074074[/C][C]0.87037[/C][C]0.000148[/C][/ROW]
[ROW][C][28000,28500[[/C][C]28250[/C][C]8[/C][C]0.074074[/C][C]0.944444[/C][C]0.000148[/C][/ROW]
[ROW][C][28500,29000[[/C][C]28750[/C][C]4[/C][C]0.037037[/C][C]0.981481[/C][C]7.4e-05[/C][/ROW]
[ROW][C][29000,29500][/C][C]29250[/C][C]2[/C][C]0.018519[/C][C]1[/C][C]3.7e-05[/C][/ROW]
[/TABLE]
Source: https://freestatistics.org/blog/index.php?pk=281253&T=1

Globally Unique Identifier (entire table): ba.freestatistics.org/blog/index.php?pk=281253&T=1

As an alternative you can also use a QR Code:  

The GUIDs for individual cells are displayed in the table below:

Frequency Table (Histogram)
BinsMidpointAbs. FrequencyRel. FrequencyCumul. Rel. Freq.Density
[24000,24500[2425020.0185190.0185193.7e-05
[24500,25000[2475080.0740740.0925930.000148
[25000,25500[25250220.2037040.2962960.000407
[25500,26000[25750140.129630.4259260.000259
[26000,26500[26250160.1481480.5740740.000296
[26500,27000[26750130.120370.6944440.000241
[27000,27500[27250110.1018520.7962960.000204
[27500,28000[2775080.0740740.870370.000148
[28000,28500[2825080.0740740.9444440.000148
[28500,29000[2875040.0370370.9814817.4e-05
[29000,29500]2925020.01851913.7e-05


Parameters (Session):
par2 = grey ; par3 = FALSE ; par4 = Unknown ;
Parameters (R input):
par1 = ; par2 = grey ; par3 = FALSE ; par4 = Unknown ;
R code (references can be found in the software module):
par1 <- as.numeric(par1)
if (par3 == 'TRUE') par3 <- TRUE
if (par3 == 'FALSE') par3 <- FALSE
if (par4 == 'Unknown') par1 <- as.numeric(par1)
if (par4 == 'Interval/Ratio') par1 <- as.numeric(par1)
if (par4 == '3-point Likert') par1 <- c(1:3 - 0.5, 3.5)
if (par4 == '4-point Likert') par1 <- c(1:4 - 0.5, 4.5)
if (par4 == '5-point Likert') par1 <- c(1:5 - 0.5, 5.5)
if (par4 == '6-point Likert') par1 <- c(1:6 - 0.5, 6.5)
if (par4 == '7-point Likert') par1 <- c(1:7 - 0.5, 7.5)
if (par4 == '8-point Likert') par1 <- c(1:8 - 0.5, 8.5)
if (par4 == '9-point Likert') par1 <- c(1:9 - 0.5, 9.5)
if (par4 == '10-point Likert') par1 <- c(1:10 - 0.5, 10.5)
bitmap(file='test1.png')
if(is.numeric(x[1])) {
if (is.na(par1)) {
myhist<-hist(x,col=par2,main=main,xlab=xlab,right=par3)
} else {
if (par1 < 0) par1 <- 3
if (par1 > 50) par1 <- 50
myhist<-hist(x,breaks=par1,col=par2,main=main,xlab=xlab,right=par3)
}
} else {
barplot(mytab <- sort(table(x),T),col=par2,main='Frequency Plot',xlab=xlab,ylab='Absolute Frequency')
}
dev.off()
if(is.numeric(x[1])) {
myhist
n <- length(x)
load(file='createtable')
a<-table.start()
a<-table.row.start(a)
a<-table.element(a,hyperlink('histogram.htm','Frequency Table (Histogram)',''),6,TRUE)
a<-table.row.end(a)
a<-table.row.start(a)
a<-table.element(a,'Bins',header=TRUE)
a<-table.element(a,'Midpoint',header=TRUE)
a<-table.element(a,'Abs. Frequency',header=TRUE)
a<-table.element(a,'Rel. Frequency',header=TRUE)
a<-table.element(a,'Cumul. Rel. Freq.',header=TRUE)
a<-table.element(a,'Density',header=TRUE)
a<-table.row.end(a)
crf <- 0
if (par3 == FALSE) mybracket <- '[' else mybracket <- ']'
mynumrows <- (length(myhist$breaks)-1)
for (i in 1:mynumrows) {
a<-table.row.start(a)
if (i == 1)
dum <- paste('[',myhist$breaks[i],sep='')
else
dum <- paste(mybracket,myhist$breaks[i],sep='')
dum <- paste(dum,myhist$breaks[i+1],sep=',')
if (i==mynumrows)
dum <- paste(dum,']',sep='')
else
dum <- paste(dum,mybracket,sep='')
a<-table.element(a,dum,header=TRUE)
a<-table.element(a,myhist$mids[i])
a<-table.element(a,myhist$counts[i])
rf <- myhist$counts[i]/n
crf <- crf + rf
a<-table.element(a,round(rf,6))
a<-table.element(a,round(crf,6))
a<-table.element(a,round(myhist$density[i],6))
a<-table.row.end(a)
}
a<-table.end(a)
table.save(a,file='mytable.tab')
} else {
mytab
reltab <- mytab / sum(mytab)
n <- length(mytab)
load(file='createtable')
a<-table.start()
a<-table.row.start(a)
a<-table.element(a,'Frequency Table (Categorical Data)',3,TRUE)
a<-table.row.end(a)
a<-table.row.start(a)
a<-table.element(a,'Category',header=TRUE)
a<-table.element(a,'Abs. Frequency',header=TRUE)
a<-table.element(a,'Rel. Frequency',header=TRUE)
a<-table.row.end(a)
for (i in 1:n) {
a<-table.row.start(a)
a<-table.element(a,labels(mytab)$x[i],header=TRUE)
a<-table.element(a,mytab[i])
a<-table.element(a,round(reltab[i],4))
a<-table.row.end(a)
}
a<-table.end(a)
table.save(a,file='mytable1.tab')
}