Free Statistics

of Irreproducible Research!

Author's title

Author*The author of this computation has been verified*
R Software Modulerwasp_centraltendency.wasp
Title produced by softwareCentral Tendency
Date of computationMon, 08 Dec 2008 07:11:33 -0700
Cite this page as followsStatistical Computations at FreeStatistics.org, Office for Research Development and Education, URL https://freestatistics.org/blog/index.php?v=date/2008/Dec/08/t12287455254z0c90gz0zj4bk8.htm/, Retrieved Thu, 31 Oct 2024 23:33:48 +0000
Statistical Computations at FreeStatistics.org, Office for Research Development and Education, URL https://freestatistics.org/blog/index.php?pk=30505, Retrieved Thu, 31 Oct 2024 23:33:48 +0000
QR Codes:

Original text written by user:
IsPrivate?No (this computation is public)
User-defined keywords
Estimated Impact189
Family? (F = Feedback message, R = changed R code, M = changed R Module, P = changed Parameters, D = changed Data)
-       [Central Tendency] [] [2008-12-08 14:11:33] [28deb8481dba3cc87d2d53a86e0e0d0b] [Current]
Feedback Forum

Post a new message
Dataseries X:
109.1
113.8
97.4
72.5
82.7
88.9
105.9
100.8
94
105
58.5
87.6
113.1
112.5
89.6
74.5
82.7
90.1
109.4
96
89.2
109.1
49.1
92.9
107.7
103.5
91.1
79.8
71.9
82.9
90.1
100.7
90.7
108.8
44.1
93.6
107.4
96.5
93.6
76.5
76.7
84
103.3
88.5
99
105.9
44.7
94
107.1
104.8
102.5
77.7
85.2
91.3
106.5
92.4
97.5
107
51.1
98.6
102.2
114.3
99.4
72.5
92.3
99.4
85.9
109.4
97.6
104.7


Summary of computational transaction
Raw Inputview raw input (R code)
Raw Outputview raw output of R engine
Computing time1 seconds
R Server'Gwilym Jenkins' @ 72.249.127.135

\begin{tabular}{lllllllll}
\hline
Summary of computational transaction \tabularnewline
Raw Input & view raw input (R code)  \tabularnewline
Raw Output & view raw output of R engine  \tabularnewline
Computing time & 1 seconds \tabularnewline
R Server & 'Gwilym Jenkins' @ 72.249.127.135 \tabularnewline
\hline
\end{tabular}
%Source: https://freestatistics.org/blog/index.php?pk=30505&T=0

[TABLE]
[ROW][C]Summary of computational transaction[/C][/ROW]
[ROW][C]Raw Input[/C][C]view raw input (R code) [/C][/ROW]
[ROW][C]Raw Output[/C][C]view raw output of R engine [/C][/ROW]
[ROW][C]Computing time[/C][C]1 seconds[/C][/ROW]
[ROW][C]R Server[/C][C]'Gwilym Jenkins' @ 72.249.127.135[/C][/ROW]
[/TABLE]
Source: https://freestatistics.org/blog/index.php?pk=30505&T=0

Globally Unique Identifier (entire table): ba.freestatistics.org/blog/index.php?pk=30505&T=0

As an alternative you can also use a QR Code:  

The GUIDs for individual cells are displayed in the table below:

Summary of computational transaction
Raw Inputview raw input (R code)
Raw Outputview raw output of R engine
Computing time1 seconds
R Server'Gwilym Jenkins' @ 72.249.127.135


Central Tendency - Ungrouped Data
MeasureValueS.E.Value/S.E.
Arithmetic Mean92.26857142857141.9431618625974547.4837290730042
Geometric Mean90.5251258330035
Harmonic Mean88.3305861909835
Quadratic Mean93.6697649038517
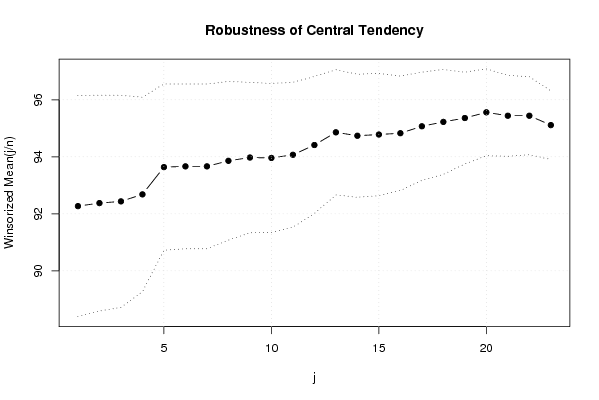
Winsorized Mean ( 1 / 23 )92.271.9389367110244247.5879380050781
Winsorized Mean ( 2 / 23 )92.37571428571431.8925411353858348.8104129197075
Winsorized Mean ( 3 / 23 )92.43571428571431.8604848493318449.6836694579432
Winsorized Mean ( 4 / 23 )92.68142857142861.7041640548088254.3852737122927
Winsorized Mean ( 5 / 23 )93.63857142857141.4589288064701564.1830985948712
Winsorized Mean ( 6 / 23 )93.66428571428571.4439077924516664.8686060175974
Winsorized Mean ( 7 / 23 )93.66428571428571.4439077924516664.8686060175974
Winsorized Mean ( 8 / 23 )93.85857142857141.3912362389976767.4641508017306
Winsorized Mean ( 9 / 23 )93.97428571428571.3189064510268371.2516688663721
Winsorized Mean ( 10 / 23 )93.961.3070035903138071.8896265445154
Winsorized Mean ( 11 / 23 )94.071.2702689596355874.055182791357
Winsorized Mean ( 12 / 23 )94.41285714285711.2023181911750878.5256829979283
Winsorized Mean ( 13 / 23 )94.85857142857141.0972702678995486.4495960600076
Winsorized Mean ( 14 / 23 )94.73857142857141.0790481444120987.7982802891418
Winsorized Mean ( 15 / 23 )94.78142857142861.0721416674591388.4038289417958
Winsorized Mean ( 16 / 23 )94.82714285714281.0016299788899494.6728281458142
Winsorized Mean ( 17 / 23 )95.070.949650366085004100.110528458945
Winsorized Mean ( 18 / 23 )95.22428571428570.919024678159061103.614503481053
Winsorized Mean ( 19 / 23 )95.360.80448895857684118.534877307321
Winsorized Mean ( 20 / 23 )95.560.760803215089879125.604095914225
Winsorized Mean ( 21 / 23 )95.440.709711981939496134.477087084231
Winsorized Mean ( 22 / 23 )95.440.683625095517662139.608684095674
Winsorized Mean ( 23 / 23 )95.11142857142860.601638696861886158.08728572069
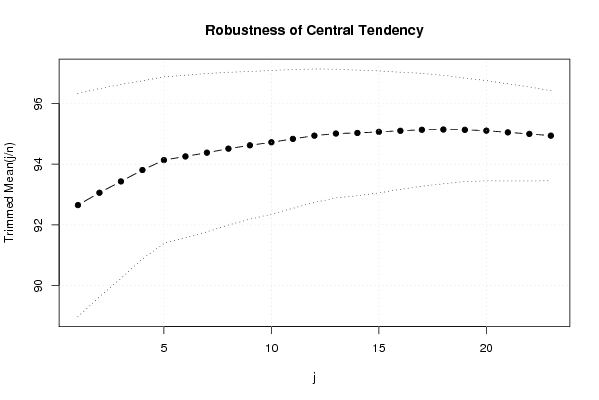
Trimmed Mean ( 1 / 23 )92.65294117647061.839824387767450.3596657335886
Trimmed Mean ( 2 / 23 )93.0590909090911.7181520637277654.1623136122112
Trimmed Mean ( 3 / 23 )93.43281251.5999520309765858.3972585996658
Trimmed Mean ( 4 / 23 )93.8080645161291.4685983316375263.8759165765434
Trimmed Mean ( 5 / 23 )94.13666666666671.3716973004247268.62787193466
Trimmed Mean ( 6 / 23 )94.25689655172411.3395675008548270.3636781958175
Trimmed Mean ( 7 / 23 )94.38035714285721.3040755785475072.3733798066974
Trimmed Mean ( 8 / 23 )94.5129629629631.2596962749311675.0283737785346
Trimmed Mean ( 9 / 23 )94.6230769230771.2183012905577977.6680429188041
Trimmed Mean ( 10 / 23 )94.7241.1843005685782279.9830739874746
Trimmed Mean ( 11 / 23 )94.83541666666671.1435429639897982.9312230961475
Trimmed Mean ( 12 / 23 )94.9413043478261.1001957493239586.2949201595856
Trimmed Mean ( 13 / 23 )95.01136363636361.0612092503530189.5312245014437
Trimmed Mean ( 14 / 23 )95.03095238095241.0356955957035891.7556787681374
Trimmed Mean ( 15 / 23 )95.06751.0053981702635294.5570648642443
Trimmed Mean ( 16 / 23 )95.10263157894740.96579102406455498.4712315700613
Trimmed Mean ( 17 / 23 )95.13611111111110.930174525165205102.277700084524
Trimmed Mean ( 18 / 23 )95.14411764705880.894658253164253106.346884199135
Trimmed Mean ( 19 / 23 )95.1343750.85270690156691111.567497372408
Trimmed Mean ( 20 / 23 )95.10666666666670.826652762211577115.050322232305
Trimmed Mean ( 21 / 23 )95.050.79984290785671118.835835220068
Trimmed Mean ( 22 / 23 )950.774854825112421122.603611568421
Trimmed Mean ( 23 / 23 )94.94166666666670.742960116223958127.788375975282
Median94
Midrange79.2
Midmean - Weighted Average at Xnp94.86
Midmean - Weighted Average at X(n+1)p95.1361111111111
Midmean - Empirical Distribution Function95.1361111111111
Midmean - Empirical Distribution Function - Averaging95.1361111111111
Midmean - Empirical Distribution Function - Interpolation95.1441176470588
Midmean - Closest Observation95.1361111111111
Midmean - True Basic - Statistics Graphics Toolkit95.1361111111111
Midmean - MS Excel (old versions)95.1361111111111
Number of observations70

\begin{tabular}{lllllllll}
\hline
Central Tendency - Ungrouped Data \tabularnewline
Measure & Value & S.E. & Value/S.E. \tabularnewline
Arithmetic Mean & 92.2685714285714 & 1.94316186259745 & 47.4837290730042 \tabularnewline
Geometric Mean & 90.5251258330035 &  &  \tabularnewline
Harmonic Mean & 88.3305861909835 &  &  \tabularnewline
Quadratic Mean & 93.6697649038517 &  &  \tabularnewline
Winsorized Mean ( 1 / 23 ) & 92.27 & 1.93893671102442 & 47.5879380050781 \tabularnewline
Winsorized Mean ( 2 / 23 ) & 92.3757142857143 & 1.89254113538583 & 48.8104129197075 \tabularnewline
Winsorized Mean ( 3 / 23 ) & 92.4357142857143 & 1.86048484933184 & 49.6836694579432 \tabularnewline
Winsorized Mean ( 4 / 23 ) & 92.6814285714286 & 1.70416405480882 & 54.3852737122927 \tabularnewline
Winsorized Mean ( 5 / 23 ) & 93.6385714285714 & 1.45892880647015 & 64.1830985948712 \tabularnewline
Winsorized Mean ( 6 / 23 ) & 93.6642857142857 & 1.44390779245166 & 64.8686060175974 \tabularnewline
Winsorized Mean ( 7 / 23 ) & 93.6642857142857 & 1.44390779245166 & 64.8686060175974 \tabularnewline
Winsorized Mean ( 8 / 23 ) & 93.8585714285714 & 1.39123623899767 & 67.4641508017306 \tabularnewline
Winsorized Mean ( 9 / 23 ) & 93.9742857142857 & 1.31890645102683 & 71.2516688663721 \tabularnewline
Winsorized Mean ( 10 / 23 ) & 93.96 & 1.30700359031380 & 71.8896265445154 \tabularnewline
Winsorized Mean ( 11 / 23 ) & 94.07 & 1.27026895963558 & 74.055182791357 \tabularnewline
Winsorized Mean ( 12 / 23 ) & 94.4128571428571 & 1.20231819117508 & 78.5256829979283 \tabularnewline
Winsorized Mean ( 13 / 23 ) & 94.8585714285714 & 1.09727026789954 & 86.4495960600076 \tabularnewline
Winsorized Mean ( 14 / 23 ) & 94.7385714285714 & 1.07904814441209 & 87.7982802891418 \tabularnewline
Winsorized Mean ( 15 / 23 ) & 94.7814285714286 & 1.07214166745913 & 88.4038289417958 \tabularnewline
Winsorized Mean ( 16 / 23 ) & 94.8271428571428 & 1.00162997888994 & 94.6728281458142 \tabularnewline
Winsorized Mean ( 17 / 23 ) & 95.07 & 0.949650366085004 & 100.110528458945 \tabularnewline
Winsorized Mean ( 18 / 23 ) & 95.2242857142857 & 0.919024678159061 & 103.614503481053 \tabularnewline
Winsorized Mean ( 19 / 23 ) & 95.36 & 0.80448895857684 & 118.534877307321 \tabularnewline
Winsorized Mean ( 20 / 23 ) & 95.56 & 0.760803215089879 & 125.604095914225 \tabularnewline
Winsorized Mean ( 21 / 23 ) & 95.44 & 0.709711981939496 & 134.477087084231 \tabularnewline
Winsorized Mean ( 22 / 23 ) & 95.44 & 0.683625095517662 & 139.608684095674 \tabularnewline
Winsorized Mean ( 23 / 23 ) & 95.1114285714286 & 0.601638696861886 & 158.08728572069 \tabularnewline
Trimmed Mean ( 1 / 23 ) & 92.6529411764706 & 1.8398243877674 & 50.3596657335886 \tabularnewline
Trimmed Mean ( 2 / 23 ) & 93.059090909091 & 1.71815206372776 & 54.1623136122112 \tabularnewline
Trimmed Mean ( 3 / 23 ) & 93.4328125 & 1.59995203097658 & 58.3972585996658 \tabularnewline
Trimmed Mean ( 4 / 23 ) & 93.808064516129 & 1.46859833163752 & 63.8759165765434 \tabularnewline
Trimmed Mean ( 5 / 23 ) & 94.1366666666667 & 1.37169730042472 & 68.62787193466 \tabularnewline
Trimmed Mean ( 6 / 23 ) & 94.2568965517241 & 1.33956750085482 & 70.3636781958175 \tabularnewline
Trimmed Mean ( 7 / 23 ) & 94.3803571428572 & 1.30407557854750 & 72.3733798066974 \tabularnewline
Trimmed Mean ( 8 / 23 ) & 94.512962962963 & 1.25969627493116 & 75.0283737785346 \tabularnewline
Trimmed Mean ( 9 / 23 ) & 94.623076923077 & 1.21830129055779 & 77.6680429188041 \tabularnewline
Trimmed Mean ( 10 / 23 ) & 94.724 & 1.18430056857822 & 79.9830739874746 \tabularnewline
Trimmed Mean ( 11 / 23 ) & 94.8354166666667 & 1.14354296398979 & 82.9312230961475 \tabularnewline
Trimmed Mean ( 12 / 23 ) & 94.941304347826 & 1.10019574932395 & 86.2949201595856 \tabularnewline
Trimmed Mean ( 13 / 23 ) & 95.0113636363636 & 1.06120925035301 & 89.5312245014437 \tabularnewline
Trimmed Mean ( 14 / 23 ) & 95.0309523809524 & 1.03569559570358 & 91.7556787681374 \tabularnewline
Trimmed Mean ( 15 / 23 ) & 95.0675 & 1.00539817026352 & 94.5570648642443 \tabularnewline
Trimmed Mean ( 16 / 23 ) & 95.1026315789474 & 0.965791024064554 & 98.4712315700613 \tabularnewline
Trimmed Mean ( 17 / 23 ) & 95.1361111111111 & 0.930174525165205 & 102.277700084524 \tabularnewline
Trimmed Mean ( 18 / 23 ) & 95.1441176470588 & 0.894658253164253 & 106.346884199135 \tabularnewline
Trimmed Mean ( 19 / 23 ) & 95.134375 & 0.85270690156691 & 111.567497372408 \tabularnewline
Trimmed Mean ( 20 / 23 ) & 95.1066666666667 & 0.826652762211577 & 115.050322232305 \tabularnewline
Trimmed Mean ( 21 / 23 ) & 95.05 & 0.79984290785671 & 118.835835220068 \tabularnewline
Trimmed Mean ( 22 / 23 ) & 95 & 0.774854825112421 & 122.603611568421 \tabularnewline
Trimmed Mean ( 23 / 23 ) & 94.9416666666667 & 0.742960116223958 & 127.788375975282 \tabularnewline
Median & 94 &  &  \tabularnewline
Midrange & 79.2 &  &  \tabularnewline
Midmean - Weighted Average at Xnp & 94.86 &  &  \tabularnewline
Midmean - Weighted Average at X(n+1)p & 95.1361111111111 &  &  \tabularnewline
Midmean - Empirical Distribution Function & 95.1361111111111 &  &  \tabularnewline
Midmean - Empirical Distribution Function - Averaging & 95.1361111111111 &  &  \tabularnewline
Midmean - Empirical Distribution Function - Interpolation & 95.1441176470588 &  &  \tabularnewline
Midmean - Closest Observation & 95.1361111111111 &  &  \tabularnewline
Midmean - True Basic - Statistics Graphics Toolkit & 95.1361111111111 &  &  \tabularnewline
Midmean - MS Excel (old versions) & 95.1361111111111 &  &  \tabularnewline
Number of observations & 70 &  &  \tabularnewline
\hline
\end{tabular}
%Source: https://freestatistics.org/blog/index.php?pk=30505&T=1

[TABLE]
[ROW][C]Central Tendency - Ungrouped Data[/C][/ROW]
[ROW][C]Measure[/C][C]Value[/C][C]S.E.[/C][C]Value/S.E.[/C][/ROW]
[ROW][C]Arithmetic Mean[/C][C]92.2685714285714[/C][C]1.94316186259745[/C][C]47.4837290730042[/C][/ROW]
[ROW][C]Geometric Mean[/C][C]90.5251258330035[/C][C][/C][C][/C][/ROW]
[ROW][C]Harmonic Mean[/C][C]88.3305861909835[/C][C][/C][C][/C][/ROW]
[ROW][C]Quadratic Mean[/C][C]93.6697649038517[/C][C][/C][C][/C][/ROW]
[ROW][C]Winsorized Mean ( 1 / 23 )[/C][C]92.27[/C][C]1.93893671102442[/C][C]47.5879380050781[/C][/ROW]
[ROW][C]Winsorized Mean ( 2 / 23 )[/C][C]92.3757142857143[/C][C]1.89254113538583[/C][C]48.8104129197075[/C][/ROW]
[ROW][C]Winsorized Mean ( 3 / 23 )[/C][C]92.4357142857143[/C][C]1.86048484933184[/C][C]49.6836694579432[/C][/ROW]
[ROW][C]Winsorized Mean ( 4 / 23 )[/C][C]92.6814285714286[/C][C]1.70416405480882[/C][C]54.3852737122927[/C][/ROW]
[ROW][C]Winsorized Mean ( 5 / 23 )[/C][C]93.6385714285714[/C][C]1.45892880647015[/C][C]64.1830985948712[/C][/ROW]
[ROW][C]Winsorized Mean ( 6 / 23 )[/C][C]93.6642857142857[/C][C]1.44390779245166[/C][C]64.8686060175974[/C][/ROW]
[ROW][C]Winsorized Mean ( 7 / 23 )[/C][C]93.6642857142857[/C][C]1.44390779245166[/C][C]64.8686060175974[/C][/ROW]
[ROW][C]Winsorized Mean ( 8 / 23 )[/C][C]93.8585714285714[/C][C]1.39123623899767[/C][C]67.4641508017306[/C][/ROW]
[ROW][C]Winsorized Mean ( 9 / 23 )[/C][C]93.9742857142857[/C][C]1.31890645102683[/C][C]71.2516688663721[/C][/ROW]
[ROW][C]Winsorized Mean ( 10 / 23 )[/C][C]93.96[/C][C]1.30700359031380[/C][C]71.8896265445154[/C][/ROW]
[ROW][C]Winsorized Mean ( 11 / 23 )[/C][C]94.07[/C][C]1.27026895963558[/C][C]74.055182791357[/C][/ROW]
[ROW][C]Winsorized Mean ( 12 / 23 )[/C][C]94.4128571428571[/C][C]1.20231819117508[/C][C]78.5256829979283[/C][/ROW]
[ROW][C]Winsorized Mean ( 13 / 23 )[/C][C]94.8585714285714[/C][C]1.09727026789954[/C][C]86.4495960600076[/C][/ROW]
[ROW][C]Winsorized Mean ( 14 / 23 )[/C][C]94.7385714285714[/C][C]1.07904814441209[/C][C]87.7982802891418[/C][/ROW]
[ROW][C]Winsorized Mean ( 15 / 23 )[/C][C]94.7814285714286[/C][C]1.07214166745913[/C][C]88.4038289417958[/C][/ROW]
[ROW][C]Winsorized Mean ( 16 / 23 )[/C][C]94.8271428571428[/C][C]1.00162997888994[/C][C]94.6728281458142[/C][/ROW]
[ROW][C]Winsorized Mean ( 17 / 23 )[/C][C]95.07[/C][C]0.949650366085004[/C][C]100.110528458945[/C][/ROW]
[ROW][C]Winsorized Mean ( 18 / 23 )[/C][C]95.2242857142857[/C][C]0.919024678159061[/C][C]103.614503481053[/C][/ROW]
[ROW][C]Winsorized Mean ( 19 / 23 )[/C][C]95.36[/C][C]0.80448895857684[/C][C]118.534877307321[/C][/ROW]
[ROW][C]Winsorized Mean ( 20 / 23 )[/C][C]95.56[/C][C]0.760803215089879[/C][C]125.604095914225[/C][/ROW]
[ROW][C]Winsorized Mean ( 21 / 23 )[/C][C]95.44[/C][C]0.709711981939496[/C][C]134.477087084231[/C][/ROW]
[ROW][C]Winsorized Mean ( 22 / 23 )[/C][C]95.44[/C][C]0.683625095517662[/C][C]139.608684095674[/C][/ROW]
[ROW][C]Winsorized Mean ( 23 / 23 )[/C][C]95.1114285714286[/C][C]0.601638696861886[/C][C]158.08728572069[/C][/ROW]
[ROW][C]Trimmed Mean ( 1 / 23 )[/C][C]92.6529411764706[/C][C]1.8398243877674[/C][C]50.3596657335886[/C][/ROW]
[ROW][C]Trimmed Mean ( 2 / 23 )[/C][C]93.059090909091[/C][C]1.71815206372776[/C][C]54.1623136122112[/C][/ROW]
[ROW][C]Trimmed Mean ( 3 / 23 )[/C][C]93.4328125[/C][C]1.59995203097658[/C][C]58.3972585996658[/C][/ROW]
[ROW][C]Trimmed Mean ( 4 / 23 )[/C][C]93.808064516129[/C][C]1.46859833163752[/C][C]63.8759165765434[/C][/ROW]
[ROW][C]Trimmed Mean ( 5 / 23 )[/C][C]94.1366666666667[/C][C]1.37169730042472[/C][C]68.62787193466[/C][/ROW]
[ROW][C]Trimmed Mean ( 6 / 23 )[/C][C]94.2568965517241[/C][C]1.33956750085482[/C][C]70.3636781958175[/C][/ROW]
[ROW][C]Trimmed Mean ( 7 / 23 )[/C][C]94.3803571428572[/C][C]1.30407557854750[/C][C]72.3733798066974[/C][/ROW]
[ROW][C]Trimmed Mean ( 8 / 23 )[/C][C]94.512962962963[/C][C]1.25969627493116[/C][C]75.0283737785346[/C][/ROW]
[ROW][C]Trimmed Mean ( 9 / 23 )[/C][C]94.623076923077[/C][C]1.21830129055779[/C][C]77.6680429188041[/C][/ROW]
[ROW][C]Trimmed Mean ( 10 / 23 )[/C][C]94.724[/C][C]1.18430056857822[/C][C]79.9830739874746[/C][/ROW]
[ROW][C]Trimmed Mean ( 11 / 23 )[/C][C]94.8354166666667[/C][C]1.14354296398979[/C][C]82.9312230961475[/C][/ROW]
[ROW][C]Trimmed Mean ( 12 / 23 )[/C][C]94.941304347826[/C][C]1.10019574932395[/C][C]86.2949201595856[/C][/ROW]
[ROW][C]Trimmed Mean ( 13 / 23 )[/C][C]95.0113636363636[/C][C]1.06120925035301[/C][C]89.5312245014437[/C][/ROW]
[ROW][C]Trimmed Mean ( 14 / 23 )[/C][C]95.0309523809524[/C][C]1.03569559570358[/C][C]91.7556787681374[/C][/ROW]
[ROW][C]Trimmed Mean ( 15 / 23 )[/C][C]95.0675[/C][C]1.00539817026352[/C][C]94.5570648642443[/C][/ROW]
[ROW][C]Trimmed Mean ( 16 / 23 )[/C][C]95.1026315789474[/C][C]0.965791024064554[/C][C]98.4712315700613[/C][/ROW]
[ROW][C]Trimmed Mean ( 17 / 23 )[/C][C]95.1361111111111[/C][C]0.930174525165205[/C][C]102.277700084524[/C][/ROW]
[ROW][C]Trimmed Mean ( 18 / 23 )[/C][C]95.1441176470588[/C][C]0.894658253164253[/C][C]106.346884199135[/C][/ROW]
[ROW][C]Trimmed Mean ( 19 / 23 )[/C][C]95.134375[/C][C]0.85270690156691[/C][C]111.567497372408[/C][/ROW]
[ROW][C]Trimmed Mean ( 20 / 23 )[/C][C]95.1066666666667[/C][C]0.826652762211577[/C][C]115.050322232305[/C][/ROW]
[ROW][C]Trimmed Mean ( 21 / 23 )[/C][C]95.05[/C][C]0.79984290785671[/C][C]118.835835220068[/C][/ROW]
[ROW][C]Trimmed Mean ( 22 / 23 )[/C][C]95[/C][C]0.774854825112421[/C][C]122.603611568421[/C][/ROW]
[ROW][C]Trimmed Mean ( 23 / 23 )[/C][C]94.9416666666667[/C][C]0.742960116223958[/C][C]127.788375975282[/C][/ROW]
[ROW][C]Median[/C][C]94[/C][C][/C][C][/C][/ROW]
[ROW][C]Midrange[/C][C]79.2[/C][C][/C][C][/C][/ROW]
[ROW][C]Midmean - Weighted Average at Xnp[/C][C]94.86[/C][C][/C][C][/C][/ROW]
[ROW][C]Midmean - Weighted Average at X(n+1)p[/C][C]95.1361111111111[/C][C][/C][C][/C][/ROW]
[ROW][C]Midmean - Empirical Distribution Function[/C][C]95.1361111111111[/C][C][/C][C][/C][/ROW]
[ROW][C]Midmean - Empirical Distribution Function - Averaging[/C][C]95.1361111111111[/C][C][/C][C][/C][/ROW]
[ROW][C]Midmean - Empirical Distribution Function - Interpolation[/C][C]95.1441176470588[/C][C][/C][C][/C][/ROW]
[ROW][C]Midmean - Closest Observation[/C][C]95.1361111111111[/C][C][/C][C][/C][/ROW]
[ROW][C]Midmean - True Basic - Statistics Graphics Toolkit[/C][C]95.1361111111111[/C][C][/C][C][/C][/ROW]
[ROW][C]Midmean - MS Excel (old versions)[/C][C]95.1361111111111[/C][C][/C][C][/C][/ROW]
[ROW][C]Number of observations[/C][C]70[/C][C][/C][C][/C][/ROW]
[/TABLE]
Source: https://freestatistics.org/blog/index.php?pk=30505&T=1

Globally Unique Identifier (entire table): ba.freestatistics.org/blog/index.php?pk=30505&T=1

As an alternative you can also use a QR Code:  

The GUIDs for individual cells are displayed in the table below:

Central Tendency - Ungrouped Data
MeasureValueS.E.Value/S.E.
Arithmetic Mean92.26857142857141.9431618625974547.4837290730042
Geometric Mean90.5251258330035
Harmonic Mean88.3305861909835
Quadratic Mean93.6697649038517
Winsorized Mean ( 1 / 23 )92.271.9389367110244247.5879380050781
Winsorized Mean ( 2 / 23 )92.37571428571431.8925411353858348.8104129197075
Winsorized Mean ( 3 / 23 )92.43571428571431.8604848493318449.6836694579432
Winsorized Mean ( 4 / 23 )92.68142857142861.7041640548088254.3852737122927
Winsorized Mean ( 5 / 23 )93.63857142857141.4589288064701564.1830985948712
Winsorized Mean ( 6 / 23 )93.66428571428571.4439077924516664.8686060175974
Winsorized Mean ( 7 / 23 )93.66428571428571.4439077924516664.8686060175974
Winsorized Mean ( 8 / 23 )93.85857142857141.3912362389976767.4641508017306
Winsorized Mean ( 9 / 23 )93.97428571428571.3189064510268371.2516688663721
Winsorized Mean ( 10 / 23 )93.961.3070035903138071.8896265445154
Winsorized Mean ( 11 / 23 )94.071.2702689596355874.055182791357
Winsorized Mean ( 12 / 23 )94.41285714285711.2023181911750878.5256829979283
Winsorized Mean ( 13 / 23 )94.85857142857141.0972702678995486.4495960600076
Winsorized Mean ( 14 / 23 )94.73857142857141.0790481444120987.7982802891418
Winsorized Mean ( 15 / 23 )94.78142857142861.0721416674591388.4038289417958
Winsorized Mean ( 16 / 23 )94.82714285714281.0016299788899494.6728281458142
Winsorized Mean ( 17 / 23 )95.070.949650366085004100.110528458945
Winsorized Mean ( 18 / 23 )95.22428571428570.919024678159061103.614503481053
Winsorized Mean ( 19 / 23 )95.360.80448895857684118.534877307321
Winsorized Mean ( 20 / 23 )95.560.760803215089879125.604095914225
Winsorized Mean ( 21 / 23 )95.440.709711981939496134.477087084231
Winsorized Mean ( 22 / 23 )95.440.683625095517662139.608684095674
Winsorized Mean ( 23 / 23 )95.11142857142860.601638696861886158.08728572069
Trimmed Mean ( 1 / 23 )92.65294117647061.839824387767450.3596657335886
Trimmed Mean ( 2 / 23 )93.0590909090911.7181520637277654.1623136122112
Trimmed Mean ( 3 / 23 )93.43281251.5999520309765858.3972585996658
Trimmed Mean ( 4 / 23 )93.8080645161291.4685983316375263.8759165765434
Trimmed Mean ( 5 / 23 )94.13666666666671.3716973004247268.62787193466
Trimmed Mean ( 6 / 23 )94.25689655172411.3395675008548270.3636781958175
Trimmed Mean ( 7 / 23 )94.38035714285721.3040755785475072.3733798066974
Trimmed Mean ( 8 / 23 )94.5129629629631.2596962749311675.0283737785346
Trimmed Mean ( 9 / 23 )94.6230769230771.2183012905577977.6680429188041
Trimmed Mean ( 10 / 23 )94.7241.1843005685782279.9830739874746
Trimmed Mean ( 11 / 23 )94.83541666666671.1435429639897982.9312230961475
Trimmed Mean ( 12 / 23 )94.9413043478261.1001957493239586.2949201595856
Trimmed Mean ( 13 / 23 )95.01136363636361.0612092503530189.5312245014437
Trimmed Mean ( 14 / 23 )95.03095238095241.0356955957035891.7556787681374
Trimmed Mean ( 15 / 23 )95.06751.0053981702635294.5570648642443
Trimmed Mean ( 16 / 23 )95.10263157894740.96579102406455498.4712315700613
Trimmed Mean ( 17 / 23 )95.13611111111110.930174525165205102.277700084524
Trimmed Mean ( 18 / 23 )95.14411764705880.894658253164253106.346884199135
Trimmed Mean ( 19 / 23 )95.1343750.85270690156691111.567497372408
Trimmed Mean ( 20 / 23 )95.10666666666670.826652762211577115.050322232305
Trimmed Mean ( 21 / 23 )95.050.79984290785671118.835835220068
Trimmed Mean ( 22 / 23 )950.774854825112421122.603611568421
Trimmed Mean ( 23 / 23 )94.94166666666670.742960116223958127.788375975282
Median94
Midrange79.2
Midmean - Weighted Average at Xnp94.86
Midmean - Weighted Average at X(n+1)p95.1361111111111
Midmean - Empirical Distribution Function95.1361111111111
Midmean - Empirical Distribution Function - Averaging95.1361111111111
Midmean - Empirical Distribution Function - Interpolation95.1441176470588
Midmean - Closest Observation95.1361111111111
Midmean - True Basic - Statistics Graphics Toolkit95.1361111111111
Midmean - MS Excel (old versions)95.1361111111111
Number of observations70


Parameters (Session):
Parameters (R input):
R code (references can be found in the software module):
geomean <- function(x) {
return(exp(mean(log(x))))
}
harmean <- function(x) {
return(1/mean(1/x))
}
quamean <- function(x) {
return(sqrt(mean(x*x)))
}
winmean <- function(x) {
x <-sort(x[!is.na(x)])
n<-length(x)
denom <- 3
nodenom <- n/denom
if (nodenom>40) denom <- n/40
sqrtn = sqrt(n)
roundnodenom = floor(nodenom)
win <- array(NA,dim=c(roundnodenom,2))
for (j in 1:roundnodenom) {
win[j,1] <- (j*x[j+1]+sum(x[(j+1):(n-j)])+j*x[n-j])/n
win[j,2] <- sd(c(rep(x[j+1],j),x[(j+1):(n-j)],rep(x[n-j],j)))/sqrtn
}
return(win)
}
trimean <- function(x) {
x <-sort(x[!is.na(x)])
n<-length(x)
denom <- 3
nodenom <- n/denom
if (nodenom>40) denom <- n/40
sqrtn = sqrt(n)
roundnodenom = floor(nodenom)
tri <- array(NA,dim=c(roundnodenom,2))
for (j in 1:roundnodenom) {
tri[j,1] <- mean(x,trim=j/n)
tri[j,2] <- sd(x[(j+1):(n-j)]) / sqrt(n-j*2)
}
return(tri)
}
midrange <- function(x) {
return((max(x)+min(x))/2)
}
q1 <- function(data,n,p,i,f) {
np <- n*p;
i <<- floor(np)
f <<- np - i
qvalue <- (1-f)*data[i] + f*data[i+1]
}
q2 <- function(data,n,p,i,f) {
np <- (n+1)*p
i <<- floor(np)
f <<- np - i
qvalue <- (1-f)*data[i] + f*data[i+1]
}
q3 <- function(data,n,p,i,f) {
np <- n*p
i <<- floor(np)
f <<- np - i
if (f==0) {
qvalue <- data[i]
} else {
qvalue <- data[i+1]
}
}
q4 <- function(data,n,p,i,f) {
np <- n*p
i <<- floor(np)
f <<- np - i
if (f==0) {
qvalue <- (data[i]+data[i+1])/2
} else {
qvalue <- data[i+1]
}
}
q5 <- function(data,n,p,i,f) {
np <- (n-1)*p
i <<- floor(np)
f <<- np - i
if (f==0) {
qvalue <- data[i+1]
} else {
qvalue <- data[i+1] + f*(data[i+2]-data[i+1])
}
}
q6 <- function(data,n,p,i,f) {
np <- n*p+0.5
i <<- floor(np)
f <<- np - i
qvalue <- data[i]
}
q7 <- function(data,n,p,i,f) {
np <- (n+1)*p
i <<- floor(np)
f <<- np - i
if (f==0) {
qvalue <- data[i]
} else {
qvalue <- f*data[i] + (1-f)*data[i+1]
}
}
q8 <- function(data,n,p,i,f) {
np <- (n+1)*p
i <<- floor(np)
f <<- np - i
if (f==0) {
qvalue <- data[i]
} else {
if (f == 0.5) {
qvalue <- (data[i]+data[i+1])/2
} else {
if (f < 0.5) {
qvalue <- data[i]
} else {
qvalue <- data[i+1]
}
}
}
}
midmean <- function(x,def) {
x <-sort(x[!is.na(x)])
n<-length(x)
if (def==1) {
qvalue1 <- q1(x,n,0.25,i,f)
qvalue3 <- q1(x,n,0.75,i,f)
}
if (def==2) {
qvalue1 <- q2(x,n,0.25,i,f)
qvalue3 <- q2(x,n,0.75,i,f)
}
if (def==3) {
qvalue1 <- q3(x,n,0.25,i,f)
qvalue3 <- q3(x,n,0.75,i,f)
}
if (def==4) {
qvalue1 <- q4(x,n,0.25,i,f)
qvalue3 <- q4(x,n,0.75,i,f)
}
if (def==5) {
qvalue1 <- q5(x,n,0.25,i,f)
qvalue3 <- q5(x,n,0.75,i,f)
}
if (def==6) {
qvalue1 <- q6(x,n,0.25,i,f)
qvalue3 <- q6(x,n,0.75,i,f)
}
if (def==7) {
qvalue1 <- q7(x,n,0.25,i,f)
qvalue3 <- q7(x,n,0.75,i,f)
}
if (def==8) {
qvalue1 <- q8(x,n,0.25,i,f)
qvalue3 <- q8(x,n,0.75,i,f)
}
midm <- 0
myn <- 0
roundno4 <- round(n/4)
round3no4 <- round(3*n/4)
for (i in 1:n) {
if ((x[i]>=qvalue1) & (x[i]<=qvalue3)){
midm = midm + x[i]
myn = myn + 1
}
}
midm = midm / myn
return(midm)
}
(arm <- mean(x))
sqrtn <- sqrt(length(x))
(armse <- sd(x) / sqrtn)
(armose <- arm / armse)
(geo <- geomean(x))
(har <- harmean(x))
(qua <- quamean(x))
(win <- winmean(x))
(tri <- trimean(x))
(midr <- midrange(x))
midm <- array(NA,dim=8)
for (j in 1:8) midm[j] <- midmean(x,j)
midm
bitmap(file='test1.png')
lb <- win[,1] - 2*win[,2]
ub <- win[,1] + 2*win[,2]
if ((ylimmin == '') | (ylimmax == '')) plot(win[,1],type='b',main=main, xlab='j', pch=19, ylab='Winsorized Mean(j/n)', ylim=c(min(lb),max(ub))) else plot(win[,1],type='l',main=main, xlab='j', pch=19, ylab='Winsorized Mean(j/n)', ylim=c(ylimmin,ylimmax))
lines(ub,lty=3)
lines(lb,lty=3)
grid()
dev.off()
bitmap(file='test2.png')
lb <- tri[,1] - 2*tri[,2]
ub <- tri[,1] + 2*tri[,2]
if ((ylimmin == '') | (ylimmax == '')) plot(tri[,1],type='b',main=main, xlab='j', pch=19, ylab='Trimmed Mean(j/n)', ylim=c(min(lb),max(ub))) else plot(tri[,1],type='l',main=main, xlab='j', pch=19, ylab='Trimmed Mean(j/n)', ylim=c(ylimmin,ylimmax))
lines(ub,lty=3)
lines(lb,lty=3)
grid()
dev.off()
load(file='createtable')
a<-table.start()
a<-table.row.start(a)
a<-table.element(a,'Central Tendency - Ungrouped Data',4,TRUE)
a<-table.row.end(a)
a<-table.row.start(a)
a<-table.element(a,'Measure',header=TRUE)
a<-table.element(a,'Value',header=TRUE)
a<-table.element(a,'S.E.',header=TRUE)
a<-table.element(a,'Value/S.E.',header=TRUE)
a<-table.row.end(a)
a<-table.row.start(a)
a<-table.element(a,hyperlink('arithmetic_mean.htm', 'Arithmetic Mean', 'click to view the definition of the Arithmetic Mean'),header=TRUE)
a<-table.element(a,arm)
a<-table.element(a,hyperlink('arithmetic_mean_standard_error.htm', armse, 'click to view the definition of the Standard Error of the Arithmetic Mean'))
a<-table.element(a,armose)
a<-table.row.end(a)
a<-table.row.start(a)
a<-table.element(a,hyperlink('geometric_mean.htm', 'Geometric Mean', 'click to view the definition of the Geometric Mean'),header=TRUE)
a<-table.element(a,geo)
a<-table.element(a,'')
a<-table.row.end(a)
a<-table.row.start(a)
a<-table.element(a,hyperlink('harmonic_mean.htm', 'Harmonic Mean', 'click to view the definition of the Harmonic Mean'),header=TRUE)
a<-table.element(a,har)
a<-table.element(a,'')
a<-table.row.end(a)
a<-table.row.start(a)
a<-table.element(a,hyperlink('quadratic_mean.htm', 'Quadratic Mean', 'click to view the definition of the Quadratic Mean'),header=TRUE)
a<-table.element(a,qua)
a<-table.element(a,'')
a<-table.row.end(a)
for (j in 1:length(win[,1])) {
a<-table.row.start(a)
mylabel <- paste('Winsorized Mean (',j)
mylabel <- paste(mylabel,'/')
mylabel <- paste(mylabel,length(win[,1]))
mylabel <- paste(mylabel,')')
a<-table.element(a,hyperlink('winsorized_mean.htm', mylabel, 'click to view the definition of the Winsorized Mean'),header=TRUE)
a<-table.element(a,win[j,1])
a<-table.element(a,win[j,2])
a<-table.element(a,win[j,1]/win[j,2])
a<-table.row.end(a)
}
for (j in 1:length(tri[,1])) {
a<-table.row.start(a)
mylabel <- paste('Trimmed Mean (',j)
mylabel <- paste(mylabel,'/')
mylabel <- paste(mylabel,length(tri[,1]))
mylabel <- paste(mylabel,')')
a<-table.element(a,hyperlink('arithmetic_mean.htm', mylabel, 'click to view the definition of the Trimmed Mean'),header=TRUE)
a<-table.element(a,tri[j,1])
a<-table.element(a,tri[j,2])
a<-table.element(a,tri[j,1]/tri[j,2])
a<-table.row.end(a)
}
a<-table.row.start(a)
a<-table.element(a,hyperlink('median_1.htm', 'Median', 'click to view the definition of the Median'),header=TRUE)
a<-table.element(a,median(x))
a<-table.element(a,'')
a<-table.row.end(a)
a<-table.row.start(a)
a<-table.element(a,hyperlink('midrange.htm', 'Midrange', 'click to view the definition of the Midrange'),header=TRUE)
a<-table.element(a,midr)
a<-table.element(a,'')
a<-table.row.end(a)
a<-table.row.start(a)
mymid <- hyperlink('midmean.htm', 'Midmean', 'click to view the definition of the Midmean')
mylabel <- paste(mymid,hyperlink('method_1.htm','Weighted Average at Xnp',''),sep=' - ')
a<-table.element(a,mylabel,header=TRUE)
a<-table.element(a,midm[1])
a<-table.element(a,'')
a<-table.row.end(a)
a<-table.row.start(a)
mymid <- hyperlink('midmean.htm', 'Midmean', 'click to view the definition of the Midmean')
mylabel <- paste(mymid,hyperlink('method_2.htm','Weighted Average at X(n+1)p',''),sep=' - ')
a<-table.element(a,mylabel,header=TRUE)
a<-table.element(a,midm[2])
a<-table.element(a,'')
a<-table.row.end(a)
a<-table.row.start(a)
mymid <- hyperlink('midmean.htm', 'Midmean', 'click to view the definition of the Midmean')
mylabel <- paste(mymid,hyperlink('method_3.htm','Empirical Distribution Function',''),sep=' - ')
a<-table.element(a,mylabel,header=TRUE)
a<-table.element(a,midm[3])
a<-table.element(a,'')
a<-table.row.end(a)
a<-table.row.start(a)
mymid <- hyperlink('midmean.htm', 'Midmean', 'click to view the definition of the Midmean')
mylabel <- paste(mymid,hyperlink('method_4.htm','Empirical Distribution Function - Averaging',''),sep=' - ')
a<-table.element(a,mylabel,header=TRUE)
a<-table.element(a,midm[4])
a<-table.element(a,'')
a<-table.row.end(a)
a<-table.row.start(a)
mymid <- hyperlink('midmean.htm', 'Midmean', 'click to view the definition of the Midmean')
mylabel <- paste(mymid,hyperlink('method_5.htm','Empirical Distribution Function - Interpolation',''),sep=' - ')
a<-table.element(a,mylabel,header=TRUE)
a<-table.element(a,midm[5])
a<-table.element(a,'')
a<-table.row.end(a)
a<-table.row.start(a)
mymid <- hyperlink('midmean.htm', 'Midmean', 'click to view the definition of the Midmean')
mylabel <- paste(mymid,hyperlink('method_6.htm','Closest Observation',''),sep=' - ')
a<-table.element(a,mylabel,header=TRUE)
a<-table.element(a,midm[6])
a<-table.element(a,'')
a<-table.row.end(a)
a<-table.row.start(a)
mymid <- hyperlink('midmean.htm', 'Midmean', 'click to view the definition of the Midmean')
mylabel <- paste(mymid,hyperlink('method_7.htm','True Basic - Statistics Graphics Toolkit',''),sep=' - ')
a<-table.element(a,mylabel,header=TRUE)
a<-table.element(a,midm[7])
a<-table.element(a,'')
a<-table.row.end(a)
a<-table.row.start(a)
mymid <- hyperlink('midmean.htm', 'Midmean', 'click to view the definition of the Midmean')
mylabel <- paste(mymid,hyperlink('method_8.htm','MS Excel (old versions)',''),sep=' - ')
a<-table.element(a,mylabel,header=TRUE)
a<-table.element(a,midm[8])
a<-table.element(a,'')
a<-table.row.end(a)
a<-table.row.start(a)
a<-table.element(a,'Number of observations',header=TRUE)
a<-table.element(a,length(x))
a<-table.element(a,'')
a<-table.row.end(a)
a<-table.end(a)
table.save(a,file='mytable.tab')