\begin{tabular}{lllllllll}
\hline
Summary of computational transaction \tabularnewline
Raw Input & view raw input (R code)  \tabularnewline
Raw Output & view raw output of R engine  \tabularnewline
Computing time & 1 seconds \tabularnewline
R Server & 'George Udny Yule' @ 72.249.76.132 \tabularnewline
\hline
\end{tabular}
%Source: https://freestatistics.org/blog/index.php?pk=38565&T=0
[TABLE]
[ROW][C]Summary of computational transaction[/C][/ROW]
[ROW][C]Raw Input[/C][C]view raw input (R code) [/C][/ROW]
[ROW][C]Raw Output[/C][C]view raw output of R engine [/C][/ROW]
[ROW][C]Computing time[/C][C]1 seconds[/C][/ROW]
[ROW][C]R Server[/C][C]'George Udny Yule' @ 72.249.76.132[/C][/ROW]
[/TABLE]
Source: https://freestatistics.org/blog/index.php?pk=38565&T=0
If you paste this QR Code into your document, anyone with a smartphone or tablet will be able to scan it and view this table in a browser.
If you paste this QR Code into your document, anyone with a smartphone or tablet will be able to scan it and view this table in a browser.
If you paste this QR Code into your document, anyone with a smartphone or tablet will be able to scan it and view this table in a browser.
If you paste this QR Code into your document, anyone with a smartphone or tablet will be able to scan it and view this table in a browser.
If you paste this QR Code into your document, anyone with a smartphone or tablet will be able to scan it and view this table in a browser.
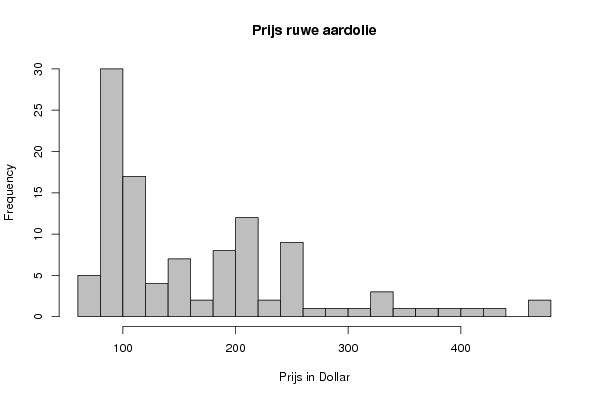
| Frequency Table (Histogram) | | Bins | Midpoint | Abs. Frequency | Rel. Frequency | Cumul. Rel. Freq. | Density | | [60,80[ | 70 | 5 | 0.045872 | 0.045872 | 0.002294 | | [80,100[ | 90 | 30 | 0.275229 | 0.321101 | 0.013761 | | [100,120[ | 110 | 17 | 0.155963 | 0.477064 | 0.007798 | | [120,140[ | 130 | 4 | 0.036697 | 0.513761 | 0.001835 | | [140,160[ | 150 | 7 | 0.06422 | 0.577982 | 0.003211 | | [160,180[ | 170 | 2 | 0.018349 | 0.59633 | 0.000917 | | [180,200[ | 190 | 8 | 0.073394 | 0.669725 | 0.00367 | | [200,220[ | 210 | 12 | 0.110092 | 0.779817 | 0.005505 | | [220,240[ | 230 | 2 | 0.018349 | 0.798165 | 0.000917 | | [240,260[ | 250 | 9 | 0.082569 | 0.880734 | 0.004128 | | [260,280[ | 270 | 1 | 0.009174 | 0.889908 | 0.000459 | | [280,300[ | 290 | 1 | 0.009174 | 0.899083 | 0.000459 | | [300,320[ | 310 | 1 | 0.009174 | 0.908257 | 0.000459 | | [320,340[ | 330 | 3 | 0.027523 | 0.93578 | 0.001376 | | [340,360[ | 350 | 1 | 0.009174 | 0.944954 | 0.000459 | | [360,380[ | 370 | 1 | 0.009174 | 0.954128 | 0.000459 | | [380,400[ | 390 | 1 | 0.009174 | 0.963303 | 0.000459 | | [400,420[ | 410 | 1 | 0.009174 | 0.972477 | 0.000459 | | [420,440[ | 430 | 1 | 0.009174 | 0.981651 | 0.000459 | | [440,460[ | 450 | 0 | 0 | 0.981651 | 0 | | [460,480] | 470 | 2 | 0.018349 | 1 | 0.000917 |
\begin{tabular}{lllllllll}
\hline
Frequency Table (Histogram) \tabularnewline
Bins & Midpoint & Abs. Frequency & Rel. Frequency & Cumul. Rel. Freq. & Density \tabularnewline
[60,80[ & 70 & 5 & 0.045872 & 0.045872 & 0.002294 \tabularnewline
[80,100[ & 90 & 30 & 0.275229 & 0.321101 & 0.013761 \tabularnewline
[100,120[ & 110 & 17 & 0.155963 & 0.477064 & 0.007798 \tabularnewline
[120,140[ & 130 & 4 & 0.036697 & 0.513761 & 0.001835 \tabularnewline
[140,160[ & 150 & 7 & 0.06422 & 0.577982 & 0.003211 \tabularnewline
[160,180[ & 170 & 2 & 0.018349 & 0.59633 & 0.000917 \tabularnewline
[180,200[ & 190 & 8 & 0.073394 & 0.669725 & 0.00367 \tabularnewline
[200,220[ & 210 & 12 & 0.110092 & 0.779817 & 0.005505 \tabularnewline
[220,240[ & 230 & 2 & 0.018349 & 0.798165 & 0.000917 \tabularnewline
[240,260[ & 250 & 9 & 0.082569 & 0.880734 & 0.004128 \tabularnewline
[260,280[ & 270 & 1 & 0.009174 & 0.889908 & 0.000459 \tabularnewline
[280,300[ & 290 & 1 & 0.009174 & 0.899083 & 0.000459 \tabularnewline
[300,320[ & 310 & 1 & 0.009174 & 0.908257 & 0.000459 \tabularnewline
[320,340[ & 330 & 3 & 0.027523 & 0.93578 & 0.001376 \tabularnewline
[340,360[ & 350 & 1 & 0.009174 & 0.944954 & 0.000459 \tabularnewline
[360,380[ & 370 & 1 & 0.009174 & 0.954128 & 0.000459 \tabularnewline
[380,400[ & 390 & 1 & 0.009174 & 0.963303 & 0.000459 \tabularnewline
[400,420[ & 410 & 1 & 0.009174 & 0.972477 & 0.000459 \tabularnewline
[420,440[ & 430 & 1 & 0.009174 & 0.981651 & 0.000459 \tabularnewline
[440,460[ & 450 & 0 & 0 & 0.981651 & 0 \tabularnewline
[460,480] & 470 & 2 & 0.018349 & 1 & 0.000917 \tabularnewline
\hline
\end{tabular}
%Source: https://freestatistics.org/blog/index.php?pk=38565&T=1
[TABLE]
[ROW][C]Frequency Table (Histogram)[/C][/ROW]
[ROW][C]Bins[/C][C]Midpoint[/C][C]Abs. Frequency[/C][C]Rel. Frequency[/C][C]Cumul. Rel. Freq.[/C][C]Density[/C][/ROW]
[ROW][C][60,80[[/C][C]70[/C][C]5[/C][C]0.045872[/C][C]0.045872[/C][C]0.002294[/C][/ROW]
[ROW][C][80,100[[/C][C]90[/C][C]30[/C][C]0.275229[/C][C]0.321101[/C][C]0.013761[/C][/ROW]
[ROW][C][100,120[[/C][C]110[/C][C]17[/C][C]0.155963[/C][C]0.477064[/C][C]0.007798[/C][/ROW]
[ROW][C][120,140[[/C][C]130[/C][C]4[/C][C]0.036697[/C][C]0.513761[/C][C]0.001835[/C][/ROW]
[ROW][C][140,160[[/C][C]150[/C][C]7[/C][C]0.06422[/C][C]0.577982[/C][C]0.003211[/C][/ROW]
[ROW][C][160,180[[/C][C]170[/C][C]2[/C][C]0.018349[/C][C]0.59633[/C][C]0.000917[/C][/ROW]
[ROW][C][180,200[[/C][C]190[/C][C]8[/C][C]0.073394[/C][C]0.669725[/C][C]0.00367[/C][/ROW]
[ROW][C][200,220[[/C][C]210[/C][C]12[/C][C]0.110092[/C][C]0.779817[/C][C]0.005505[/C][/ROW]
[ROW][C][220,240[[/C][C]230[/C][C]2[/C][C]0.018349[/C][C]0.798165[/C][C]0.000917[/C][/ROW]
[ROW][C][240,260[[/C][C]250[/C][C]9[/C][C]0.082569[/C][C]0.880734[/C][C]0.004128[/C][/ROW]
[ROW][C][260,280[[/C][C]270[/C][C]1[/C][C]0.009174[/C][C]0.889908[/C][C]0.000459[/C][/ROW]
[ROW][C][280,300[[/C][C]290[/C][C]1[/C][C]0.009174[/C][C]0.899083[/C][C]0.000459[/C][/ROW]
[ROW][C][300,320[[/C][C]310[/C][C]1[/C][C]0.009174[/C][C]0.908257[/C][C]0.000459[/C][/ROW]
[ROW][C][320,340[[/C][C]330[/C][C]3[/C][C]0.027523[/C][C]0.93578[/C][C]0.001376[/C][/ROW]
[ROW][C][340,360[[/C][C]350[/C][C]1[/C][C]0.009174[/C][C]0.944954[/C][C]0.000459[/C][/ROW]
[ROW][C][360,380[[/C][C]370[/C][C]1[/C][C]0.009174[/C][C]0.954128[/C][C]0.000459[/C][/ROW]
[ROW][C][380,400[[/C][C]390[/C][C]1[/C][C]0.009174[/C][C]0.963303[/C][C]0.000459[/C][/ROW]
[ROW][C][400,420[[/C][C]410[/C][C]1[/C][C]0.009174[/C][C]0.972477[/C][C]0.000459[/C][/ROW]
[ROW][C][420,440[[/C][C]430[/C][C]1[/C][C]0.009174[/C][C]0.981651[/C][C]0.000459[/C][/ROW]
[ROW][C][440,460[[/C][C]450[/C][C]0[/C][C]0[/C][C]0.981651[/C][C]0[/C][/ROW]
[ROW][C][460,480][/C][C]470[/C][C]2[/C][C]0.018349[/C][C]1[/C][C]0.000917[/C][/ROW]
[/TABLE]
Source: https://freestatistics.org/blog/index.php?pk=38565&T=1
Globally Unique Identifier (entire table): ba.freestatistics.org/blog/index.php?pk=38565&T=1
As an alternative you can also use a QR Code:
The GUIDs for individual cells are displayed in the table below:
| Frequency Table (Histogram) | | Bins | Midpoint | Abs. Frequency | Rel. Frequency | Cumul. Rel. Freq. | Density | | [60,80[ | 70 | 5 | 0.045872 | 0.045872 | 0.002294 | | [80,100[ | 90 | 30 | 0.275229 | 0.321101 | 0.013761 | | [100,120[ | 110 | 17 | 0.155963 | 0.477064 | 0.007798 | | [120,140[ | 130 | 4 | 0.036697 | 0.513761 | 0.001835 | | [140,160[ | 150 | 7 | 0.06422 | 0.577982 | 0.003211 | | [160,180[ | 170 | 2 | 0.018349 | 0.59633 | 0.000917 | | [180,200[ | 190 | 8 | 0.073394 | 0.669725 | 0.00367 | | [200,220[ | 210 | 12 | 0.110092 | 0.779817 | 0.005505 | | [220,240[ | 230 | 2 | 0.018349 | 0.798165 | 0.000917 | | [240,260[ | 250 | 9 | 0.082569 | 0.880734 | 0.004128 | | [260,280[ | 270 | 1 | 0.009174 | 0.889908 | 0.000459 | | [280,300[ | 290 | 1 | 0.009174 | 0.899083 | 0.000459 | | [300,320[ | 310 | 1 | 0.009174 | 0.908257 | 0.000459 | | [320,340[ | 330 | 3 | 0.027523 | 0.93578 | 0.001376 | | [340,360[ | 350 | 1 | 0.009174 | 0.944954 | 0.000459 | | [360,380[ | 370 | 1 | 0.009174 | 0.954128 | 0.000459 | | [380,400[ | 390 | 1 | 0.009174 | 0.963303 | 0.000459 | | [400,420[ | 410 | 1 | 0.009174 | 0.972477 | 0.000459 | | [420,440[ | 430 | 1 | 0.009174 | 0.981651 | 0.000459 | | [440,460[ | 450 | 0 | 0 | 0.981651 | 0 | | [460,480] | 470 | 2 | 0.018349 | 1 | 0.000917 |
If you paste this QR Code into your document, anyone with a smartphone or tablet will be able to scan it and view this table in a browser.
If you paste this QR Code into your document, anyone with a smartphone or tablet will be able to scan it and view this table in a browser.
If you paste this QR Code into your document, anyone with a smartphone or tablet will be able to scan it and view this table in a browser.
If you paste this QR Code into your document, anyone with a smartphone or tablet will be able to scan it and view this table in a browser.
If you paste this QR Code into your document, anyone with a smartphone or tablet will be able to scan it and view this table in a browser.
|