Free Statistics

of Irreproducible Research!

Author's title

Author*The author of this computation has been verified*
R Software Modulerwasp_multipleregression.wasp
Title produced by softwareMultiple Regression
Date of computationFri, 20 Nov 2009 13:17:21 -0700
Cite this page as followsStatistical Computations at FreeStatistics.org, Office for Research Development and Education, URL https://freestatistics.org/blog/index.php?v=date/2009/Nov/20/t1258748444yn0pxswrilq5egg.htm/, Retrieved Sun, 10 Nov 2024 19:48:30 +0000
Statistical Computations at FreeStatistics.org, Office for Research Development and Education, URL https://freestatistics.org/blog/index.php?pk=58454, Retrieved Sun, 10 Nov 2024 19:48:30 +0000
QR Codes:

Original text written by user:
IsPrivate?No (this computation is public)
User-defined keywords
Estimated Impact191
Family? (F = Feedback message, R = changed R code, M = changed R Module, P = changed Parameters, D = changed Data)
-     [Multiple Regression] [Q1 The Seatbeltlaw] [2007-11-14 19:27:43] [8cd6641b921d30ebe00b648d1481bba0]
- RM D  [Multiple Regression] [Seatbelt] [2009-11-12 14:10:54] [b98453cac15ba1066b407e146608df68]
-   PD      [Multiple Regression] [JJ Workshop 7, Op...] [2009-11-20 20:17:21] [e31f2fa83f4a5291b9a51009566cf69b] [Current]
Feedback Forum

Post a new message
Dataseries X:
95.1	93.8	111.7
97	93.8	98.6
112.7	107.6	96.9
102.9	101	95.1
97.4	95.4	97
111.4	96.5	112.7
87.4	89.2	102.9
96.8	87.1	97.4
114.1	110.5	111.4
110.3	110.8	87.4
103.9	104.2	96.8
101.6	88.9	114.1
94.6	89.8	110.3
95.9	90	103.9
104.7	93.9	101.6
102.8	91.3	94.6
98.1	87.8	95.9
113.9	99.7	104.7
80.9	73.5	102.8
95.7	79.2	98.1
113.2	96.9	113.9
105.9	95.2	80.9
108.8	95.6	95.7
102.3	89.7	113.2
99	92.8	105.9
100.7	88	108.8
115.5	101.1	102.3
100.7	92.7	99
109.9	95.8	100.7
114.6	103.8	115.5
85.4	81.8	100.7
100.5	87.1	109.9
114.8	105.9	114.6
116.5	108.1	85.4
112.9	102.6	100.5
102	93.7	114.8
106	103.5	116.5
105.3	100.6	112.9
118.8	113.3	102
106.1	102.4	106
109.3	102.1	105.3
117.2	106.9	118.8
92.5	87.3	106.1
104.2	93.1	109.3
112.5	109.1	117.2
122.4	120.3	92.5
113.3	104.9	104.2
100	92.6	112.5
110.7	109.8	122.4
112.8	111.4	113.3
109.8	117.9	100
117.3	121.6	110.7
109.1	117.8	112.8
115.9	124.2	109.8
96	106.8	117.3
99.8	102.7	109.1
116.8	116.8	115.9
115.7	113.6	96
99.4	96.1	99.8
94.3	85	116.8


Summary of computational transaction
Raw Inputview raw input (R code)
Raw Outputview raw output of R engine
Computing time3 seconds
R Server'Gwilym Jenkins' @ 72.249.127.135

\begin{tabular}{lllllllll}
\hline
Summary of computational transaction \tabularnewline
Raw Input & view raw input (R code)  \tabularnewline
Raw Output & view raw output of R engine  \tabularnewline
Computing time & 3 seconds \tabularnewline
R Server & 'Gwilym Jenkins' @ 72.249.127.135 \tabularnewline
\hline
\end{tabular}
%Source: https://freestatistics.org/blog/index.php?pk=58454&T=0

[TABLE]
[ROW][C]Summary of computational transaction[/C][/ROW]
[ROW][C]Raw Input[/C][C]view raw input (R code) [/C][/ROW]
[ROW][C]Raw Output[/C][C]view raw output of R engine [/C][/ROW]
[ROW][C]Computing time[/C][C]3 seconds[/C][/ROW]
[ROW][C]R Server[/C][C]'Gwilym Jenkins' @ 72.249.127.135[/C][/ROW]
[/TABLE]
Source: https://freestatistics.org/blog/index.php?pk=58454&T=0

Globally Unique Identifier (entire table): ba.freestatistics.org/blog/index.php?pk=58454&T=0

As an alternative you can also use a QR Code:  

The GUIDs for individual cells are displayed in the table below:

Summary of computational transaction
Raw Inputview raw input (R code)
Raw Outputview raw output of R engine
Computing time3 seconds
R Server'Gwilym Jenkins' @ 72.249.127.135


Multiple Linear Regression - Estimated Regression Equation
TIA[t] = + 34.5997540927041 + 0.298221021904011IAidM[t] + 0.3378221767271`TIA(t-3)`[t] -1.02304293176696M1[t] + 2.56849582970055M2[t] + 11.8907715171465M3[t] + 6.85428025389231M4[t] + 5.83103077546227M5[t] + 10.3857785141985M6[t] -8.11533998012746M7[t] + 2.61781806550856M8[t] + 8.80566945224169M9[t] + 16.9982285968716M10[t] + 9.45582905532634M11[t] + e[t]

\begin{tabular}{lllllllll}
\hline
Multiple Linear Regression - Estimated Regression Equation \tabularnewline
TIA[t] =  +  34.5997540927041 +  0.298221021904011IAidM[t] +  0.3378221767271`TIA(t-3)`[t] -1.02304293176696M1[t] +  2.56849582970055M2[t] +  11.8907715171465M3[t] +  6.85428025389231M4[t] +  5.83103077546227M5[t] +  10.3857785141985M6[t] -8.11533998012746M7[t] +  2.61781806550856M8[t] +  8.80566945224169M9[t] +  16.9982285968716M10[t] +  9.45582905532634M11[t]  + e[t] \tabularnewline
\hline
\end{tabular}
%Source: https://freestatistics.org/blog/index.php?pk=58454&T=1

[TABLE]
[ROW][C]Multiple Linear Regression - Estimated Regression Equation[/C][/ROW]
[ROW][C]TIA[t] =  +  34.5997540927041 +  0.298221021904011IAidM[t] +  0.3378221767271`TIA(t-3)`[t] -1.02304293176696M1[t] +  2.56849582970055M2[t] +  11.8907715171465M3[t] +  6.85428025389231M4[t] +  5.83103077546227M5[t] +  10.3857785141985M6[t] -8.11533998012746M7[t] +  2.61781806550856M8[t] +  8.80566945224169M9[t] +  16.9982285968716M10[t] +  9.45582905532634M11[t]  + e[t][/C][/ROW]
[/TABLE]
Source: https://freestatistics.org/blog/index.php?pk=58454&T=1

Globally Unique Identifier (entire table): ba.freestatistics.org/blog/index.php?pk=58454&T=1

As an alternative you can also use a QR Code:  

The GUIDs for individual cells are displayed in the table below:

Multiple Linear Regression - Estimated Regression Equation
TIA[t] = + 34.5997540927041 + 0.298221021904011IAidM[t] + 0.3378221767271`TIA(t-3)`[t] -1.02304293176696M1[t] + 2.56849582970055M2[t] + 11.8907715171465M3[t] + 6.85428025389231M4[t] + 5.83103077546227M5[t] + 10.3857785141985M6[t] -8.11533998012746M7[t] + 2.61781806550856M8[t] + 8.80566945224169M9[t] + 16.9982285968716M10[t] + 9.45582905532634M11[t] + e[t]


Multiple Linear Regression - Ordinary Least Squares
VariableParameterS.D.T-STATH0: parameter = 02-tail p-value1-tail p-value
(Intercept)34.599754092704111.1510533.10280.0032730.001636
IAidM0.2982210219040110.0711174.19340.0001246.2e-05
`TIA(t-3)`0.33782217672710.1226322.75480.0083860.004193
M1-1.023042931766962.310845-0.44270.6600480.330024
M22.568495829700552.5228071.01810.3139510.156975
M311.89077151714653.4299613.46670.0011530.000577
M46.854280253892313.1628322.16710.0354380.017719
M55.831030775462272.9779521.95810.0563030.028152
M610.38577851419852.5842774.01880.0002150.000107
M7-8.115339980127462.404222-3.37550.0015060.000753
M82.617818065508562.504531.04520.3013770.150688
M98.805669452241692.5446443.46050.0011740.000587
M1016.99822859687164.7545443.57520.0008360.000418
M119.455829055326343.2590212.90140.0056820.002841

\begin{tabular}{lllllllll}
\hline
Multiple Linear Regression - Ordinary Least Squares \tabularnewline
Variable & Parameter & S.D. & T-STATH0: parameter = 0 & 2-tail p-value & 1-tail p-value \tabularnewline
(Intercept) & 34.5997540927041 & 11.151053 & 3.1028 & 0.003273 & 0.001636 \tabularnewline
IAidM & 0.298221021904011 & 0.071117 & 4.1934 & 0.000124 & 6.2e-05 \tabularnewline
`TIA(t-3)` & 0.3378221767271 & 0.122632 & 2.7548 & 0.008386 & 0.004193 \tabularnewline
M1 & -1.02304293176696 & 2.310845 & -0.4427 & 0.660048 & 0.330024 \tabularnewline
M2 & 2.56849582970055 & 2.522807 & 1.0181 & 0.313951 & 0.156975 \tabularnewline
M3 & 11.8907715171465 & 3.429961 & 3.4667 & 0.001153 & 0.000577 \tabularnewline
M4 & 6.85428025389231 & 3.162832 & 2.1671 & 0.035438 & 0.017719 \tabularnewline
M5 & 5.83103077546227 & 2.977952 & 1.9581 & 0.056303 & 0.028152 \tabularnewline
M6 & 10.3857785141985 & 2.584277 & 4.0188 & 0.000215 & 0.000107 \tabularnewline
M7 & -8.11533998012746 & 2.404222 & -3.3755 & 0.001506 & 0.000753 \tabularnewline
M8 & 2.61781806550856 & 2.50453 & 1.0452 & 0.301377 & 0.150688 \tabularnewline
M9 & 8.80566945224169 & 2.544644 & 3.4605 & 0.001174 & 0.000587 \tabularnewline
M10 & 16.9982285968716 & 4.754544 & 3.5752 & 0.000836 & 0.000418 \tabularnewline
M11 & 9.45582905532634 & 3.259021 & 2.9014 & 0.005682 & 0.002841 \tabularnewline
\hline
\end{tabular}
%Source: https://freestatistics.org/blog/index.php?pk=58454&T=2

[TABLE]
[ROW][C]Multiple Linear Regression - Ordinary Least Squares[/C][/ROW]
[ROW][C]Variable[/C][C]Parameter[/C][C]S.D.[/C][C]T-STATH0: parameter = 0[/C][C]2-tail p-value[/C][C]1-tail p-value[/C][/ROW]
[ROW][C](Intercept)[/C][C]34.5997540927041[/C][C]11.151053[/C][C]3.1028[/C][C]0.003273[/C][C]0.001636[/C][/ROW]
[ROW][C]IAidM[/C][C]0.298221021904011[/C][C]0.071117[/C][C]4.1934[/C][C]0.000124[/C][C]6.2e-05[/C][/ROW]
[ROW][C]`TIA(t-3)`[/C][C]0.3378221767271[/C][C]0.122632[/C][C]2.7548[/C][C]0.008386[/C][C]0.004193[/C][/ROW]
[ROW][C]M1[/C][C]-1.02304293176696[/C][C]2.310845[/C][C]-0.4427[/C][C]0.660048[/C][C]0.330024[/C][/ROW]
[ROW][C]M2[/C][C]2.56849582970055[/C][C]2.522807[/C][C]1.0181[/C][C]0.313951[/C][C]0.156975[/C][/ROW]
[ROW][C]M3[/C][C]11.8907715171465[/C][C]3.429961[/C][C]3.4667[/C][C]0.001153[/C][C]0.000577[/C][/ROW]
[ROW][C]M4[/C][C]6.85428025389231[/C][C]3.162832[/C][C]2.1671[/C][C]0.035438[/C][C]0.017719[/C][/ROW]
[ROW][C]M5[/C][C]5.83103077546227[/C][C]2.977952[/C][C]1.9581[/C][C]0.056303[/C][C]0.028152[/C][/ROW]
[ROW][C]M6[/C][C]10.3857785141985[/C][C]2.584277[/C][C]4.0188[/C][C]0.000215[/C][C]0.000107[/C][/ROW]
[ROW][C]M7[/C][C]-8.11533998012746[/C][C]2.404222[/C][C]-3.3755[/C][C]0.001506[/C][C]0.000753[/C][/ROW]
[ROW][C]M8[/C][C]2.61781806550856[/C][C]2.50453[/C][C]1.0452[/C][C]0.301377[/C][C]0.150688[/C][/ROW]
[ROW][C]M9[/C][C]8.80566945224169[/C][C]2.544644[/C][C]3.4605[/C][C]0.001174[/C][C]0.000587[/C][/ROW]
[ROW][C]M10[/C][C]16.9982285968716[/C][C]4.754544[/C][C]3.5752[/C][C]0.000836[/C][C]0.000418[/C][/ROW]
[ROW][C]M11[/C][C]9.45582905532634[/C][C]3.259021[/C][C]2.9014[/C][C]0.005682[/C][C]0.002841[/C][/ROW]
[/TABLE]
Source: https://freestatistics.org/blog/index.php?pk=58454&T=2

Globally Unique Identifier (entire table): ba.freestatistics.org/blog/index.php?pk=58454&T=2

As an alternative you can also use a QR Code:  

The GUIDs for individual cells are displayed in the table below:

Multiple Linear Regression - Ordinary Least Squares
VariableParameterS.D.T-STATH0: parameter = 02-tail p-value1-tail p-value
(Intercept)34.599754092704111.1510533.10280.0032730.001636
IAidM0.2982210219040110.0711174.19340.0001246.2e-05
`TIA(t-3)`0.33782217672710.1226322.75480.0083860.004193
M1-1.023042931766962.310845-0.44270.6600480.330024
M22.568495829700552.5228071.01810.3139510.156975
M311.89077151714653.4299613.46670.0011530.000577
M46.854280253892313.1628322.16710.0354380.017719
M55.831030775462272.9779521.95810.0563030.028152
M610.38577851419852.5842774.01880.0002150.000107
M7-8.115339980127462.404222-3.37550.0015060.000753
M82.617818065508562.504531.04520.3013770.150688
M98.805669452241692.5446443.46050.0011740.000587
M1016.99822859687164.7545443.57520.0008360.000418
M119.455829055326343.2590212.90140.0056820.002841


Multiple Linear Regression - Regression Statistics
Multiple R0.938876145706808
R-squared0.881488416977271
Adjusted R-squared0.847996013079543
F-TEST (value)26.3190549017914
F-TEST (DF numerator)13
F-TEST (DF denominator)46
p-value0
Multiple Linear Regression - Residual Statistics
Residual Standard Deviation3.50877077042316
Sum Squared Residuals566.327726691294

\begin{tabular}{lllllllll}
\hline
Multiple Linear Regression - Regression Statistics \tabularnewline
Multiple R & 0.938876145706808 \tabularnewline
R-squared & 0.881488416977271 \tabularnewline
Adjusted R-squared & 0.847996013079543 \tabularnewline
F-TEST (value) & 26.3190549017914 \tabularnewline
F-TEST (DF numerator) & 13 \tabularnewline
F-TEST (DF denominator) & 46 \tabularnewline
p-value & 0 \tabularnewline
Multiple Linear Regression - Residual Statistics \tabularnewline
Residual Standard Deviation & 3.50877077042316 \tabularnewline
Sum Squared Residuals & 566.327726691294 \tabularnewline
\hline
\end{tabular}
%Source: https://freestatistics.org/blog/index.php?pk=58454&T=3

[TABLE]
[ROW][C]Multiple Linear Regression - Regression Statistics[/C][/ROW]
[ROW][C]Multiple R[/C][C]0.938876145706808[/C][/ROW]
[ROW][C]R-squared[/C][C]0.881488416977271[/C][/ROW]
[ROW][C]Adjusted R-squared[/C][C]0.847996013079543[/C][/ROW]
[ROW][C]F-TEST (value)[/C][C]26.3190549017914[/C][/ROW]
[ROW][C]F-TEST (DF numerator)[/C][C]13[/C][/ROW]
[ROW][C]F-TEST (DF denominator)[/C][C]46[/C][/ROW]
[ROW][C]p-value[/C][C]0[/C][/ROW]
[ROW][C]Multiple Linear Regression - Residual Statistics[/C][/ROW]
[ROW][C]Residual Standard Deviation[/C][C]3.50877077042316[/C][/ROW]
[ROW][C]Sum Squared Residuals[/C][C]566.327726691294[/C][/ROW]
[/TABLE]
Source: https://freestatistics.org/blog/index.php?pk=58454&T=3

Globally Unique Identifier (entire table): ba.freestatistics.org/blog/index.php?pk=58454&T=3

As an alternative you can also use a QR Code:  

The GUIDs for individual cells are displayed in the table below:

Multiple Linear Regression - Regression Statistics
Multiple R0.938876145706808
R-squared0.881488416977271
Adjusted R-squared0.847996013079543
F-TEST (value)26.3190549017914
F-TEST (DF numerator)13
F-TEST (DF denominator)46
p-value0
Multiple Linear Regression - Residual Statistics
Residual Standard Deviation3.50877077042316
Sum Squared Residuals566.327726691294


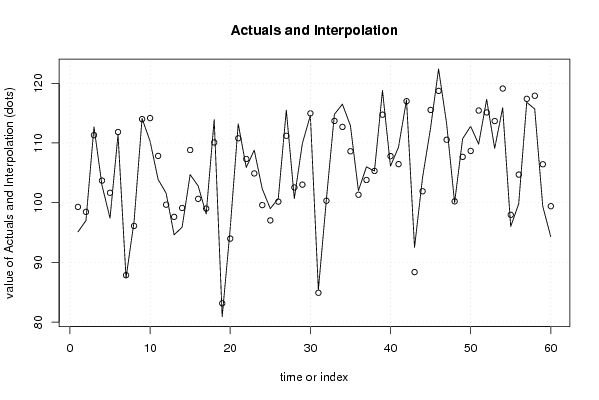
Multiple Linear Regression - Actuals, Interpolation, and Residuals
Time or IndexActualsInterpolationForecastResidualsPrediction Error
195.199.2845801559503-4.18458015595026
29798.450648402293-1.45064840229292
3112.7111.3140764915781.38592350842182
4102.9103.701246565649-0.801246565648725
597.4101.649821500338-4.24982150033771
6111.4111.836420537784-0.436420537783846
787.487.847631251633-0.447631251633005
896.896.09650317927160.703496820728446
9114.1113.9922369527380.107763047262040
10110.3114.166530162489-3.86653016248863
11103.9107.831400337612-3.93140033761166
12101.699.65711330453281.94288669546721
1394.697.6187450209164-3.01874502091646
1495.999.1078660557113-3.20786605571133
15104.7108.816212722111-4.1162127221106
16102.8100.6395915648162.16040843518373
1798.199.0117373394674-0.911737339467426
18113.9110.088150394063.81184960594011
1980.983.1317789900673-2.23177899006733
2095.793.97703262993881.72296737006117
21113.2110.7809864966612.41901350333886
22105.9107.31843807206-1.41843807205991
23108.8104.8950951548373.90490484516264
24102.399.59165016300162.70834983699839
259997.02699050902921.97300949097075
26100.7100.1667526778660.533247322133904
27115.5111.1998796035284.30012039647155
28100.7102.543518573081-1.84351857308113
29109.9103.0190519629906.88094803701041
30114.6114.959336092519-0.359336092519019
3185.484.89758690074370.502413099256293
32100.5100.3192803883600.180719611639698
33114.8113.7014512175061.09854878249378
34116.5112.6856890498943.8143109501064
35112.9108.6041887564564.29581124354449
36102101.3250497333810.67495026661899
37106103.7988705167092.20112948329057
38105.3105.309408478438-0.00940847843775233
39118.8114.7368294177394.06317058226074
40106.1107.801017722640-1.70101772263975
41109.3106.4518264139302.84817358607048
42117.2116.9986344436210.201365556379122
4392.588.36204227554214.13795772445789
44104.2101.9059132137482.29408678625189
45112.5115.534096147090-3.03409614708951
46122.4118.7225229718853.67747702811506
47113.3110.5400391607252.75996083927499
48100100.220015602814-0.220015602814265
49110.7107.6708137973953.02918620260541
50112.8108.6653243856924.13467561430809
51109.8115.433001765044-5.63300176504351
52117.3115.1146255738142.18537442618588
53109.1113.667562783276-4.56756278327575
54115.9119.117458532016-3.21745853201637
559697.9609605820139-1.96096058201385
5699.8104.701270588681-4.9012705886812
57116.8117.391229186005-0.59122918600517
58115.7117.906819743673-2.20681974367292
5999.4106.429276590370-7.02927659037046
6094.399.4061711962703-5.10617119627032

\begin{tabular}{lllllllll}
\hline
Multiple Linear Regression - Actuals, Interpolation, and Residuals \tabularnewline
Time or Index & Actuals & InterpolationForecast & ResidualsPrediction Error \tabularnewline
1 & 95.1 & 99.2845801559503 & -4.18458015595026 \tabularnewline
2 & 97 & 98.450648402293 & -1.45064840229292 \tabularnewline
3 & 112.7 & 111.314076491578 & 1.38592350842182 \tabularnewline
4 & 102.9 & 103.701246565649 & -0.801246565648725 \tabularnewline
5 & 97.4 & 101.649821500338 & -4.24982150033771 \tabularnewline
6 & 111.4 & 111.836420537784 & -0.436420537783846 \tabularnewline
7 & 87.4 & 87.847631251633 & -0.447631251633005 \tabularnewline
8 & 96.8 & 96.0965031792716 & 0.703496820728446 \tabularnewline
9 & 114.1 & 113.992236952738 & 0.107763047262040 \tabularnewline
10 & 110.3 & 114.166530162489 & -3.86653016248863 \tabularnewline
11 & 103.9 & 107.831400337612 & -3.93140033761166 \tabularnewline
12 & 101.6 & 99.6571133045328 & 1.94288669546721 \tabularnewline
13 & 94.6 & 97.6187450209164 & -3.01874502091646 \tabularnewline
14 & 95.9 & 99.1078660557113 & -3.20786605571133 \tabularnewline
15 & 104.7 & 108.816212722111 & -4.1162127221106 \tabularnewline
16 & 102.8 & 100.639591564816 & 2.16040843518373 \tabularnewline
17 & 98.1 & 99.0117373394674 & -0.911737339467426 \tabularnewline
18 & 113.9 & 110.08815039406 & 3.81184960594011 \tabularnewline
19 & 80.9 & 83.1317789900673 & -2.23177899006733 \tabularnewline
20 & 95.7 & 93.9770326299388 & 1.72296737006117 \tabularnewline
21 & 113.2 & 110.780986496661 & 2.41901350333886 \tabularnewline
22 & 105.9 & 107.31843807206 & -1.41843807205991 \tabularnewline
23 & 108.8 & 104.895095154837 & 3.90490484516264 \tabularnewline
24 & 102.3 & 99.5916501630016 & 2.70834983699839 \tabularnewline
25 & 99 & 97.0269905090292 & 1.97300949097075 \tabularnewline
26 & 100.7 & 100.166752677866 & 0.533247322133904 \tabularnewline
27 & 115.5 & 111.199879603528 & 4.30012039647155 \tabularnewline
28 & 100.7 & 102.543518573081 & -1.84351857308113 \tabularnewline
29 & 109.9 & 103.019051962990 & 6.88094803701041 \tabularnewline
30 & 114.6 & 114.959336092519 & -0.359336092519019 \tabularnewline
31 & 85.4 & 84.8975869007437 & 0.502413099256293 \tabularnewline
32 & 100.5 & 100.319280388360 & 0.180719611639698 \tabularnewline
33 & 114.8 & 113.701451217506 & 1.09854878249378 \tabularnewline
34 & 116.5 & 112.685689049894 & 3.8143109501064 \tabularnewline
35 & 112.9 & 108.604188756456 & 4.29581124354449 \tabularnewline
36 & 102 & 101.325049733381 & 0.67495026661899 \tabularnewline
37 & 106 & 103.798870516709 & 2.20112948329057 \tabularnewline
38 & 105.3 & 105.309408478438 & -0.00940847843775233 \tabularnewline
39 & 118.8 & 114.736829417739 & 4.06317058226074 \tabularnewline
40 & 106.1 & 107.801017722640 & -1.70101772263975 \tabularnewline
41 & 109.3 & 106.451826413930 & 2.84817358607048 \tabularnewline
42 & 117.2 & 116.998634443621 & 0.201365556379122 \tabularnewline
43 & 92.5 & 88.3620422755421 & 4.13795772445789 \tabularnewline
44 & 104.2 & 101.905913213748 & 2.29408678625189 \tabularnewline
45 & 112.5 & 115.534096147090 & -3.03409614708951 \tabularnewline
46 & 122.4 & 118.722522971885 & 3.67747702811506 \tabularnewline
47 & 113.3 & 110.540039160725 & 2.75996083927499 \tabularnewline
48 & 100 & 100.220015602814 & -0.220015602814265 \tabularnewline
49 & 110.7 & 107.670813797395 & 3.02918620260541 \tabularnewline
50 & 112.8 & 108.665324385692 & 4.13467561430809 \tabularnewline
51 & 109.8 & 115.433001765044 & -5.63300176504351 \tabularnewline
52 & 117.3 & 115.114625573814 & 2.18537442618588 \tabularnewline
53 & 109.1 & 113.667562783276 & -4.56756278327575 \tabularnewline
54 & 115.9 & 119.117458532016 & -3.21745853201637 \tabularnewline
55 & 96 & 97.9609605820139 & -1.96096058201385 \tabularnewline
56 & 99.8 & 104.701270588681 & -4.9012705886812 \tabularnewline
57 & 116.8 & 117.391229186005 & -0.59122918600517 \tabularnewline
58 & 115.7 & 117.906819743673 & -2.20681974367292 \tabularnewline
59 & 99.4 & 106.429276590370 & -7.02927659037046 \tabularnewline
60 & 94.3 & 99.4061711962703 & -5.10617119627032 \tabularnewline
\hline
\end{tabular}
%Source: https://freestatistics.org/blog/index.php?pk=58454&T=4

[TABLE]
[ROW][C]Multiple Linear Regression - Actuals, Interpolation, and Residuals[/C][/ROW]
[ROW][C]Time or Index[/C][C]Actuals[/C][C]InterpolationForecast[/C][C]ResidualsPrediction Error[/C][/ROW]
[ROW][C]1[/C][C]95.1[/C][C]99.2845801559503[/C][C]-4.18458015595026[/C][/ROW]
[ROW][C]2[/C][C]97[/C][C]98.450648402293[/C][C]-1.45064840229292[/C][/ROW]
[ROW][C]3[/C][C]112.7[/C][C]111.314076491578[/C][C]1.38592350842182[/C][/ROW]
[ROW][C]4[/C][C]102.9[/C][C]103.701246565649[/C][C]-0.801246565648725[/C][/ROW]
[ROW][C]5[/C][C]97.4[/C][C]101.649821500338[/C][C]-4.24982150033771[/C][/ROW]
[ROW][C]6[/C][C]111.4[/C][C]111.836420537784[/C][C]-0.436420537783846[/C][/ROW]
[ROW][C]7[/C][C]87.4[/C][C]87.847631251633[/C][C]-0.447631251633005[/C][/ROW]
[ROW][C]8[/C][C]96.8[/C][C]96.0965031792716[/C][C]0.703496820728446[/C][/ROW]
[ROW][C]9[/C][C]114.1[/C][C]113.992236952738[/C][C]0.107763047262040[/C][/ROW]
[ROW][C]10[/C][C]110.3[/C][C]114.166530162489[/C][C]-3.86653016248863[/C][/ROW]
[ROW][C]11[/C][C]103.9[/C][C]107.831400337612[/C][C]-3.93140033761166[/C][/ROW]
[ROW][C]12[/C][C]101.6[/C][C]99.6571133045328[/C][C]1.94288669546721[/C][/ROW]
[ROW][C]13[/C][C]94.6[/C][C]97.6187450209164[/C][C]-3.01874502091646[/C][/ROW]
[ROW][C]14[/C][C]95.9[/C][C]99.1078660557113[/C][C]-3.20786605571133[/C][/ROW]
[ROW][C]15[/C][C]104.7[/C][C]108.816212722111[/C][C]-4.1162127221106[/C][/ROW]
[ROW][C]16[/C][C]102.8[/C][C]100.639591564816[/C][C]2.16040843518373[/C][/ROW]
[ROW][C]17[/C][C]98.1[/C][C]99.0117373394674[/C][C]-0.911737339467426[/C][/ROW]
[ROW][C]18[/C][C]113.9[/C][C]110.08815039406[/C][C]3.81184960594011[/C][/ROW]
[ROW][C]19[/C][C]80.9[/C][C]83.1317789900673[/C][C]-2.23177899006733[/C][/ROW]
[ROW][C]20[/C][C]95.7[/C][C]93.9770326299388[/C][C]1.72296737006117[/C][/ROW]
[ROW][C]21[/C][C]113.2[/C][C]110.780986496661[/C][C]2.41901350333886[/C][/ROW]
[ROW][C]22[/C][C]105.9[/C][C]107.31843807206[/C][C]-1.41843807205991[/C][/ROW]
[ROW][C]23[/C][C]108.8[/C][C]104.895095154837[/C][C]3.90490484516264[/C][/ROW]
[ROW][C]24[/C][C]102.3[/C][C]99.5916501630016[/C][C]2.70834983699839[/C][/ROW]
[ROW][C]25[/C][C]99[/C][C]97.0269905090292[/C][C]1.97300949097075[/C][/ROW]
[ROW][C]26[/C][C]100.7[/C][C]100.166752677866[/C][C]0.533247322133904[/C][/ROW]
[ROW][C]27[/C][C]115.5[/C][C]111.199879603528[/C][C]4.30012039647155[/C][/ROW]
[ROW][C]28[/C][C]100.7[/C][C]102.543518573081[/C][C]-1.84351857308113[/C][/ROW]
[ROW][C]29[/C][C]109.9[/C][C]103.019051962990[/C][C]6.88094803701041[/C][/ROW]
[ROW][C]30[/C][C]114.6[/C][C]114.959336092519[/C][C]-0.359336092519019[/C][/ROW]
[ROW][C]31[/C][C]85.4[/C][C]84.8975869007437[/C][C]0.502413099256293[/C][/ROW]
[ROW][C]32[/C][C]100.5[/C][C]100.319280388360[/C][C]0.180719611639698[/C][/ROW]
[ROW][C]33[/C][C]114.8[/C][C]113.701451217506[/C][C]1.09854878249378[/C][/ROW]
[ROW][C]34[/C][C]116.5[/C][C]112.685689049894[/C][C]3.8143109501064[/C][/ROW]
[ROW][C]35[/C][C]112.9[/C][C]108.604188756456[/C][C]4.29581124354449[/C][/ROW]
[ROW][C]36[/C][C]102[/C][C]101.325049733381[/C][C]0.67495026661899[/C][/ROW]
[ROW][C]37[/C][C]106[/C][C]103.798870516709[/C][C]2.20112948329057[/C][/ROW]
[ROW][C]38[/C][C]105.3[/C][C]105.309408478438[/C][C]-0.00940847843775233[/C][/ROW]
[ROW][C]39[/C][C]118.8[/C][C]114.736829417739[/C][C]4.06317058226074[/C][/ROW]
[ROW][C]40[/C][C]106.1[/C][C]107.801017722640[/C][C]-1.70101772263975[/C][/ROW]
[ROW][C]41[/C][C]109.3[/C][C]106.451826413930[/C][C]2.84817358607048[/C][/ROW]
[ROW][C]42[/C][C]117.2[/C][C]116.998634443621[/C][C]0.201365556379122[/C][/ROW]
[ROW][C]43[/C][C]92.5[/C][C]88.3620422755421[/C][C]4.13795772445789[/C][/ROW]
[ROW][C]44[/C][C]104.2[/C][C]101.905913213748[/C][C]2.29408678625189[/C][/ROW]
[ROW][C]45[/C][C]112.5[/C][C]115.534096147090[/C][C]-3.03409614708951[/C][/ROW]
[ROW][C]46[/C][C]122.4[/C][C]118.722522971885[/C][C]3.67747702811506[/C][/ROW]
[ROW][C]47[/C][C]113.3[/C][C]110.540039160725[/C][C]2.75996083927499[/C][/ROW]
[ROW][C]48[/C][C]100[/C][C]100.220015602814[/C][C]-0.220015602814265[/C][/ROW]
[ROW][C]49[/C][C]110.7[/C][C]107.670813797395[/C][C]3.02918620260541[/C][/ROW]
[ROW][C]50[/C][C]112.8[/C][C]108.665324385692[/C][C]4.13467561430809[/C][/ROW]
[ROW][C]51[/C][C]109.8[/C][C]115.433001765044[/C][C]-5.63300176504351[/C][/ROW]
[ROW][C]52[/C][C]117.3[/C][C]115.114625573814[/C][C]2.18537442618588[/C][/ROW]
[ROW][C]53[/C][C]109.1[/C][C]113.667562783276[/C][C]-4.56756278327575[/C][/ROW]
[ROW][C]54[/C][C]115.9[/C][C]119.117458532016[/C][C]-3.21745853201637[/C][/ROW]
[ROW][C]55[/C][C]96[/C][C]97.9609605820139[/C][C]-1.96096058201385[/C][/ROW]
[ROW][C]56[/C][C]99.8[/C][C]104.701270588681[/C][C]-4.9012705886812[/C][/ROW]
[ROW][C]57[/C][C]116.8[/C][C]117.391229186005[/C][C]-0.59122918600517[/C][/ROW]
[ROW][C]58[/C][C]115.7[/C][C]117.906819743673[/C][C]-2.20681974367292[/C][/ROW]
[ROW][C]59[/C][C]99.4[/C][C]106.429276590370[/C][C]-7.02927659037046[/C][/ROW]
[ROW][C]60[/C][C]94.3[/C][C]99.4061711962703[/C][C]-5.10617119627032[/C][/ROW]
[/TABLE]
Source: https://freestatistics.org/blog/index.php?pk=58454&T=4

Globally Unique Identifier (entire table): ba.freestatistics.org/blog/index.php?pk=58454&T=4

As an alternative you can also use a QR Code:  

The GUIDs for individual cells are displayed in the table below:

Multiple Linear Regression - Actuals, Interpolation, and Residuals
Time or IndexActualsInterpolationForecastResidualsPrediction Error
195.199.2845801559503-4.18458015595026
29798.450648402293-1.45064840229292
3112.7111.3140764915781.38592350842182
4102.9103.701246565649-0.801246565648725
597.4101.649821500338-4.24982150033771
6111.4111.836420537784-0.436420537783846
787.487.847631251633-0.447631251633005
896.896.09650317927160.703496820728446
9114.1113.9922369527380.107763047262040
10110.3114.166530162489-3.86653016248863
11103.9107.831400337612-3.93140033761166
12101.699.65711330453281.94288669546721
1394.697.6187450209164-3.01874502091646
1495.999.1078660557113-3.20786605571133
15104.7108.816212722111-4.1162127221106
16102.8100.6395915648162.16040843518373
1798.199.0117373394674-0.911737339467426
18113.9110.088150394063.81184960594011
1980.983.1317789900673-2.23177899006733
2095.793.97703262993881.72296737006117
21113.2110.7809864966612.41901350333886
22105.9107.31843807206-1.41843807205991
23108.8104.8950951548373.90490484516264
24102.399.59165016300162.70834983699839
259997.02699050902921.97300949097075
26100.7100.1667526778660.533247322133904
27115.5111.1998796035284.30012039647155
28100.7102.543518573081-1.84351857308113
29109.9103.0190519629906.88094803701041
30114.6114.959336092519-0.359336092519019
3185.484.89758690074370.502413099256293
32100.5100.3192803883600.180719611639698
33114.8113.7014512175061.09854878249378
34116.5112.6856890498943.8143109501064
35112.9108.6041887564564.29581124354449
36102101.3250497333810.67495026661899
37106103.7988705167092.20112948329057
38105.3105.309408478438-0.00940847843775233
39118.8114.7368294177394.06317058226074
40106.1107.801017722640-1.70101772263975
41109.3106.4518264139302.84817358607048
42117.2116.9986344436210.201365556379122
4392.588.36204227554214.13795772445789
44104.2101.9059132137482.29408678625189
45112.5115.534096147090-3.03409614708951
46122.4118.7225229718853.67747702811506
47113.3110.5400391607252.75996083927499
48100100.220015602814-0.220015602814265
49110.7107.6708137973953.02918620260541
50112.8108.6653243856924.13467561430809
51109.8115.433001765044-5.63300176504351
52117.3115.1146255738142.18537442618588
53109.1113.667562783276-4.56756278327575
54115.9119.117458532016-3.21745853201637
559697.9609605820139-1.96096058201385
5699.8104.701270588681-4.9012705886812
57116.8117.391229186005-0.59122918600517
58115.7117.906819743673-2.20681974367292
5999.4106.429276590370-7.02927659037046
6094.399.4061711962703-5.10617119627032


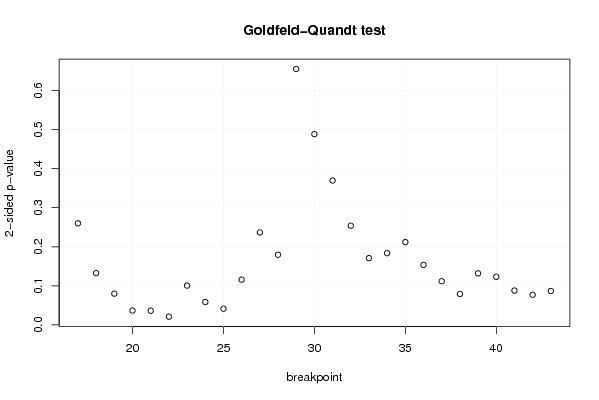
Goldfeld-Quandt test for Heteroskedasticity
p-valuesAlternative Hypothesis
breakpoint indexgreater2-sidedless
170.1300103852819920.2600207705639840.869989614718008
180.06620626317482490.1324125263496500.933793736825175
190.04006643673856880.08013287347713770.959933563261431
200.01842166359024070.03684332718048130.98157833640976
210.01817393337808180.03634786675616370.981826066621918
220.01058148294987010.02116296589974010.98941851705013
230.05032610078225260.1006522015645050.949673899217747
240.02926803093173470.05853606186346930.970731969068265
250.02070023413565360.04140046827130710.979299765864346
260.05787739950509150.1157547990101830.942122600494908
270.1183182011886940.2366364023773880.881681798811306
280.0897604346856790.1795208693713580.910239565314321
290.3275383635987080.6550767271974170.672461636401292
300.2441001126501810.4882002253003630.755899887349819
310.1848096460266050.3696192920532110.815190353973394
320.1269366787511840.2538733575023690.873063321248816
330.0854757664738330.1709515329476660.914524233526167
340.09177751828326060.1835550365665210.90822248171674
350.1059346487331680.2118692974663370.894065351266832
360.07676988890346320.1535397778069260.923230111096537
370.05589663126727820.1117932625345560.944103368732722
380.03961512267375040.07923024534750090.96038487732625
390.065980405661080.131960811322160.93401959433892
400.06156396559851890.1231279311970380.938436034401481
410.04394704067399210.08789408134798420.956052959326008
420.03856003472538640.07712006945077290.961439965274614
430.0433524624168660.0867049248337320.956647537583134

\begin{tabular}{lllllllll}
\hline
Goldfeld-Quandt test for Heteroskedasticity \tabularnewline
p-values & Alternative Hypothesis \tabularnewline
breakpoint index & greater & 2-sided & less \tabularnewline
17 & 0.130010385281992 & 0.260020770563984 & 0.869989614718008 \tabularnewline
18 & 0.0662062631748249 & 0.132412526349650 & 0.933793736825175 \tabularnewline
19 & 0.0400664367385688 & 0.0801328734771377 & 0.959933563261431 \tabularnewline
20 & 0.0184216635902407 & 0.0368433271804813 & 0.98157833640976 \tabularnewline
21 & 0.0181739333780818 & 0.0363478667561637 & 0.981826066621918 \tabularnewline
22 & 0.0105814829498701 & 0.0211629658997401 & 0.98941851705013 \tabularnewline
23 & 0.0503261007822526 & 0.100652201564505 & 0.949673899217747 \tabularnewline
24 & 0.0292680309317347 & 0.0585360618634693 & 0.970731969068265 \tabularnewline
25 & 0.0207002341356536 & 0.0414004682713071 & 0.979299765864346 \tabularnewline
26 & 0.0578773995050915 & 0.115754799010183 & 0.942122600494908 \tabularnewline
27 & 0.118318201188694 & 0.236636402377388 & 0.881681798811306 \tabularnewline
28 & 0.089760434685679 & 0.179520869371358 & 0.910239565314321 \tabularnewline
29 & 0.327538363598708 & 0.655076727197417 & 0.672461636401292 \tabularnewline
30 & 0.244100112650181 & 0.488200225300363 & 0.755899887349819 \tabularnewline
31 & 0.184809646026605 & 0.369619292053211 & 0.815190353973394 \tabularnewline
32 & 0.126936678751184 & 0.253873357502369 & 0.873063321248816 \tabularnewline
33 & 0.085475766473833 & 0.170951532947666 & 0.914524233526167 \tabularnewline
34 & 0.0917775182832606 & 0.183555036566521 & 0.90822248171674 \tabularnewline
35 & 0.105934648733168 & 0.211869297466337 & 0.894065351266832 \tabularnewline
36 & 0.0767698889034632 & 0.153539777806926 & 0.923230111096537 \tabularnewline
37 & 0.0558966312672782 & 0.111793262534556 & 0.944103368732722 \tabularnewline
38 & 0.0396151226737504 & 0.0792302453475009 & 0.96038487732625 \tabularnewline
39 & 0.06598040566108 & 0.13196081132216 & 0.93401959433892 \tabularnewline
40 & 0.0615639655985189 & 0.123127931197038 & 0.938436034401481 \tabularnewline
41 & 0.0439470406739921 & 0.0878940813479842 & 0.956052959326008 \tabularnewline
42 & 0.0385600347253864 & 0.0771200694507729 & 0.961439965274614 \tabularnewline
43 & 0.043352462416866 & 0.086704924833732 & 0.956647537583134 \tabularnewline
\hline
\end{tabular}
%Source: https://freestatistics.org/blog/index.php?pk=58454&T=5

[TABLE]
[ROW][C]Goldfeld-Quandt test for Heteroskedasticity[/C][/ROW]
[ROW][C]p-values[/C][C]Alternative Hypothesis[/C][/ROW]
[ROW][C]breakpoint index[/C][C]greater[/C][C]2-sided[/C][C]less[/C][/ROW]
[ROW][C]17[/C][C]0.130010385281992[/C][C]0.260020770563984[/C][C]0.869989614718008[/C][/ROW]
[ROW][C]18[/C][C]0.0662062631748249[/C][C]0.132412526349650[/C][C]0.933793736825175[/C][/ROW]
[ROW][C]19[/C][C]0.0400664367385688[/C][C]0.0801328734771377[/C][C]0.959933563261431[/C][/ROW]
[ROW][C]20[/C][C]0.0184216635902407[/C][C]0.0368433271804813[/C][C]0.98157833640976[/C][/ROW]
[ROW][C]21[/C][C]0.0181739333780818[/C][C]0.0363478667561637[/C][C]0.981826066621918[/C][/ROW]
[ROW][C]22[/C][C]0.0105814829498701[/C][C]0.0211629658997401[/C][C]0.98941851705013[/C][/ROW]
[ROW][C]23[/C][C]0.0503261007822526[/C][C]0.100652201564505[/C][C]0.949673899217747[/C][/ROW]
[ROW][C]24[/C][C]0.0292680309317347[/C][C]0.0585360618634693[/C][C]0.970731969068265[/C][/ROW]
[ROW][C]25[/C][C]0.0207002341356536[/C][C]0.0414004682713071[/C][C]0.979299765864346[/C][/ROW]
[ROW][C]26[/C][C]0.0578773995050915[/C][C]0.115754799010183[/C][C]0.942122600494908[/C][/ROW]
[ROW][C]27[/C][C]0.118318201188694[/C][C]0.236636402377388[/C][C]0.881681798811306[/C][/ROW]
[ROW][C]28[/C][C]0.089760434685679[/C][C]0.179520869371358[/C][C]0.910239565314321[/C][/ROW]
[ROW][C]29[/C][C]0.327538363598708[/C][C]0.655076727197417[/C][C]0.672461636401292[/C][/ROW]
[ROW][C]30[/C][C]0.244100112650181[/C][C]0.488200225300363[/C][C]0.755899887349819[/C][/ROW]
[ROW][C]31[/C][C]0.184809646026605[/C][C]0.369619292053211[/C][C]0.815190353973394[/C][/ROW]
[ROW][C]32[/C][C]0.126936678751184[/C][C]0.253873357502369[/C][C]0.873063321248816[/C][/ROW]
[ROW][C]33[/C][C]0.085475766473833[/C][C]0.170951532947666[/C][C]0.914524233526167[/C][/ROW]
[ROW][C]34[/C][C]0.0917775182832606[/C][C]0.183555036566521[/C][C]0.90822248171674[/C][/ROW]
[ROW][C]35[/C][C]0.105934648733168[/C][C]0.211869297466337[/C][C]0.894065351266832[/C][/ROW]
[ROW][C]36[/C][C]0.0767698889034632[/C][C]0.153539777806926[/C][C]0.923230111096537[/C][/ROW]
[ROW][C]37[/C][C]0.0558966312672782[/C][C]0.111793262534556[/C][C]0.944103368732722[/C][/ROW]
[ROW][C]38[/C][C]0.0396151226737504[/C][C]0.0792302453475009[/C][C]0.96038487732625[/C][/ROW]
[ROW][C]39[/C][C]0.06598040566108[/C][C]0.13196081132216[/C][C]0.93401959433892[/C][/ROW]
[ROW][C]40[/C][C]0.0615639655985189[/C][C]0.123127931197038[/C][C]0.938436034401481[/C][/ROW]
[ROW][C]41[/C][C]0.0439470406739921[/C][C]0.0878940813479842[/C][C]0.956052959326008[/C][/ROW]
[ROW][C]42[/C][C]0.0385600347253864[/C][C]0.0771200694507729[/C][C]0.961439965274614[/C][/ROW]
[ROW][C]43[/C][C]0.043352462416866[/C][C]0.086704924833732[/C][C]0.956647537583134[/C][/ROW]
[/TABLE]
Source: https://freestatistics.org/blog/index.php?pk=58454&T=5

Globally Unique Identifier (entire table): ba.freestatistics.org/blog/index.php?pk=58454&T=5

As an alternative you can also use a QR Code:  

The GUIDs for individual cells are displayed in the table below:

Goldfeld-Quandt test for Heteroskedasticity
p-valuesAlternative Hypothesis
breakpoint indexgreater2-sidedless
170.1300103852819920.2600207705639840.869989614718008
180.06620626317482490.1324125263496500.933793736825175
190.04006643673856880.08013287347713770.959933563261431
200.01842166359024070.03684332718048130.98157833640976
210.01817393337808180.03634786675616370.981826066621918
220.01058148294987010.02116296589974010.98941851705013
230.05032610078225260.1006522015645050.949673899217747
240.02926803093173470.05853606186346930.970731969068265
250.02070023413565360.04140046827130710.979299765864346
260.05787739950509150.1157547990101830.942122600494908
270.1183182011886940.2366364023773880.881681798811306
280.0897604346856790.1795208693713580.910239565314321
290.3275383635987080.6550767271974170.672461636401292
300.2441001126501810.4882002253003630.755899887349819
310.1848096460266050.3696192920532110.815190353973394
320.1269366787511840.2538733575023690.873063321248816
330.0854757664738330.1709515329476660.914524233526167
340.09177751828326060.1835550365665210.90822248171674
350.1059346487331680.2118692974663370.894065351266832
360.07676988890346320.1535397778069260.923230111096537
370.05589663126727820.1117932625345560.944103368732722
380.03961512267375040.07923024534750090.96038487732625
390.065980405661080.131960811322160.93401959433892
400.06156396559851890.1231279311970380.938436034401481
410.04394704067399210.08789408134798420.956052959326008
420.03856003472538640.07712006945077290.961439965274614
430.0433524624168660.0867049248337320.956647537583134


Meta Analysis of Goldfeld-Quandt test for Heteroskedasticity
Description# significant tests% significant testsOK/NOK
1% type I error level00OK
5% type I error level40.148148148148148NOK
10% type I error level100.370370370370370NOK

\begin{tabular}{lllllllll}
\hline
Meta Analysis of Goldfeld-Quandt test for Heteroskedasticity \tabularnewline
Description & # significant tests & % significant tests & OK/NOK \tabularnewline
1% type I error level & 0 & 0 & OK \tabularnewline
5% type I error level & 4 & 0.148148148148148 & NOK \tabularnewline
10% type I error level & 10 & 0.370370370370370 & NOK \tabularnewline
\hline
\end{tabular}
%Source: https://freestatistics.org/blog/index.php?pk=58454&T=6

[TABLE]
[ROW][C]Meta Analysis of Goldfeld-Quandt test for Heteroskedasticity[/C][/ROW]
[ROW][C]Description[/C][C]# significant tests[/C][C]% significant tests[/C][C]OK/NOK[/C][/ROW]
[ROW][C]1% type I error level[/C][C]0[/C][C]0[/C][C]OK[/C][/ROW]
[ROW][C]5% type I error level[/C][C]4[/C][C]0.148148148148148[/C][C]NOK[/C][/ROW]
[ROW][C]10% type I error level[/C][C]10[/C][C]0.370370370370370[/C][C]NOK[/C][/ROW]
[/TABLE]
Source: https://freestatistics.org/blog/index.php?pk=58454&T=6

Globally Unique Identifier (entire table): ba.freestatistics.org/blog/index.php?pk=58454&T=6

As an alternative you can also use a QR Code:  

The GUIDs for individual cells are displayed in the table below:

Meta Analysis of Goldfeld-Quandt test for Heteroskedasticity
Description# significant tests% significant testsOK/NOK
1% type I error level00OK
5% type I error level40.148148148148148NOK
10% type I error level100.370370370370370NOK


Parameters (Session):
par1 = 1 ; par2 = Include Monthly Dummies ; par3 = No Linear Trend ;
Parameters (R input):
par1 = 1 ; par2 = Include Monthly Dummies ; par3 = No Linear Trend ;
R code (references can be found in the software module):
library(lattice)
library(lmtest)
n25 <- 25 #minimum number of obs. for Goldfeld-Quandt test
par1 <- as.numeric(par1)
x <- t(y)
k <- length(x[1,])
n <- length(x[,1])
x1 <- cbind(x[,par1], x[,1:k!=par1])
mycolnames <- c(colnames(x)[par1], colnames(x)[1:k!=par1])
colnames(x1) <- mycolnames #colnames(x)[par1]
x <- x1
if (par3 == 'First Differences'){
x2 <- array(0, dim=c(n-1,k), dimnames=list(1:(n-1), paste('(1-B)',colnames(x),sep='')))
for (i in 1:n-1) {
for (j in 1:k) {
x2[i,j] <- x[i+1,j] - x[i,j]
}
}
x <- x2
}
if (par2 == 'Include Monthly Dummies'){
x2 <- array(0, dim=c(n,11), dimnames=list(1:n, paste('M', seq(1:11), sep ='')))
for (i in 1:11){
x2[seq(i,n,12),i] <- 1
}
x <- cbind(x, x2)
}
if (par2 == 'Include Quarterly Dummies'){
x2 <- array(0, dim=c(n,3), dimnames=list(1:n, paste('Q', seq(1:3), sep ='')))
for (i in 1:3){
x2[seq(i,n,4),i] <- 1
}
x <- cbind(x, x2)
}
k <- length(x[1,])
if (par3 == 'Linear Trend'){
x <- cbind(x, c(1:n))
colnames(x)[k+1] <- 't'
}
x
k <- length(x[1,])
df <- as.data.frame(x)
(mylm <- lm(df))
(mysum <- summary(mylm))
if (n > n25) {
kp3 <- k + 3
nmkm3 <- n - k - 3
gqarr <- array(NA, dim=c(nmkm3-kp3+1,3))
numgqtests <- 0
numsignificant1 <- 0
numsignificant5 <- 0
numsignificant10 <- 0
for (mypoint in kp3:nmkm3) {
j <- 0
numgqtests <- numgqtests + 1
for (myalt in c('greater', 'two.sided', 'less')) {
j <- j + 1
gqarr[mypoint-kp3+1,j] <- gqtest(mylm, point=mypoint, alternative=myalt)$p.value
}
if (gqarr[mypoint-kp3+1,2] < 0.01) numsignificant1 <- numsignificant1 + 1
if (gqarr[mypoint-kp3+1,2] < 0.05) numsignificant5 <- numsignificant5 + 1
if (gqarr[mypoint-kp3+1,2] < 0.10) numsignificant10 <- numsignificant10 + 1
}
gqarr
}
bitmap(file='test0.png')
plot(x[,1], type='l', main='Actuals and Interpolation', ylab='value of Actuals and Interpolation (dots)', xlab='time or index')
points(x[,1]-mysum$resid)
grid()
dev.off()
bitmap(file='test1.png')
plot(mysum$resid, type='b', pch=19, main='Residuals', ylab='value of Residuals', xlab='time or index')
grid()
dev.off()
bitmap(file='test2.png')
hist(mysum$resid, main='Residual Histogram', xlab='values of Residuals')
grid()
dev.off()
bitmap(file='test3.png')
densityplot(~mysum$resid,col='black',main='Residual Density Plot', xlab='values of Residuals')
dev.off()
bitmap(file='test4.png')
qqnorm(mysum$resid, main='Residual Normal Q-Q Plot')
qqline(mysum$resid)
grid()
dev.off()
(myerror <- as.ts(mysum$resid))
bitmap(file='test5.png')
dum <- cbind(lag(myerror,k=1),myerror)
dum
dum1 <- dum[2:length(myerror),]
dum1
z <- as.data.frame(dum1)
z
plot(z,main=paste('Residual Lag plot, lowess, and regression line'), ylab='values of Residuals', xlab='lagged values of Residuals')
lines(lowess(z))
abline(lm(z))
grid()
dev.off()
bitmap(file='test6.png')
acf(mysum$resid, lag.max=length(mysum$resid)/2, main='Residual Autocorrelation Function')
grid()
dev.off()
bitmap(file='test7.png')
pacf(mysum$resid, lag.max=length(mysum$resid)/2, main='Residual Partial Autocorrelation Function')
grid()
dev.off()
bitmap(file='test8.png')
opar <- par(mfrow = c(2,2), oma = c(0, 0, 1.1, 0))
plot(mylm, las = 1, sub='Residual Diagnostics')
par(opar)
dev.off()
if (n > n25) {
bitmap(file='test9.png')
plot(kp3:nmkm3,gqarr[,2], main='Goldfeld-Quandt test',ylab='2-sided p-value',xlab='breakpoint')
grid()
dev.off()
}
load(file='createtable')
a<-table.start()
a<-table.row.start(a)
a<-table.element(a, 'Multiple Linear Regression - Estimated Regression Equation', 1, TRUE)
a<-table.row.end(a)
myeq <- colnames(x)[1]
myeq <- paste(myeq, '[t] = ', sep='')
for (i in 1:k){
if (mysum$coefficients[i,1] > 0) myeq <- paste(myeq, '+', '')
myeq <- paste(myeq, mysum$coefficients[i,1], sep=' ')
if (rownames(mysum$coefficients)[i] != '(Intercept)') {
myeq <- paste(myeq, rownames(mysum$coefficients)[i], sep='')
if (rownames(mysum$coefficients)[i] != 't') myeq <- paste(myeq, '[t]', sep='')
}
}
myeq <- paste(myeq, ' + e[t]')
a<-table.row.start(a)
a<-table.element(a, myeq)
a<-table.row.end(a)
a<-table.end(a)
table.save(a,file='mytable1.tab')
a<-table.start()
a<-table.row.start(a)
a<-table.element(a,hyperlink('ols1.htm','Multiple Linear Regression - Ordinary Least Squares',''), 6, TRUE)
a<-table.row.end(a)
a<-table.row.start(a)
a<-table.element(a,'Variable',header=TRUE)
a<-table.element(a,'Parameter',header=TRUE)
a<-table.element(a,'S.D.',header=TRUE)
a<-table.element(a,'T-STAT
H0: parameter = 0',header=TRUE)
a<-table.element(a,'2-tail p-value',header=TRUE)
a<-table.element(a,'1-tail p-value',header=TRUE)
a<-table.row.end(a)
for (i in 1:k){
a<-table.row.start(a)
a<-table.element(a,rownames(mysum$coefficients)[i],header=TRUE)
a<-table.element(a,mysum$coefficients[i,1])
a<-table.element(a, round(mysum$coefficients[i,2],6))
a<-table.element(a, round(mysum$coefficients[i,3],4))
a<-table.element(a, round(mysum$coefficients[i,4],6))
a<-table.element(a, round(mysum$coefficients[i,4]/2,6))
a<-table.row.end(a)
}
a<-table.end(a)
table.save(a,file='mytable2.tab')
a<-table.start()
a<-table.row.start(a)
a<-table.element(a, 'Multiple Linear Regression - Regression Statistics', 2, TRUE)
a<-table.row.end(a)
a<-table.row.start(a)
a<-table.element(a, 'Multiple R',1,TRUE)
a<-table.element(a, sqrt(mysum$r.squared))
a<-table.row.end(a)
a<-table.row.start(a)
a<-table.element(a, 'R-squared',1,TRUE)
a<-table.element(a, mysum$r.squared)
a<-table.row.end(a)
a<-table.row.start(a)
a<-table.element(a, 'Adjusted R-squared',1,TRUE)
a<-table.element(a, mysum$adj.r.squared)
a<-table.row.end(a)
a<-table.row.start(a)
a<-table.element(a, 'F-TEST (value)',1,TRUE)
a<-table.element(a, mysum$fstatistic[1])
a<-table.row.end(a)
a<-table.row.start(a)
a<-table.element(a, 'F-TEST (DF numerator)',1,TRUE)
a<-table.element(a, mysum$fstatistic[2])
a<-table.row.end(a)
a<-table.row.start(a)
a<-table.element(a, 'F-TEST (DF denominator)',1,TRUE)
a<-table.element(a, mysum$fstatistic[3])
a<-table.row.end(a)
a<-table.row.start(a)
a<-table.element(a, 'p-value',1,TRUE)
a<-table.element(a, 1-pf(mysum$fstatistic[1],mysum$fstatistic[2],mysum$fstatistic[3]))
a<-table.row.end(a)
a<-table.row.start(a)
a<-table.element(a, 'Multiple Linear Regression - Residual Statistics', 2, TRUE)
a<-table.row.end(a)
a<-table.row.start(a)
a<-table.element(a, 'Residual Standard Deviation',1,TRUE)
a<-table.element(a, mysum$sigma)
a<-table.row.end(a)
a<-table.row.start(a)
a<-table.element(a, 'Sum Squared Residuals',1,TRUE)
a<-table.element(a, sum(myerror*myerror))
a<-table.row.end(a)
a<-table.end(a)
table.save(a,file='mytable3.tab')
a<-table.start()
a<-table.row.start(a)
a<-table.element(a, 'Multiple Linear Regression - Actuals, Interpolation, and Residuals', 4, TRUE)
a<-table.row.end(a)
a<-table.row.start(a)
a<-table.element(a, 'Time or Index', 1, TRUE)
a<-table.element(a, 'Actuals', 1, TRUE)
a<-table.element(a, 'Interpolation
Forecast', 1, TRUE)
a<-table.element(a, 'Residuals
Prediction Error', 1, TRUE)
a<-table.row.end(a)
for (i in 1:n) {
a<-table.row.start(a)
a<-table.element(a,i, 1, TRUE)
a<-table.element(a,x[i])
a<-table.element(a,x[i]-mysum$resid[i])
a<-table.element(a,mysum$resid[i])
a<-table.row.end(a)
}
a<-table.end(a)
table.save(a,file='mytable4.tab')
if (n > n25) {
a<-table.start()
a<-table.row.start(a)
a<-table.element(a,'Goldfeld-Quandt test for Heteroskedasticity',4,TRUE)
a<-table.row.end(a)
a<-table.row.start(a)
a<-table.element(a,'p-values',header=TRUE)
a<-table.element(a,'Alternative Hypothesis',3,header=TRUE)
a<-table.row.end(a)
a<-table.row.start(a)
a<-table.element(a,'breakpoint index',header=TRUE)
a<-table.element(a,'greater',header=TRUE)
a<-table.element(a,'2-sided',header=TRUE)
a<-table.element(a,'less',header=TRUE)
a<-table.row.end(a)
for (mypoint in kp3:nmkm3) {
a<-table.row.start(a)
a<-table.element(a,mypoint,header=TRUE)
a<-table.element(a,gqarr[mypoint-kp3+1,1])
a<-table.element(a,gqarr[mypoint-kp3+1,2])
a<-table.element(a,gqarr[mypoint-kp3+1,3])
a<-table.row.end(a)
}
a<-table.end(a)
table.save(a,file='mytable5.tab')
a<-table.start()
a<-table.row.start(a)
a<-table.element(a,'Meta Analysis of Goldfeld-Quandt test for Heteroskedasticity',4,TRUE)
a<-table.row.end(a)
a<-table.row.start(a)
a<-table.element(a,'Description',header=TRUE)
a<-table.element(a,'# significant tests',header=TRUE)
a<-table.element(a,'% significant tests',header=TRUE)
a<-table.element(a,'OK/NOK',header=TRUE)
a<-table.row.end(a)
a<-table.row.start(a)
a<-table.element(a,'1% type I error level',header=TRUE)
a<-table.element(a,numsignificant1)
a<-table.element(a,numsignificant1/numgqtests)
if (numsignificant1/numgqtests < 0.01) dum <- 'OK' else dum <- 'NOK'
a<-table.element(a,dum)
a<-table.row.end(a)
a<-table.row.start(a)
a<-table.element(a,'5% type I error level',header=TRUE)
a<-table.element(a,numsignificant5)
a<-table.element(a,numsignificant5/numgqtests)
if (numsignificant5/numgqtests < 0.05) dum <- 'OK' else dum <- 'NOK'
a<-table.element(a,dum)
a<-table.row.end(a)
a<-table.row.start(a)
a<-table.element(a,'10% type I error level',header=TRUE)
a<-table.element(a,numsignificant10)
a<-table.element(a,numsignificant10/numgqtests)
if (numsignificant10/numgqtests < 0.1) dum <- 'OK' else dum <- 'NOK'
a<-table.element(a,dum)
a<-table.row.end(a)
a<-table.end(a)
table.save(a,file='mytable6.tab')
}