Free Statistics

of Irreproducible Research!

Author's title

Author*Unverified author*
R Software Modulerwasp_autocorrelation.wasp
Title produced by software(Partial) Autocorrelation Function
Date of computationMon, 25 Jan 2010 05:45:51 -0700
Cite this page as followsStatistical Computations at FreeStatistics.org, Office for Research Development and Education, URL https://freestatistics.org/blog/index.php?v=date/2010/Jan/25/t1264423621avm8raqryap4iny.htm/, Retrieved Thu, 31 Oct 2024 22:59:28 +0000
Statistical Computations at FreeStatistics.org, Office for Research Development and Education, URL https://freestatistics.org/blog/index.php?pk=72437, Retrieved Thu, 31 Oct 2024 22:59:28 +0000
QR Codes:

Original text written by user:
IsPrivate?No (this computation is public)
User-defined keywordsKDGP2W22
Estimated Impact171
Family? (F = Feedback message, R = changed R code, M = changed R Module, P = changed Parameters, D = changed Data)
-       [(Partial) Autocorrelation Function] [Opgave 6 Bis oefe...] [2010-01-25 12:45:51] [2c3906e099e396db093769aeca236bf5] [Current]
Feedback Forum

Post a new message
Dataseries X:
24.3
29.4
31.8
36.7
37.1
37.7
39.4
43.3
39.6
34.3
32
29.6
22.3
28.9
31.7
34.2
38.6
37.2
38.8
43.4
38.8
36.3
33
29.2
22.64
28.44
30.14
34.39
36.82
36.74
38.9
42.8
39.09
37.49
33.17
30.98
21.2
27.8
29
35.4
37.5
34.7
38.4
39.9
35.9
34.7
30.4
29
21.5
28
29.3
34.3
36.6
36.2
37.5
41.6
39.4
37.3
32.7
30.7
22.9
29.1
29.5
37.1
37.7
38.4
39.4
40.6
39.7
36.6
32.8
31.6
24.1
30.3
31.8
38.7
37.8
38.4
40.7
43.8
41.5
39.3
35.9
33.4


Summary of computational transaction
Raw Inputview raw input (R code)
Raw Outputview raw output of R engine
Computing time1 seconds
R Server'Gwilym Jenkins' @ 72.249.127.135

\begin{tabular}{lllllllll}
\hline
Summary of computational transaction \tabularnewline
Raw Input & view raw input (R code)  \tabularnewline
Raw Output & view raw output of R engine  \tabularnewline
Computing time & 1 seconds \tabularnewline
R Server & 'Gwilym Jenkins' @ 72.249.127.135 \tabularnewline
\hline
\end{tabular}
%Source: https://freestatistics.org/blog/index.php?pk=72437&T=0

[TABLE]
[ROW][C]Summary of computational transaction[/C][/ROW]
[ROW][C]Raw Input[/C][C]view raw input (R code) [/C][/ROW]
[ROW][C]Raw Output[/C][C]view raw output of R engine [/C][/ROW]
[ROW][C]Computing time[/C][C]1 seconds[/C][/ROW]
[ROW][C]R Server[/C][C]'Gwilym Jenkins' @ 72.249.127.135[/C][/ROW]
[/TABLE]
Source: https://freestatistics.org/blog/index.php?pk=72437&T=0

Globally Unique Identifier (entire table): ba.freestatistics.org/blog/index.php?pk=72437&T=0

As an alternative you can also use a QR Code:  

The GUIDs for individual cells are displayed in the table below:

Summary of computational transaction
Raw Inputview raw input (R code)
Raw Outputview raw output of R engine
Computing time1 seconds
R Server'Gwilym Jenkins' @ 72.249.127.135


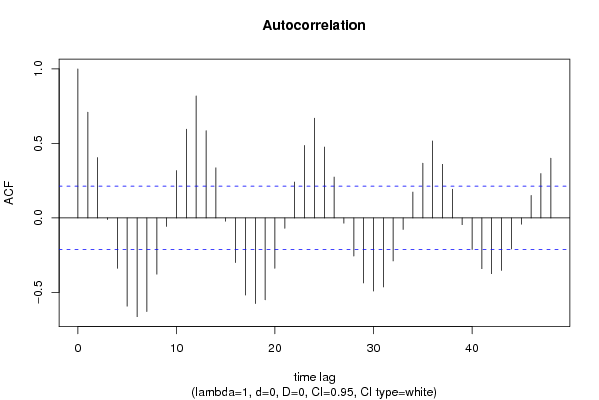
Autocorrelation Function
Time lag kACF(k)T-STATP-value
10.7100336.50760
20.4051983.71370.000183
3-0.011264-0.10320.459011
4-0.338724-3.10450.001299
5-0.592951-5.43450
6-0.663109-6.07750
7-0.628773-5.76280
8-0.377797-3.46260.000422
9-0.057725-0.52910.29908
100.3180152.91470.002282
110.5952285.45540
120.8185447.50210
130.5855495.36660
140.3362263.08160.001392
15-0.021991-0.20160.420376
16-0.299672-2.74650.003684
17-0.518078-4.74834e-06
18-0.575033-5.27031e-06
19-0.550093-5.04171e-06
20-0.338402-3.10150.001311
21-0.070329-0.64460.260479
220.2403552.20290.01517
230.4861254.45541.3e-05
240.669286.13410
250.4757064.35991.8e-05
260.2744632.51550.006895
27-0.035381-0.32430.373269
28-0.256208-2.34820.010608
29-0.437087-4.0066.6e-05
30-0.490975-4.49991.1e-05
31-0.46394-4.25212.7e-05
32-0.288897-2.64780.004837
33-0.077639-0.71160.23935
340.1734091.58930.057873
350.3673483.36680.000575
360.5168534.7374e-06
370.3600973.30030.000709
380.1923721.76310.040759
39-0.045625-0.41820.338449
40-0.211713-1.94040.027844
41-0.340789-3.12340.001227
42-0.375085-3.43770.000457
43-0.353256-3.23760.000863
44-0.208267-1.90880.029851
45-0.04206-0.38550.350427
460.150691.38110.085456
470.2980262.73150.003842
480.401013.67530.000209

\begin{tabular}{lllllllll}
\hline
Autocorrelation Function \tabularnewline
Time lag k & ACF(k) & T-STAT & P-value \tabularnewline
1 & 0.710033 & 6.5076 & 0 \tabularnewline
2 & 0.405198 & 3.7137 & 0.000183 \tabularnewline
3 & -0.011264 & -0.1032 & 0.459011 \tabularnewline
4 & -0.338724 & -3.1045 & 0.001299 \tabularnewline
5 & -0.592951 & -5.4345 & 0 \tabularnewline
6 & -0.663109 & -6.0775 & 0 \tabularnewline
7 & -0.628773 & -5.7628 & 0 \tabularnewline
8 & -0.377797 & -3.4626 & 0.000422 \tabularnewline
9 & -0.057725 & -0.5291 & 0.29908 \tabularnewline
10 & 0.318015 & 2.9147 & 0.002282 \tabularnewline
11 & 0.595228 & 5.4554 & 0 \tabularnewline
12 & 0.818544 & 7.5021 & 0 \tabularnewline
13 & 0.585549 & 5.3666 & 0 \tabularnewline
14 & 0.336226 & 3.0816 & 0.001392 \tabularnewline
15 & -0.021991 & -0.2016 & 0.420376 \tabularnewline
16 & -0.299672 & -2.7465 & 0.003684 \tabularnewline
17 & -0.518078 & -4.7483 & 4e-06 \tabularnewline
18 & -0.575033 & -5.2703 & 1e-06 \tabularnewline
19 & -0.550093 & -5.0417 & 1e-06 \tabularnewline
20 & -0.338402 & -3.1015 & 0.001311 \tabularnewline
21 & -0.070329 & -0.6446 & 0.260479 \tabularnewline
22 & 0.240355 & 2.2029 & 0.01517 \tabularnewline
23 & 0.486125 & 4.4554 & 1.3e-05 \tabularnewline
24 & 0.66928 & 6.1341 & 0 \tabularnewline
25 & 0.475706 & 4.3599 & 1.8e-05 \tabularnewline
26 & 0.274463 & 2.5155 & 0.006895 \tabularnewline
27 & -0.035381 & -0.3243 & 0.373269 \tabularnewline
28 & -0.256208 & -2.3482 & 0.010608 \tabularnewline
29 & -0.437087 & -4.006 & 6.6e-05 \tabularnewline
30 & -0.490975 & -4.4999 & 1.1e-05 \tabularnewline
31 & -0.46394 & -4.2521 & 2.7e-05 \tabularnewline
32 & -0.288897 & -2.6478 & 0.004837 \tabularnewline
33 & -0.077639 & -0.7116 & 0.23935 \tabularnewline
34 & 0.173409 & 1.5893 & 0.057873 \tabularnewline
35 & 0.367348 & 3.3668 & 0.000575 \tabularnewline
36 & 0.516853 & 4.737 & 4e-06 \tabularnewline
37 & 0.360097 & 3.3003 & 0.000709 \tabularnewline
38 & 0.192372 & 1.7631 & 0.040759 \tabularnewline
39 & -0.045625 & -0.4182 & 0.338449 \tabularnewline
40 & -0.211713 & -1.9404 & 0.027844 \tabularnewline
41 & -0.340789 & -3.1234 & 0.001227 \tabularnewline
42 & -0.375085 & -3.4377 & 0.000457 \tabularnewline
43 & -0.353256 & -3.2376 & 0.000863 \tabularnewline
44 & -0.208267 & -1.9088 & 0.029851 \tabularnewline
45 & -0.04206 & -0.3855 & 0.350427 \tabularnewline
46 & 0.15069 & 1.3811 & 0.085456 \tabularnewline
47 & 0.298026 & 2.7315 & 0.003842 \tabularnewline
48 & 0.40101 & 3.6753 & 0.000209 \tabularnewline
\hline
\end{tabular}
%Source: https://freestatistics.org/blog/index.php?pk=72437&T=1

[TABLE]
[ROW][C]Autocorrelation Function[/C][/ROW]
[ROW][C]Time lag k[/C][C]ACF(k)[/C][C]T-STAT[/C][C]P-value[/C][/ROW]
[ROW][C]1[/C][C]0.710033[/C][C]6.5076[/C][C]0[/C][/ROW]
[ROW][C]2[/C][C]0.405198[/C][C]3.7137[/C][C]0.000183[/C][/ROW]
[ROW][C]3[/C][C]-0.011264[/C][C]-0.1032[/C][C]0.459011[/C][/ROW]
[ROW][C]4[/C][C]-0.338724[/C][C]-3.1045[/C][C]0.001299[/C][/ROW]
[ROW][C]5[/C][C]-0.592951[/C][C]-5.4345[/C][C]0[/C][/ROW]
[ROW][C]6[/C][C]-0.663109[/C][C]-6.0775[/C][C]0[/C][/ROW]
[ROW][C]7[/C][C]-0.628773[/C][C]-5.7628[/C][C]0[/C][/ROW]
[ROW][C]8[/C][C]-0.377797[/C][C]-3.4626[/C][C]0.000422[/C][/ROW]
[ROW][C]9[/C][C]-0.057725[/C][C]-0.5291[/C][C]0.29908[/C][/ROW]
[ROW][C]10[/C][C]0.318015[/C][C]2.9147[/C][C]0.002282[/C][/ROW]
[ROW][C]11[/C][C]0.595228[/C][C]5.4554[/C][C]0[/C][/ROW]
[ROW][C]12[/C][C]0.818544[/C][C]7.5021[/C][C]0[/C][/ROW]
[ROW][C]13[/C][C]0.585549[/C][C]5.3666[/C][C]0[/C][/ROW]
[ROW][C]14[/C][C]0.336226[/C][C]3.0816[/C][C]0.001392[/C][/ROW]
[ROW][C]15[/C][C]-0.021991[/C][C]-0.2016[/C][C]0.420376[/C][/ROW]
[ROW][C]16[/C][C]-0.299672[/C][C]-2.7465[/C][C]0.003684[/C][/ROW]
[ROW][C]17[/C][C]-0.518078[/C][C]-4.7483[/C][C]4e-06[/C][/ROW]
[ROW][C]18[/C][C]-0.575033[/C][C]-5.2703[/C][C]1e-06[/C][/ROW]
[ROW][C]19[/C][C]-0.550093[/C][C]-5.0417[/C][C]1e-06[/C][/ROW]
[ROW][C]20[/C][C]-0.338402[/C][C]-3.1015[/C][C]0.001311[/C][/ROW]
[ROW][C]21[/C][C]-0.070329[/C][C]-0.6446[/C][C]0.260479[/C][/ROW]
[ROW][C]22[/C][C]0.240355[/C][C]2.2029[/C][C]0.01517[/C][/ROW]
[ROW][C]23[/C][C]0.486125[/C][C]4.4554[/C][C]1.3e-05[/C][/ROW]
[ROW][C]24[/C][C]0.66928[/C][C]6.1341[/C][C]0[/C][/ROW]
[ROW][C]25[/C][C]0.475706[/C][C]4.3599[/C][C]1.8e-05[/C][/ROW]
[ROW][C]26[/C][C]0.274463[/C][C]2.5155[/C][C]0.006895[/C][/ROW]
[ROW][C]27[/C][C]-0.035381[/C][C]-0.3243[/C][C]0.373269[/C][/ROW]
[ROW][C]28[/C][C]-0.256208[/C][C]-2.3482[/C][C]0.010608[/C][/ROW]
[ROW][C]29[/C][C]-0.437087[/C][C]-4.006[/C][C]6.6e-05[/C][/ROW]
[ROW][C]30[/C][C]-0.490975[/C][C]-4.4999[/C][C]1.1e-05[/C][/ROW]
[ROW][C]31[/C][C]-0.46394[/C][C]-4.2521[/C][C]2.7e-05[/C][/ROW]
[ROW][C]32[/C][C]-0.288897[/C][C]-2.6478[/C][C]0.004837[/C][/ROW]
[ROW][C]33[/C][C]-0.077639[/C][C]-0.7116[/C][C]0.23935[/C][/ROW]
[ROW][C]34[/C][C]0.173409[/C][C]1.5893[/C][C]0.057873[/C][/ROW]
[ROW][C]35[/C][C]0.367348[/C][C]3.3668[/C][C]0.000575[/C][/ROW]
[ROW][C]36[/C][C]0.516853[/C][C]4.737[/C][C]4e-06[/C][/ROW]
[ROW][C]37[/C][C]0.360097[/C][C]3.3003[/C][C]0.000709[/C][/ROW]
[ROW][C]38[/C][C]0.192372[/C][C]1.7631[/C][C]0.040759[/C][/ROW]
[ROW][C]39[/C][C]-0.045625[/C][C]-0.4182[/C][C]0.338449[/C][/ROW]
[ROW][C]40[/C][C]-0.211713[/C][C]-1.9404[/C][C]0.027844[/C][/ROW]
[ROW][C]41[/C][C]-0.340789[/C][C]-3.1234[/C][C]0.001227[/C][/ROW]
[ROW][C]42[/C][C]-0.375085[/C][C]-3.4377[/C][C]0.000457[/C][/ROW]
[ROW][C]43[/C][C]-0.353256[/C][C]-3.2376[/C][C]0.000863[/C][/ROW]
[ROW][C]44[/C][C]-0.208267[/C][C]-1.9088[/C][C]0.029851[/C][/ROW]
[ROW][C]45[/C][C]-0.04206[/C][C]-0.3855[/C][C]0.350427[/C][/ROW]
[ROW][C]46[/C][C]0.15069[/C][C]1.3811[/C][C]0.085456[/C][/ROW]
[ROW][C]47[/C][C]0.298026[/C][C]2.7315[/C][C]0.003842[/C][/ROW]
[ROW][C]48[/C][C]0.40101[/C][C]3.6753[/C][C]0.000209[/C][/ROW]
[/TABLE]
Source: https://freestatistics.org/blog/index.php?pk=72437&T=1

Globally Unique Identifier (entire table): ba.freestatistics.org/blog/index.php?pk=72437&T=1

As an alternative you can also use a QR Code:  

The GUIDs for individual cells are displayed in the table below:

Autocorrelation Function
Time lag kACF(k)T-STATP-value
10.7100336.50760
20.4051983.71370.000183
3-0.011264-0.10320.459011
4-0.338724-3.10450.001299
5-0.592951-5.43450
6-0.663109-6.07750
7-0.628773-5.76280
8-0.377797-3.46260.000422
9-0.057725-0.52910.29908
100.3180152.91470.002282
110.5952285.45540
120.8185447.50210
130.5855495.36660
140.3362263.08160.001392
15-0.021991-0.20160.420376
16-0.299672-2.74650.003684
17-0.518078-4.74834e-06
18-0.575033-5.27031e-06
19-0.550093-5.04171e-06
20-0.338402-3.10150.001311
21-0.070329-0.64460.260479
220.2403552.20290.01517
230.4861254.45541.3e-05
240.669286.13410
250.4757064.35991.8e-05
260.2744632.51550.006895
27-0.035381-0.32430.373269
28-0.256208-2.34820.010608
29-0.437087-4.0066.6e-05
30-0.490975-4.49991.1e-05
31-0.46394-4.25212.7e-05
32-0.288897-2.64780.004837
33-0.077639-0.71160.23935
340.1734091.58930.057873
350.3673483.36680.000575
360.5168534.7374e-06
370.3600973.30030.000709
380.1923721.76310.040759
39-0.045625-0.41820.338449
40-0.211713-1.94040.027844
41-0.340789-3.12340.001227
42-0.375085-3.43770.000457
43-0.353256-3.23760.000863
44-0.208267-1.90880.029851
45-0.04206-0.38550.350427
460.150691.38110.085456
470.2980262.73150.003842
480.401013.67530.000209


Partial Autocorrelation Function
Time lag kPACF(k)T-STATP-value
10.7100336.50760
2-0.199554-1.82890.035478
3-0.450929-4.13284.2e-05
4-0.223396-2.04750.021869
5-0.261201-2.39390.009447
6-0.150761-1.38170.085357
7-0.244195-2.23810.013931
80.0420140.38510.350581
90.0810720.7430.229766
100.1861241.70590.045865
110.1946631.78410.039008
120.4733294.33812e-05
13-0.525394-4.81533e-06
14-0.012109-0.1110.455947
150.1348231.23570.110013
160.0249690.22880.409774
170.0125130.11470.454483
180.1272551.16630.123395
190.0053270.04880.480587
20-0.184134-1.68760.047598
21-0.065472-0.60010.275041
220.0111090.10180.459572
230.0435510.39910.345398
240.0532120.48770.313519
25-0.079044-0.72450.2354
26-0.012286-0.11260.455307
27-0.080395-0.73680.231637
280.0118190.10830.456998
29-0.005612-0.05140.479551
30-0.041629-0.38150.351885
310.1055470.96740.168073
32-0.063399-0.58110.281376
33-0.157459-1.44310.076351
34-0.028697-0.2630.396592
35-0.084932-0.77840.219257
36-0.008604-0.07890.468667
37-0.020223-0.18530.426702
38-0.073919-0.67750.249981
390.0921260.84440.200436
40-0.092125-0.84430.200439
41-0.032436-0.29730.383494
420.0142460.13060.448215
43-0.043937-0.40270.344099
440.0217540.19940.421225
450.0365570.33510.369211
46-0.016814-0.15410.438951
47-0.025007-0.22920.409638
48-0.053854-0.49360.311446

\begin{tabular}{lllllllll}
\hline
Partial Autocorrelation Function \tabularnewline
Time lag k & PACF(k) & T-STAT & P-value \tabularnewline
1 & 0.710033 & 6.5076 & 0 \tabularnewline
2 & -0.199554 & -1.8289 & 0.035478 \tabularnewline
3 & -0.450929 & -4.1328 & 4.2e-05 \tabularnewline
4 & -0.223396 & -2.0475 & 0.021869 \tabularnewline
5 & -0.261201 & -2.3939 & 0.009447 \tabularnewline
6 & -0.150761 & -1.3817 & 0.085357 \tabularnewline
7 & -0.244195 & -2.2381 & 0.013931 \tabularnewline
8 & 0.042014 & 0.3851 & 0.350581 \tabularnewline
9 & 0.081072 & 0.743 & 0.229766 \tabularnewline
10 & 0.186124 & 1.7059 & 0.045865 \tabularnewline
11 & 0.194663 & 1.7841 & 0.039008 \tabularnewline
12 & 0.473329 & 4.3381 & 2e-05 \tabularnewline
13 & -0.525394 & -4.8153 & 3e-06 \tabularnewline
14 & -0.012109 & -0.111 & 0.455947 \tabularnewline
15 & 0.134823 & 1.2357 & 0.110013 \tabularnewline
16 & 0.024969 & 0.2288 & 0.409774 \tabularnewline
17 & 0.012513 & 0.1147 & 0.454483 \tabularnewline
18 & 0.127255 & 1.1663 & 0.123395 \tabularnewline
19 & 0.005327 & 0.0488 & 0.480587 \tabularnewline
20 & -0.184134 & -1.6876 & 0.047598 \tabularnewline
21 & -0.065472 & -0.6001 & 0.275041 \tabularnewline
22 & 0.011109 & 0.1018 & 0.459572 \tabularnewline
23 & 0.043551 & 0.3991 & 0.345398 \tabularnewline
24 & 0.053212 & 0.4877 & 0.313519 \tabularnewline
25 & -0.079044 & -0.7245 & 0.2354 \tabularnewline
26 & -0.012286 & -0.1126 & 0.455307 \tabularnewline
27 & -0.080395 & -0.7368 & 0.231637 \tabularnewline
28 & 0.011819 & 0.1083 & 0.456998 \tabularnewline
29 & -0.005612 & -0.0514 & 0.479551 \tabularnewline
30 & -0.041629 & -0.3815 & 0.351885 \tabularnewline
31 & 0.105547 & 0.9674 & 0.168073 \tabularnewline
32 & -0.063399 & -0.5811 & 0.281376 \tabularnewline
33 & -0.157459 & -1.4431 & 0.076351 \tabularnewline
34 & -0.028697 & -0.263 & 0.396592 \tabularnewline
35 & -0.084932 & -0.7784 & 0.219257 \tabularnewline
36 & -0.008604 & -0.0789 & 0.468667 \tabularnewline
37 & -0.020223 & -0.1853 & 0.426702 \tabularnewline
38 & -0.073919 & -0.6775 & 0.249981 \tabularnewline
39 & 0.092126 & 0.8444 & 0.200436 \tabularnewline
40 & -0.092125 & -0.8443 & 0.200439 \tabularnewline
41 & -0.032436 & -0.2973 & 0.383494 \tabularnewline
42 & 0.014246 & 0.1306 & 0.448215 \tabularnewline
43 & -0.043937 & -0.4027 & 0.344099 \tabularnewline
44 & 0.021754 & 0.1994 & 0.421225 \tabularnewline
45 & 0.036557 & 0.3351 & 0.369211 \tabularnewline
46 & -0.016814 & -0.1541 & 0.438951 \tabularnewline
47 & -0.025007 & -0.2292 & 0.409638 \tabularnewline
48 & -0.053854 & -0.4936 & 0.311446 \tabularnewline
\hline
\end{tabular}
%Source: https://freestatistics.org/blog/index.php?pk=72437&T=2

[TABLE]
[ROW][C]Partial Autocorrelation Function[/C][/ROW]
[ROW][C]Time lag k[/C][C]PACF(k)[/C][C]T-STAT[/C][C]P-value[/C][/ROW]
[ROW][C]1[/C][C]0.710033[/C][C]6.5076[/C][C]0[/C][/ROW]
[ROW][C]2[/C][C]-0.199554[/C][C]-1.8289[/C][C]0.035478[/C][/ROW]
[ROW][C]3[/C][C]-0.450929[/C][C]-4.1328[/C][C]4.2e-05[/C][/ROW]
[ROW][C]4[/C][C]-0.223396[/C][C]-2.0475[/C][C]0.021869[/C][/ROW]
[ROW][C]5[/C][C]-0.261201[/C][C]-2.3939[/C][C]0.009447[/C][/ROW]
[ROW][C]6[/C][C]-0.150761[/C][C]-1.3817[/C][C]0.085357[/C][/ROW]
[ROW][C]7[/C][C]-0.244195[/C][C]-2.2381[/C][C]0.013931[/C][/ROW]
[ROW][C]8[/C][C]0.042014[/C][C]0.3851[/C][C]0.350581[/C][/ROW]
[ROW][C]9[/C][C]0.081072[/C][C]0.743[/C][C]0.229766[/C][/ROW]
[ROW][C]10[/C][C]0.186124[/C][C]1.7059[/C][C]0.045865[/C][/ROW]
[ROW][C]11[/C][C]0.194663[/C][C]1.7841[/C][C]0.039008[/C][/ROW]
[ROW][C]12[/C][C]0.473329[/C][C]4.3381[/C][C]2e-05[/C][/ROW]
[ROW][C]13[/C][C]-0.525394[/C][C]-4.8153[/C][C]3e-06[/C][/ROW]
[ROW][C]14[/C][C]-0.012109[/C][C]-0.111[/C][C]0.455947[/C][/ROW]
[ROW][C]15[/C][C]0.134823[/C][C]1.2357[/C][C]0.110013[/C][/ROW]
[ROW][C]16[/C][C]0.024969[/C][C]0.2288[/C][C]0.409774[/C][/ROW]
[ROW][C]17[/C][C]0.012513[/C][C]0.1147[/C][C]0.454483[/C][/ROW]
[ROW][C]18[/C][C]0.127255[/C][C]1.1663[/C][C]0.123395[/C][/ROW]
[ROW][C]19[/C][C]0.005327[/C][C]0.0488[/C][C]0.480587[/C][/ROW]
[ROW][C]20[/C][C]-0.184134[/C][C]-1.6876[/C][C]0.047598[/C][/ROW]
[ROW][C]21[/C][C]-0.065472[/C][C]-0.6001[/C][C]0.275041[/C][/ROW]
[ROW][C]22[/C][C]0.011109[/C][C]0.1018[/C][C]0.459572[/C][/ROW]
[ROW][C]23[/C][C]0.043551[/C][C]0.3991[/C][C]0.345398[/C][/ROW]
[ROW][C]24[/C][C]0.053212[/C][C]0.4877[/C][C]0.313519[/C][/ROW]
[ROW][C]25[/C][C]-0.079044[/C][C]-0.7245[/C][C]0.2354[/C][/ROW]
[ROW][C]26[/C][C]-0.012286[/C][C]-0.1126[/C][C]0.455307[/C][/ROW]
[ROW][C]27[/C][C]-0.080395[/C][C]-0.7368[/C][C]0.231637[/C][/ROW]
[ROW][C]28[/C][C]0.011819[/C][C]0.1083[/C][C]0.456998[/C][/ROW]
[ROW][C]29[/C][C]-0.005612[/C][C]-0.0514[/C][C]0.479551[/C][/ROW]
[ROW][C]30[/C][C]-0.041629[/C][C]-0.3815[/C][C]0.351885[/C][/ROW]
[ROW][C]31[/C][C]0.105547[/C][C]0.9674[/C][C]0.168073[/C][/ROW]
[ROW][C]32[/C][C]-0.063399[/C][C]-0.5811[/C][C]0.281376[/C][/ROW]
[ROW][C]33[/C][C]-0.157459[/C][C]-1.4431[/C][C]0.076351[/C][/ROW]
[ROW][C]34[/C][C]-0.028697[/C][C]-0.263[/C][C]0.396592[/C][/ROW]
[ROW][C]35[/C][C]-0.084932[/C][C]-0.7784[/C][C]0.219257[/C][/ROW]
[ROW][C]36[/C][C]-0.008604[/C][C]-0.0789[/C][C]0.468667[/C][/ROW]
[ROW][C]37[/C][C]-0.020223[/C][C]-0.1853[/C][C]0.426702[/C][/ROW]
[ROW][C]38[/C][C]-0.073919[/C][C]-0.6775[/C][C]0.249981[/C][/ROW]
[ROW][C]39[/C][C]0.092126[/C][C]0.8444[/C][C]0.200436[/C][/ROW]
[ROW][C]40[/C][C]-0.092125[/C][C]-0.8443[/C][C]0.200439[/C][/ROW]
[ROW][C]41[/C][C]-0.032436[/C][C]-0.2973[/C][C]0.383494[/C][/ROW]
[ROW][C]42[/C][C]0.014246[/C][C]0.1306[/C][C]0.448215[/C][/ROW]
[ROW][C]43[/C][C]-0.043937[/C][C]-0.4027[/C][C]0.344099[/C][/ROW]
[ROW][C]44[/C][C]0.021754[/C][C]0.1994[/C][C]0.421225[/C][/ROW]
[ROW][C]45[/C][C]0.036557[/C][C]0.3351[/C][C]0.369211[/C][/ROW]
[ROW][C]46[/C][C]-0.016814[/C][C]-0.1541[/C][C]0.438951[/C][/ROW]
[ROW][C]47[/C][C]-0.025007[/C][C]-0.2292[/C][C]0.409638[/C][/ROW]
[ROW][C]48[/C][C]-0.053854[/C][C]-0.4936[/C][C]0.311446[/C][/ROW]
[/TABLE]
Source: https://freestatistics.org/blog/index.php?pk=72437&T=2

Globally Unique Identifier (entire table): ba.freestatistics.org/blog/index.php?pk=72437&T=2

As an alternative you can also use a QR Code:  

The GUIDs for individual cells are displayed in the table below:

Partial Autocorrelation Function
Time lag kPACF(k)T-STATP-value
10.7100336.50760
2-0.199554-1.82890.035478
3-0.450929-4.13284.2e-05
4-0.223396-2.04750.021869
5-0.261201-2.39390.009447
6-0.150761-1.38170.085357
7-0.244195-2.23810.013931
80.0420140.38510.350581
90.0810720.7430.229766
100.1861241.70590.045865
110.1946631.78410.039008
120.4733294.33812e-05
13-0.525394-4.81533e-06
14-0.012109-0.1110.455947
150.1348231.23570.110013
160.0249690.22880.409774
170.0125130.11470.454483
180.1272551.16630.123395
190.0053270.04880.480587
20-0.184134-1.68760.047598
21-0.065472-0.60010.275041
220.0111090.10180.459572
230.0435510.39910.345398
240.0532120.48770.313519
25-0.079044-0.72450.2354
26-0.012286-0.11260.455307
27-0.080395-0.73680.231637
280.0118190.10830.456998
29-0.005612-0.05140.479551
30-0.041629-0.38150.351885
310.1055470.96740.168073
32-0.063399-0.58110.281376
33-0.157459-1.44310.076351
34-0.028697-0.2630.396592
35-0.084932-0.77840.219257
36-0.008604-0.07890.468667
37-0.020223-0.18530.426702
38-0.073919-0.67750.249981
390.0921260.84440.200436
40-0.092125-0.84430.200439
41-0.032436-0.29730.383494
420.0142460.13060.448215
43-0.043937-0.40270.344099
440.0217540.19940.421225
450.0365570.33510.369211
46-0.016814-0.15410.438951
47-0.025007-0.22920.409638
48-0.053854-0.49360.311446


Parameters (Session):
par1 = 48 ; par2 = 1 ; par3 = 0 ; par4 = 0 ; par5 = 12 ; par6 = White Noise ; par7 = 0.95 ;
Parameters (R input):
par1 = 48 ; par2 = 1 ; par3 = 0 ; par4 = 0 ; par5 = 12 ; par6 = White Noise ; par7 = 0.95 ;
R code (references can be found in the software module):
if (par1 == 'Default') {
par1 = 10*log10(length(x))
} else {
par1 <- as.numeric(par1)
}
par2 <- as.numeric(par2)
par3 <- as.numeric(par3)
par4 <- as.numeric(par4)
par5 <- as.numeric(par5)
if (par6 == 'White Noise') par6 <- 'white' else par6 <- 'ma'
par7 <- as.numeric(par7)
if (par2 == 0) {
x <- log(x)
} else {
x <- (x ^ par2 - 1) / par2
}
if (par3 > 0) x <- diff(x,lag=1,difference=par3)
if (par4 > 0) x <- diff(x,lag=par5,difference=par4)
bitmap(file='pic1.png')
racf <- acf(x, par1, main='Autocorrelation', xlab='time lag', ylab='ACF', ci.type=par6, ci=par7, sub=paste('(lambda=',par2,', d=',par3,', D=',par4,', CI=', par7, ', CI type=',par6,')',sep=''))
dev.off()
bitmap(file='pic2.png')
rpacf <- pacf(x,par1,main='Partial Autocorrelation',xlab='lags',ylab='PACF')
dev.off()
(myacf <- c(racf$acf))
(mypacf <- c(rpacf$acf))
lengthx <- length(x)
sqrtn <- sqrt(lengthx)
load(file='createtable')
a<-table.start()
a<-table.row.start(a)
a<-table.element(a,'Autocorrelation Function',4,TRUE)
a<-table.row.end(a)
a<-table.row.start(a)
a<-table.element(a,'Time lag k',header=TRUE)
a<-table.element(a,hyperlink('basics.htm','ACF(k)','click here for more information about the Autocorrelation Function'),header=TRUE)
a<-table.element(a,'T-STAT',header=TRUE)
a<-table.element(a,'P-value',header=TRUE)
a<-table.row.end(a)
for (i in 2:(par1+1)) {
a<-table.row.start(a)
a<-table.element(a,i-1,header=TRUE)
a<-table.element(a,round(myacf[i],6))
mytstat <- myacf[i]*sqrtn
a<-table.element(a,round(mytstat,4))
a<-table.element(a,round(1-pt(abs(mytstat),lengthx),6))
a<-table.row.end(a)
}
a<-table.end(a)
table.save(a,file='mytable.tab')
a<-table.start()
a<-table.row.start(a)
a<-table.element(a,'Partial Autocorrelation Function',4,TRUE)
a<-table.row.end(a)
a<-table.row.start(a)
a<-table.element(a,'Time lag k',header=TRUE)
a<-table.element(a,hyperlink('basics.htm','PACF(k)','click here for more information about the Partial Autocorrelation Function'),header=TRUE)
a<-table.element(a,'T-STAT',header=TRUE)
a<-table.element(a,'P-value',header=TRUE)
a<-table.row.end(a)
for (i in 1:par1) {
a<-table.row.start(a)
a<-table.element(a,i,header=TRUE)
a<-table.element(a,round(mypacf[i],6))
mytstat <- mypacf[i]*sqrtn
a<-table.element(a,round(mytstat,4))
a<-table.element(a,round(1-pt(abs(mytstat),lengthx),6))
a<-table.row.end(a)
}
a<-table.end(a)
table.save(a,file='mytable1.tab')