Free Statistics

of Irreproducible Research!

Author's title

Author*Unverified author*
R Software Modulerwasp_regression_trees.wasp
Title produced by softwareRecursive Partitioning (Regression Trees)
Date of computationMon, 31 May 2010 09:40:29 +0000
Cite this page as followsStatistical Computations at FreeStatistics.org, Office for Research Development and Education, URL https://freestatistics.org/blog/index.php?v=date/2010/May/31/t127529889279k2a8y2v8cvus7.htm/, Retrieved Thu, 31 Oct 2024 23:38:17 +0000
Statistical Computations at FreeStatistics.org, Office for Research Development and Education, URL https://freestatistics.org/blog/index.php?pk=76728, Retrieved Thu, 31 Oct 2024 23:38:17 +0000
QR Codes:

Original text written by user:
IsPrivate?No (this computation is public)
User-defined keywordsB11A,steven,coomans,regressiontree,permaand
Estimated Impact219
Family? (F = Feedback message, R = changed R code, M = changed R Module, P = changed Parameters, D = changed Data)
-     [Recursive Partitioning (Regression Trees)] [Regression tree,p...] [2010-05-26 09:57:53] [74be16979710d4c4e7c6647856088456]
-    D    [Recursive Partitioning (Regression Trees)] [B11A,steven,cooma...] [2010-05-31 09:40:29] [d41d8cd98f00b204e9800998ecf8427e] [Current]
-    D      [Recursive Partitioning (Regression Trees)] [B11A,steven,cooma...] [2010-06-03 11:51:11] [74be16979710d4c4e7c6647856088456]
Feedback Forum

Post a new message
Dataseries X:
62	NA	NA	NA	32
30	62	62	62	30
31	58.8	58.8	58.8	70
50	56.02	56.02	56.02	30
33	55.418	55.418	55.418	30
12	53.1762	53.1762	53.1762	10
20	49.05858	49.05858	49.05858	30
30	46.152722	46.152722	46.152722	30
21.5	44.5374498	44.5374498	44.5374498	38
23	42.23370482	42.23370482	42.23370482	20
13.5	40.310334338	40.310334338	40.310334338	10
0.5	37.6293009042	37.6293009042	37.6293009042	11
12	33.91637081378	33.91637081378	33.91637081378	12
10	31.724733732402	31.724733732402	31.724733732402	10
70.5	29.5522603591618	29.5522603591618	29.5522603591618	 
30	33.6470343232456	33.6470343232456	33.6470343232456	31
20.5	33.2823308909211	33.2823308909211	33.2823308909211	30
12	32.0040978018290	32.0040978018290	32.0040978018290	12
20	30.0036880216461	30.0036880216461	30.0036880216461	20
45	29.0033192194815	29.0033192194815	29.0033192194815	10
11.505	30.6029872975333	30.6029872975333	30.6029872975333	50
0	28.69318856778	28.69318856778	28.69318856778	10
10	28.69318856778	28.69318856778	28.69318856778	11
5.5	24.3853361009109	24.3853361009109	24.3853361009109	1
27.5	22.6527364586255	22.6527364586255	22.6527364586255	31
0.5	23.1011419666157	23.1011419666157	23.1011419666157	1
7	20.994595040843	20.994595040843	20.994595040843	20
0	19.6813007736305	19.6813007736305	19.6813007736305	0
2.5	19.6813007736305	19.6813007736305	19.6813007736305	0
0	16.5008829011108	16.5008829011108	16.5008829011108	0 
0	16.5008829011108	16.5008829011108	16.5008829011108	0 
6.025	16.5008829011108	16.5008829011108	16.5008829011108	1 
1	13.2638773777770	13.2638773777770	13.2638773777770	0 
0	12.3268664380437	12.3268664380437	12.3268664380437	0 
0	12.3268664380437	12.3268664380437	12.3268664380437	0 
0	12.3268664380437	12.3268664380437	12.3268664380437	0 
0	12.3268664380437	12.3268664380437	12.3268664380437	0 
2	12.3268664380437	12.3268664380437	12.3268664380437	2 
0	8.77286013713574	8.77286013713574	8.77286013713574	2 
6	8.77286013713574	8.77286013713574	8.77286013713574	0 
20	8.09773184771271	8.09773184771271	8.09773184771271	0 
0	8.82386207874147	8.82386207874147	8.82386207874147	0 
0	8.82386207874147	8.82386207874147	8.82386207874147	0 
0	8.82386207874147	8.82386207874147	8.82386207874147	0 
7	8.82386207874147	8.82386207874147	8.82386207874147	5 
35	7.3149510902026	7.3149510902026	7.3149510902026	0 
0	8.86359100991655	8.86359100991655	8.86359100991655	0 
0	8.86359100991655	8.86359100991655	8.86359100991655	0 
0	8.86359100991655	8.86359100991655	8.86359100991655	0 
1	8.86359100991655	8.86359100991655	8.86359100991655	0 


Summary of computational transaction
Raw Inputview raw input (R code)
Raw Outputview raw output of R engine
Computing time6 seconds
R Server'George Udny Yule' @ 72.249.76.132
R Framework error message
Warning: there are blank lines in the 'Data X' field.
Please, use NA for missing data - blank lines are simply
 deleted and are NOT treated as missing values.

\begin{tabular}{lllllllll}
\hline
Summary of computational transaction \tabularnewline
Raw Input & view raw input (R code)  \tabularnewline
Raw Output & view raw output of R engine  \tabularnewline
Computing time & 6 seconds \tabularnewline
R Server & 'George Udny Yule' @ 72.249.76.132 \tabularnewline
R Framework error message & 
Warning: there are blank lines in the 'Data X' field.
Please, use NA for missing data - blank lines are simply
 deleted and are NOT treated as missing values.
\tabularnewline \hline \end{tabular} %Source: https://freestatistics.org/blog/index.php?pk=76728&T=0

[TABLE]
[ROW][C]Summary of computational transaction[/C][/ROW]
[ROW][C]Raw Input[/C][C]view raw input (R code) [/C][/ROW]
[ROW][C]Raw Output[/C][C]view raw output of R engine [/C][/ROW]
[ROW][C]Computing time[/C][C]6 seconds[/C][/ROW]
[ROW][C]R Server[/C][C]'George Udny Yule' @ 72.249.76.132[/C][/ROW]
[ROW][C]R Framework error message[/C][C]
Warning: there are blank lines in the 'Data X' field.
Please, use NA for missing data - blank lines are simply
 deleted and are NOT treated as missing values.
[/C][/ROW] [/TABLE] Source: https://freestatistics.org/blog/index.php?pk=76728&T=0

Globally Unique Identifier (entire table): ba.freestatistics.org/blog/index.php?pk=76728&T=0

As an alternative you can also use a QR Code:  

The GUIDs for individual cells are displayed in the table below:

Summary of computational transaction
Raw Inputview raw input (R code)
Raw Outputview raw output of R engine
Computing time6 seconds
R Server'George Udny Yule' @ 72.249.76.132
R Framework error message
Warning: there are blank lines in the 'Data X' field.
Please, use NA for missing data - blank lines are simply
 deleted and are NOT treated as missing values.


Model Performance
#Complexitysplitrelative errorCV errorCV S.D.
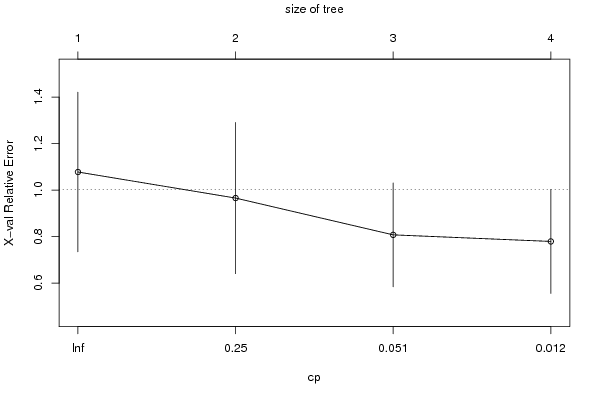
10.361011.0780.343
20.17710.6390.9660.325
30.01520.4620.8070.223
40.0130.4470.7790.223

\begin{tabular}{lllllllll}
\hline
Model Performance \tabularnewline
# & Complexity & split & relative error & CV error & CV S.D. \tabularnewline
1 & 0.361 & 0 & 1 & 1.078 & 0.343 \tabularnewline
2 & 0.177 & 1 & 0.639 & 0.966 & 0.325 \tabularnewline
3 & 0.015 & 2 & 0.462 & 0.807 & 0.223 \tabularnewline
4 & 0.01 & 3 & 0.447 & 0.779 & 0.223 \tabularnewline
\hline
\end{tabular}
%Source: https://freestatistics.org/blog/index.php?pk=76728&T=1

[TABLE]
[ROW][C]Model Performance[/C][/ROW]
[ROW][C]#[/C][C]Complexity[/C][C]split[/C][C]relative error[/C][C]CV error[/C][C]CV S.D.[/C][/ROW]
[ROW][C]1[/C][C]0.361[/C][C]0[/C][C]1[/C][C]1.078[/C][C]0.343[/C][/ROW]
[ROW][C]2[/C][C]0.177[/C][C]1[/C][C]0.639[/C][C]0.966[/C][C]0.325[/C][/ROW]
[ROW][C]3[/C][C]0.015[/C][C]2[/C][C]0.462[/C][C]0.807[/C][C]0.223[/C][/ROW]
[ROW][C]4[/C][C]0.01[/C][C]3[/C][C]0.447[/C][C]0.779[/C][C]0.223[/C][/ROW]
[/TABLE]
Source: https://freestatistics.org/blog/index.php?pk=76728&T=1

Globally Unique Identifier (entire table): ba.freestatistics.org/blog/index.php?pk=76728&T=1

As an alternative you can also use a QR Code:  

The GUIDs for individual cells are displayed in the table below:

Model Performance
#Complexitysplitrelative errorCV errorCV S.D.
10.361011.0780.343
20.17710.6390.9660.325
30.01520.4620.8070.223
40.0130.4470.7790.223


Parameters (Session):
par1 = 1 ; par2 = No ;
Parameters (R input):
par1 = 1 ; par2 = No ;
R code (references can be found in the software module):
library(rpart)
library(partykit)
par1 <- as.numeric(par1)
autoprune <- function ( tree, method='Minimum CV'){
xerr <- tree$cptable[,'xerror']
cpmin.id <- which.min(xerr)
if (method == 'Minimum CV Error plus 1 SD'){
xstd <- tree$cptable[,'xstd']
errt <- xerr[cpmin.id] + xstd[cpmin.id]
cpSE1.min <- which.min( errt < xerr )
mycp <- (tree$cptable[,'CP'])[cpSE1.min]
}
if (method == 'Minimum CV') {
mycp <- (tree$cptable[,'CP'])[cpmin.id]
}
return (mycp)
}
conf.multi.mat <- function(true, new)
{
if ( all( is.na(match( levels(true),levels(new) ) )) )
stop ( 'conflict of vector levels')
multi.t <- list()
for (mylev in levels(true) ) {
true.tmp <- true
new.tmp <- new
left.lev <- levels (true.tmp)[- match(mylev,levels(true) ) ]
levels(true.tmp) <- list ( mylev = mylev, all = left.lev )
levels(new.tmp) <- list ( mylev = mylev, all = left.lev )
curr.t <- conf.mat ( true.tmp , new.tmp )
multi.t[[mylev]] <- curr.t
multi.t[[mylev]]$precision <-
round( curr.t$conf[1,1] / sum( curr.t$conf[1,] ), 2 )
}
return (multi.t)
}
x <- t(y)
k <- length(x[1,])
n <- length(x[,1])
x1 <- cbind(x[,par1], x[,1:k!=par1])
mycolnames <- c(colnames(x)[par1], colnames(x)[1:k!=par1])
colnames(x1) <- mycolnames #colnames(x)[par1]
m <- rpart(as.data.frame(x1))
par2
if (par2 != 'No') {
mincp <- autoprune(m,method=par2)
print(mincp)
m <- prune(m,cp=mincp)
}
m$cptable
bitmap(file='test1.png')
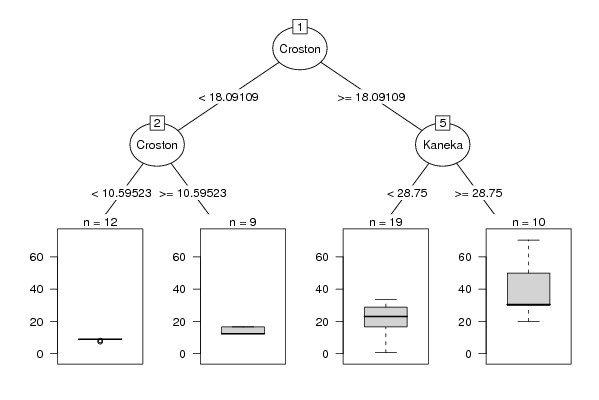
plot(as.party(m),tp_args=list(id=FALSE))
dev.off()
bitmap(file='test2.png')
plotcp(m)
dev.off()
cbind(y=m$y,pred=predict(m),res=residuals(m))
myr <- residuals(m)
myp <- predict(m)
bitmap(file='test4.png')
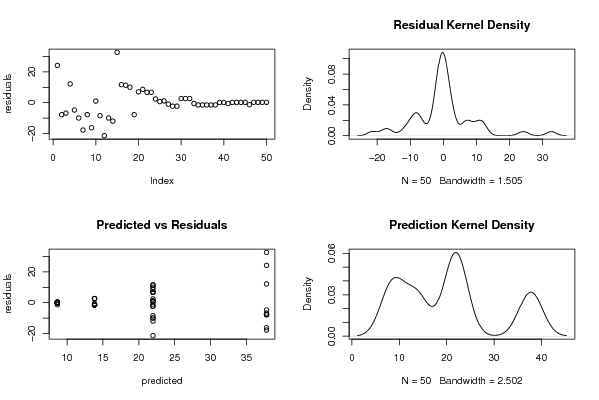
op <- par(mfrow=c(2,2))
plot(myr,ylab='residuals')
plot(density(myr),main='Residual Kernel Density')
plot(myp,myr,xlab='predicted',ylab='residuals',main='Predicted vs Residuals')
plot(density(myp),main='Prediction Kernel Density')
par(op)
dev.off()
load(file='createtable')
a<-table.start()
a<-table.row.start(a)
a<-table.element(a,'Model Performance',6,TRUE)
a<-table.row.end(a)
a<-table.row.start(a)
a<-table.element(a,'#',header=TRUE)
a<-table.element(a,'Complexity',header=TRUE)
a<-table.element(a,'split',header=TRUE)
a<-table.element(a,'relative error',header=TRUE)
a<-table.element(a,'CV error',header=TRUE)
a<-table.element(a,'CV S.D.',header=TRUE)
a<-table.row.end(a)
for (i in 1:length(m$cptable[,1])) {
a<-table.row.start(a)
a<-table.element(a,i,header=TRUE)
a<-table.element(a,round(m$cptable[i,'CP'],3))
a<-table.element(a,m$cptable[i,'nsplit'])
a<-table.element(a,round(m$cptable[i,'rel error'],3))
a<-table.element(a,round(m$cptable[i,'xerror'],3))
a<-table.element(a,round(m$cptable[i,'xstd'],3))
a<-table.row.end(a)
}
a<-table.end(a)
table.save(a,file='mytable.tab')