Free Statistics

of Irreproducible Research!

Author's title

Author*Unverified author*
R Software Modulerwasp_smp.wasp
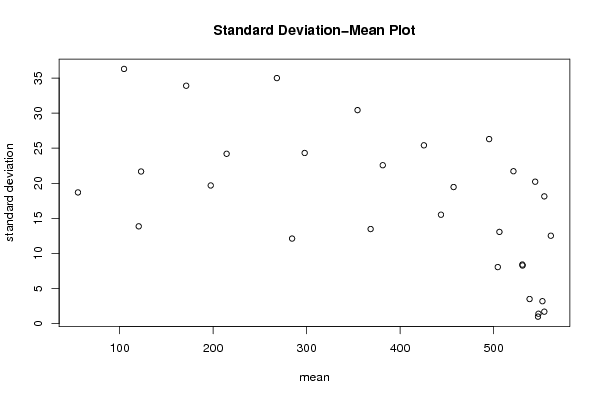
Title produced by softwareStandard Deviation-Mean Plot
Date of computationMon, 16 Aug 2010 11:13:57 +0000
Cite this page as followsStatistical Computations at FreeStatistics.org, Office for Research Development and Education, URL https://freestatistics.org/blog/index.php?v=date/2010/Aug/16/t1281957207f7hqz58eygb87yd.htm/, Retrieved Thu, 31 Oct 2024 23:02:38 +0000
Statistical Computations at FreeStatistics.org, Office for Research Development and Education, URL https://freestatistics.org/blog/index.php?pk=78956, Retrieved Thu, 31 Oct 2024 23:02:38 +0000
QR Codes:

Original text written by user:
IsPrivate?No (this computation is public)
User-defined keywords
Estimated Impact159
Family? (F = Feedback message, R = changed R code, M = changed R Module, P = changed Parameters, D = changed Data)
-       [Standard Deviation-Mean Plot] [Aantal bezoekers] [2010-08-16 11:13:57] [5e78ed906b09bab42b8ec3dd93b6358a] [Current]
Feedback Forum

Post a new message
Dataseries X:
556
555
554
552
572
571
556
546
547
547
548
550
555
549
555
550
566
573
543
535
542
541
535
536
548
546
548
548
561
563
527
527
541
534
522
527
539
533
532
519
538
542
503
502
522
511
492
500
509
511
505
493
518
518
474
471
483
461
439
446
461
449
441
424
447
448
404
403
411
386
359
370
385
369
368
352
378
383
334
323
330
303
275
284
301
281
284
272
297
300
240
236
247
218
192
201
223
197
195
175
197
204
142
142
151
127
100
114
139
112
123
108
132
140
76
71
81
57
38
46


Summary of computational transaction
Raw Inputview raw input (R code)
Raw Outputview raw output of R engine
Computing time2 seconds
R Server'Sir Ronald Aylmer Fisher' @ 193.190.124.24

\begin{tabular}{lllllllll}
\hline
Summary of computational transaction \tabularnewline
Raw Input & view raw input (R code)  \tabularnewline
Raw Output & view raw output of R engine  \tabularnewline
Computing time & 2 seconds \tabularnewline
R Server & 'Sir Ronald Aylmer Fisher' @ 193.190.124.24 \tabularnewline
\hline
\end{tabular}
%Source: https://freestatistics.org/blog/index.php?pk=78956&T=0

[TABLE]
[ROW][C]Summary of computational transaction[/C][/ROW]
[ROW][C]Raw Input[/C][C]view raw input (R code) [/C][/ROW]
[ROW][C]Raw Output[/C][C]view raw output of R engine [/C][/ROW]
[ROW][C]Computing time[/C][C]2 seconds[/C][/ROW]
[ROW][C]R Server[/C][C]'Sir Ronald Aylmer Fisher' @ 193.190.124.24[/C][/ROW]
[/TABLE]
Source: https://freestatistics.org/blog/index.php?pk=78956&T=0

Globally Unique Identifier (entire table): ba.freestatistics.org/blog/index.php?pk=78956&T=0

As an alternative you can also use a QR Code:  

The GUIDs for individual cells are displayed in the table below:

Summary of computational transaction
Raw Inputview raw input (R code)
Raw Outputview raw output of R engine
Computing time2 seconds
R Server'Sir Ronald Aylmer Fisher' @ 193.190.124.24


Standard Deviation-Mean Plot
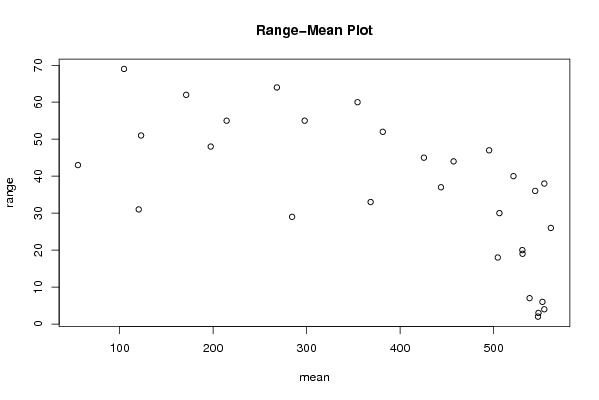
SectionMeanStandard DeviationRange
1554.251.707825127659934
2561.2512.526638282742426
35481.414213562373103
4552.253.201562118716426
5554.2518.136059844041838
6538.53.511884584284257
7547.512
8544.520.223748416156736
95318.2865352631040419
10530.758.4212033977731920
11521.2521.715969546242540
12506.2513.073510112692330
13504.58.0622577482985518
14495.2526.297972038416547
15457.2519.465781943365844
16443.7515.521490478258437
17425.525.409971795865245
18381.522.575798250929452
19368.513.478377746103833
20354.530.424770609926860
2129824.317346346452655
22284.512.124355652982129
23268.2534.989284073841864
24214.524.200550957915555
25197.519.689252567496548
26171.2533.895673273541462
2712321.679483388678851
28120.513.868429375143131
29104.7536.289346462380269
3055.518.699376103674343

\begin{tabular}{lllllllll}
\hline
Standard Deviation-Mean Plot \tabularnewline
Section & Mean & Standard Deviation & Range \tabularnewline
1 & 554.25 & 1.70782512765993 & 4 \tabularnewline
2 & 561.25 & 12.5266382827424 & 26 \tabularnewline
3 & 548 & 1.41421356237310 & 3 \tabularnewline
4 & 552.25 & 3.20156211871642 & 6 \tabularnewline
5 & 554.25 & 18.1360598440418 & 38 \tabularnewline
6 & 538.5 & 3.51188458428425 & 7 \tabularnewline
7 & 547.5 & 1 & 2 \tabularnewline
8 & 544.5 & 20.2237484161567 & 36 \tabularnewline
9 & 531 & 8.28653526310404 & 19 \tabularnewline
10 & 530.75 & 8.42120339777319 & 20 \tabularnewline
11 & 521.25 & 21.7159695462425 & 40 \tabularnewline
12 & 506.25 & 13.0735101126923 & 30 \tabularnewline
13 & 504.5 & 8.06225774829855 & 18 \tabularnewline
14 & 495.25 & 26.2979720384165 & 47 \tabularnewline
15 & 457.25 & 19.4657819433658 & 44 \tabularnewline
16 & 443.75 & 15.5214904782584 & 37 \tabularnewline
17 & 425.5 & 25.4099717958652 & 45 \tabularnewline
18 & 381.5 & 22.5757982509294 & 52 \tabularnewline
19 & 368.5 & 13.4783777461038 & 33 \tabularnewline
20 & 354.5 & 30.4247706099268 & 60 \tabularnewline
21 & 298 & 24.3173463464526 & 55 \tabularnewline
22 & 284.5 & 12.1243556529821 & 29 \tabularnewline
23 & 268.25 & 34.9892840738418 & 64 \tabularnewline
24 & 214.5 & 24.2005509579155 & 55 \tabularnewline
25 & 197.5 & 19.6892525674965 & 48 \tabularnewline
26 & 171.25 & 33.8956732735414 & 62 \tabularnewline
27 & 123 & 21.6794833886788 & 51 \tabularnewline
28 & 120.5 & 13.8684293751431 & 31 \tabularnewline
29 & 104.75 & 36.2893464623802 & 69 \tabularnewline
30 & 55.5 & 18.6993761036743 & 43 \tabularnewline
\hline
\end{tabular}
%Source: https://freestatistics.org/blog/index.php?pk=78956&T=1

[TABLE]
[ROW][C]Standard Deviation-Mean Plot[/C][/ROW]
[ROW][C]Section[/C][C]Mean[/C][C]Standard Deviation[/C][C]Range[/C][/ROW]
[ROW][C]1[/C][C]554.25[/C][C]1.70782512765993[/C][C]4[/C][/ROW]
[ROW][C]2[/C][C]561.25[/C][C]12.5266382827424[/C][C]26[/C][/ROW]
[ROW][C]3[/C][C]548[/C][C]1.41421356237310[/C][C]3[/C][/ROW]
[ROW][C]4[/C][C]552.25[/C][C]3.20156211871642[/C][C]6[/C][/ROW]
[ROW][C]5[/C][C]554.25[/C][C]18.1360598440418[/C][C]38[/C][/ROW]
[ROW][C]6[/C][C]538.5[/C][C]3.51188458428425[/C][C]7[/C][/ROW]
[ROW][C]7[/C][C]547.5[/C][C]1[/C][C]2[/C][/ROW]
[ROW][C]8[/C][C]544.5[/C][C]20.2237484161567[/C][C]36[/C][/ROW]
[ROW][C]9[/C][C]531[/C][C]8.28653526310404[/C][C]19[/C][/ROW]
[ROW][C]10[/C][C]530.75[/C][C]8.42120339777319[/C][C]20[/C][/ROW]
[ROW][C]11[/C][C]521.25[/C][C]21.7159695462425[/C][C]40[/C][/ROW]
[ROW][C]12[/C][C]506.25[/C][C]13.0735101126923[/C][C]30[/C][/ROW]
[ROW][C]13[/C][C]504.5[/C][C]8.06225774829855[/C][C]18[/C][/ROW]
[ROW][C]14[/C][C]495.25[/C][C]26.2979720384165[/C][C]47[/C][/ROW]
[ROW][C]15[/C][C]457.25[/C][C]19.4657819433658[/C][C]44[/C][/ROW]
[ROW][C]16[/C][C]443.75[/C][C]15.5214904782584[/C][C]37[/C][/ROW]
[ROW][C]17[/C][C]425.5[/C][C]25.4099717958652[/C][C]45[/C][/ROW]
[ROW][C]18[/C][C]381.5[/C][C]22.5757982509294[/C][C]52[/C][/ROW]
[ROW][C]19[/C][C]368.5[/C][C]13.4783777461038[/C][C]33[/C][/ROW]
[ROW][C]20[/C][C]354.5[/C][C]30.4247706099268[/C][C]60[/C][/ROW]
[ROW][C]21[/C][C]298[/C][C]24.3173463464526[/C][C]55[/C][/ROW]
[ROW][C]22[/C][C]284.5[/C][C]12.1243556529821[/C][C]29[/C][/ROW]
[ROW][C]23[/C][C]268.25[/C][C]34.9892840738418[/C][C]64[/C][/ROW]
[ROW][C]24[/C][C]214.5[/C][C]24.2005509579155[/C][C]55[/C][/ROW]
[ROW][C]25[/C][C]197.5[/C][C]19.6892525674965[/C][C]48[/C][/ROW]
[ROW][C]26[/C][C]171.25[/C][C]33.8956732735414[/C][C]62[/C][/ROW]
[ROW][C]27[/C][C]123[/C][C]21.6794833886788[/C][C]51[/C][/ROW]
[ROW][C]28[/C][C]120.5[/C][C]13.8684293751431[/C][C]31[/C][/ROW]
[ROW][C]29[/C][C]104.75[/C][C]36.2893464623802[/C][C]69[/C][/ROW]
[ROW][C]30[/C][C]55.5[/C][C]18.6993761036743[/C][C]43[/C][/ROW]
[/TABLE]
Source: https://freestatistics.org/blog/index.php?pk=78956&T=1

Globally Unique Identifier (entire table): ba.freestatistics.org/blog/index.php?pk=78956&T=1

As an alternative you can also use a QR Code:  

The GUIDs for individual cells are displayed in the table below:

Standard Deviation-Mean Plot
SectionMeanStandard DeviationRange
1554.251.707825127659934
2561.2512.526638282742426
35481.414213562373103
4552.253.201562118716426
5554.2518.136059844041838
6538.53.511884584284257
7547.512
8544.520.223748416156736
95318.2865352631040419
10530.758.4212033977731920
11521.2521.715969546242540
12506.2513.073510112692330
13504.58.0622577482985518
14495.2526.297972038416547
15457.2519.465781943365844
16443.7515.521490478258437
17425.525.409971795865245
18381.522.575798250929452
19368.513.478377746103833
20354.530.424770609926860
2129824.317346346452655
22284.512.124355652982129
23268.2534.989284073841864
24214.524.200550957915555
25197.519.689252567496548
26171.2533.895673273541462
2712321.679483388678851
28120.513.868429375143131
29104.7536.289346462380269
3055.518.699376103674343


Regression: S.E.(k) = alpha + beta * Mean(k)
alpha31.1504599322046
beta-0.0357455513275429
S.D.0.00928544538990654
T-STAT-3.84963238989042
p-value0.0006279520876671

\begin{tabular}{lllllllll}
\hline
Regression: S.E.(k) = alpha + beta * Mean(k) \tabularnewline
alpha & 31.1504599322046 \tabularnewline
beta & -0.0357455513275429 \tabularnewline
S.D. & 0.00928544538990654 \tabularnewline
T-STAT & -3.84963238989042 \tabularnewline
p-value & 0.0006279520876671 \tabularnewline
\hline
\end{tabular}
%Source: https://freestatistics.org/blog/index.php?pk=78956&T=2

[TABLE]
[ROW][C]Regression: S.E.(k) = alpha + beta * Mean(k)[/C][/ROW]
[ROW][C]alpha[/C][C]31.1504599322046[/C][/ROW]
[ROW][C]beta[/C][C]-0.0357455513275429[/C][/ROW]
[ROW][C]S.D.[/C][C]0.00928544538990654[/C][/ROW]
[ROW][C]T-STAT[/C][C]-3.84963238989042[/C][/ROW]
[ROW][C]p-value[/C][C]0.0006279520876671[/C][/ROW]
[/TABLE]
Source: https://freestatistics.org/blog/index.php?pk=78956&T=2

Globally Unique Identifier (entire table): ba.freestatistics.org/blog/index.php?pk=78956&T=2

As an alternative you can also use a QR Code:  

The GUIDs for individual cells are displayed in the table below:

Regression: S.E.(k) = alpha + beta * Mean(k)
alpha31.1504599322046
beta-0.0357455513275429
S.D.0.00928544538990654
T-STAT-3.84963238989042
p-value0.0006279520876671


Regression: ln S.E.(k) = alpha + beta * ln Mean(k)
alpha6.68560755644032
beta-0.710767435643548
S.D.0.26378315358349
T-STAT-2.6945141340066
p-value0.0117808602285926
Lambda1.71076743564355

\begin{tabular}{lllllllll}
\hline
Regression: ln S.E.(k) = alpha + beta * ln Mean(k) \tabularnewline
alpha & 6.68560755644032 \tabularnewline
beta & -0.710767435643548 \tabularnewline
S.D. & 0.26378315358349 \tabularnewline
T-STAT & -2.6945141340066 \tabularnewline
p-value & 0.0117808602285926 \tabularnewline
Lambda & 1.71076743564355 \tabularnewline
\hline
\end{tabular}
%Source: https://freestatistics.org/blog/index.php?pk=78956&T=3

[TABLE]
[ROW][C]Regression: ln S.E.(k) = alpha + beta * ln Mean(k)[/C][/ROW]
[ROW][C]alpha[/C][C]6.68560755644032[/C][/ROW]
[ROW][C]beta[/C][C]-0.710767435643548[/C][/ROW]
[ROW][C]S.D.[/C][C]0.26378315358349[/C][/ROW]
[ROW][C]T-STAT[/C][C]-2.6945141340066[/C][/ROW]
[ROW][C]p-value[/C][C]0.0117808602285926[/C][/ROW]
[ROW][C]Lambda[/C][C]1.71076743564355[/C][/ROW]
[/TABLE]
Source: https://freestatistics.org/blog/index.php?pk=78956&T=3

Globally Unique Identifier (entire table): ba.freestatistics.org/blog/index.php?pk=78956&T=3

As an alternative you can also use a QR Code:  

The GUIDs for individual cells are displayed in the table below:

Regression: ln S.E.(k) = alpha + beta * ln Mean(k)
alpha6.68560755644032
beta-0.710767435643548
S.D.0.26378315358349
T-STAT-2.6945141340066
p-value0.0117808602285926
Lambda1.71076743564355


Parameters (Session):
par1 = 4 ;
Parameters (R input):
par1 = 4 ;
R code (references can be found in the software module):
par1 <- as.numeric(par1)
(n <- length(x))
(np <- floor(n / par1))
arr <- array(NA,dim=c(par1,np))
j <- 0
k <- 1
for (i in 1:(np*par1))
{
j = j + 1
arr[j,k] <- x[i]
if (j == par1) {
j = 0
k=k+1
}
}
arr
arr.mean <- array(NA,dim=np)
arr.sd <- array(NA,dim=np)
arr.range <- array(NA,dim=np)
for (j in 1:np)
{
arr.mean[j] <- mean(arr[,j],na.rm=TRUE)
arr.sd[j] <- sd(arr[,j],na.rm=TRUE)
arr.range[j] <- max(arr[,j],na.rm=TRUE) - min(arr[,j],na.rm=TRUE)
}
arr.mean
arr.sd
arr.range
(lm1 <- lm(arr.sd~arr.mean))
(lnlm1 <- lm(log(arr.sd)~log(arr.mean)))
(lm2 <- lm(arr.range~arr.mean))
bitmap(file='test1.png')
plot(arr.mean,arr.sd,main='Standard Deviation-Mean Plot',xlab='mean',ylab='standard deviation')
dev.off()
bitmap(file='test2.png')
plot(arr.mean,arr.range,main='Range-Mean Plot',xlab='mean',ylab='range')
dev.off()
load(file='createtable')
a<-table.start()
a<-table.row.start(a)
a<-table.element(a,'Standard Deviation-Mean Plot',4,TRUE)
a<-table.row.end(a)
a<-table.row.start(a)
a<-table.element(a,'Section',header=TRUE)
a<-table.element(a,'Mean',header=TRUE)
a<-table.element(a,'Standard Deviation',header=TRUE)
a<-table.element(a,'Range',header=TRUE)
a<-table.row.end(a)
for (j in 1:np) {
a<-table.row.start(a)
a<-table.element(a,j,header=TRUE)
a<-table.element(a,arr.mean[j])
a<-table.element(a,arr.sd[j] )
a<-table.element(a,arr.range[j] )
a<-table.row.end(a)
}
a<-table.end(a)
table.save(a,file='mytable.tab')
a<-table.start()
a<-table.row.start(a)
a<-table.element(a,'Regression: S.E.(k) = alpha + beta * Mean(k)',2,TRUE)
a<-table.row.end(a)
a<-table.row.start(a)
a<-table.element(a,'alpha',header=TRUE)
a<-table.element(a,lm1$coefficients[[1]])
a<-table.row.end(a)
a<-table.row.start(a)
a<-table.element(a,'beta',header=TRUE)
a<-table.element(a,lm1$coefficients[[2]])
a<-table.row.end(a)
a<-table.row.start(a)
a<-table.element(a,'S.D.',header=TRUE)
a<-table.element(a,summary(lm1)$coefficients[2,2])
a<-table.row.end(a)
a<-table.row.start(a)
a<-table.element(a,'T-STAT',header=TRUE)
a<-table.element(a,summary(lm1)$coefficients[2,3])
a<-table.row.end(a)
a<-table.row.start(a)
a<-table.element(a,'p-value',header=TRUE)
a<-table.element(a,summary(lm1)$coefficients[2,4])
a<-table.row.end(a)
a<-table.end(a)
table.save(a,file='mytable1.tab')
a<-table.start()
a<-table.row.start(a)
a<-table.element(a,'Regression: ln S.E.(k) = alpha + beta * ln Mean(k)',2,TRUE)
a<-table.row.end(a)
a<-table.row.start(a)
a<-table.element(a,'alpha',header=TRUE)
a<-table.element(a,lnlm1$coefficients[[1]])
a<-table.row.end(a)
a<-table.row.start(a)
a<-table.element(a,'beta',header=TRUE)
a<-table.element(a,lnlm1$coefficients[[2]])
a<-table.row.end(a)
a<-table.row.start(a)
a<-table.element(a,'S.D.',header=TRUE)
a<-table.element(a,summary(lnlm1)$coefficients[2,2])
a<-table.row.end(a)
a<-table.row.start(a)
a<-table.element(a,'T-STAT',header=TRUE)
a<-table.element(a,summary(lnlm1)$coefficients[2,3])
a<-table.row.end(a)
a<-table.row.start(a)
a<-table.element(a,'p-value',header=TRUE)
a<-table.element(a,summary(lnlm1)$coefficients[2,4])
a<-table.row.end(a)
a<-table.row.start(a)
a<-table.element(a,'Lambda',header=TRUE)
a<-table.element(a,1-lnlm1$coefficients[[2]])
a<-table.row.end(a)
a<-table.end(a)
table.save(a,file='mytable2.tab')