Free Statistics

of Irreproducible Research!

Author's title

Author*Unverified author*
R Software Modulerwasp_autocorrelation.wasp
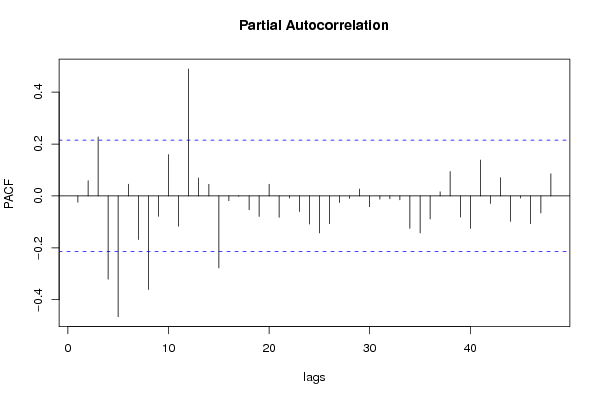
Title produced by software(Partial) Autocorrelation Function
Date of computationTue, 17 Aug 2010 16:11:19 +0000
Cite this page as followsStatistical Computations at FreeStatistics.org, Office for Research Development and Education, URL https://freestatistics.org/blog/index.php?v=date/2010/Aug/17/t1282061507n3k52od3lafxdqs.htm/, Retrieved Thu, 31 Oct 2024 23:53:14 +0000
Statistical Computations at FreeStatistics.org, Office for Research Development and Education, URL https://freestatistics.org/blog/index.php?pk=79147, Retrieved Thu, 31 Oct 2024 23:53:14 +0000
QR Codes:

Original text written by user:
IsPrivate?No (this computation is public)
User-defined keywordsMagali De Reu
Estimated Impact149
Family? (F = Feedback message, R = changed R code, M = changed R Module, P = changed Parameters, D = changed Data)
-       [(Partial) Autocorrelation Function] [tijdreeks 2 stap 18] [2010-08-17 16:11:19] [07915b1f88a41fb8d82e27c5eaa7bbed] [Current]
Feedback Forum

Post a new message
Dataseries X:
120
119
118
116
114
113
114
116
117
117
118
120
123
125
120
116
111
108
113
112
126
124
124
118
119
122
114
108
104
101
107
104
123
125
134
131
127
124
123
117
112
118
123
124
144
148
152
154
146
132
136
128
120
124
126
121
140
142
142
139
131
117
122
112
98
103
108
102
126
129
126
126
112
99
106
104
90
98
99
91
118
115
119
123


Summary of computational transaction
Raw Inputview raw input (R code)
Raw Outputview raw output of R engine
Computing time2 seconds
R Server'Gwilym Jenkins' @ 72.249.127.135

\begin{tabular}{lllllllll}
\hline
Summary of computational transaction \tabularnewline
Raw Input & view raw input (R code)  \tabularnewline
Raw Output & view raw output of R engine  \tabularnewline
Computing time & 2 seconds \tabularnewline
R Server & 'Gwilym Jenkins' @ 72.249.127.135 \tabularnewline
\hline
\end{tabular}
%Source: https://freestatistics.org/blog/index.php?pk=79147&T=0

[TABLE]
[ROW][C]Summary of computational transaction[/C][/ROW]
[ROW][C]Raw Input[/C][C]view raw input (R code) [/C][/ROW]
[ROW][C]Raw Output[/C][C]view raw output of R engine [/C][/ROW]
[ROW][C]Computing time[/C][C]2 seconds[/C][/ROW]
[ROW][C]R Server[/C][C]'Gwilym Jenkins' @ 72.249.127.135[/C][/ROW]
[/TABLE]
Source: https://freestatistics.org/blog/index.php?pk=79147&T=0

Globally Unique Identifier (entire table): ba.freestatistics.org/blog/index.php?pk=79147&T=0

As an alternative you can also use a QR Code:  

The GUIDs for individual cells are displayed in the table below:

Summary of computational transaction
Raw Inputview raw input (R code)
Raw Outputview raw output of R engine
Computing time2 seconds
R Server'Gwilym Jenkins' @ 72.249.127.135


Autocorrelation Function
Time lag kACF(k)T-STATP-value
1-0.02409-0.21950.413411
20.0591850.53920.295595
30.2237332.03830.022352
4-0.312817-2.84990.002757
5-0.366456-3.33860.000631
60.0637070.58040.281608
7-0.364446-3.32030.000669
8-0.268948-2.45020.008189
90.2097531.91090.029732
100.0359760.32780.371962
11-0.007849-0.07150.471584
120.7226746.58390
130.0173350.15790.43745
140.0619890.56480.286883
150.1084280.98780.163055
16-0.253367-2.30830.011736
17-0.355572-3.23940.000862
180.00180.01640.493479
19-0.300164-2.73460.003817
20-0.187423-1.70750.045733
210.1318291.2010.11658
220.0811780.73960.230825
230.0176340.16070.436379
240.4789554.36351.8e-05
250.0312680.28490.38823
260.0377640.3440.36584
270.032340.29460.384506
28-0.173187-1.57780.059206
29-0.279046-2.54220.006436
30-0.035201-0.32070.374624
31-0.198042-1.80420.03741
32-0.09409-0.85720.196901
330.0877950.79990.21304
340.0955940.87090.193159
350.0166530.15170.439888
360.3079612.80570.003127
370.0445070.40550.343086
380.0686170.62510.2668
39-0.033538-0.30550.380357
40-0.114954-1.04730.149004
41-0.12724-1.15920.124847
42-0.076485-0.69680.243933
43-0.054467-0.49620.310527
44-0.025647-0.23370.407913
450.0331180.30170.381811
460.0824750.75140.227275
470.0055720.05080.479817
480.1770091.61260.055311

\begin{tabular}{lllllllll}
\hline
Autocorrelation Function \tabularnewline
Time lag k & ACF(k) & T-STAT & P-value \tabularnewline
1 & -0.02409 & -0.2195 & 0.413411 \tabularnewline
2 & 0.059185 & 0.5392 & 0.295595 \tabularnewline
3 & 0.223733 & 2.0383 & 0.022352 \tabularnewline
4 & -0.312817 & -2.8499 & 0.002757 \tabularnewline
5 & -0.366456 & -3.3386 & 0.000631 \tabularnewline
6 & 0.063707 & 0.5804 & 0.281608 \tabularnewline
7 & -0.364446 & -3.3203 & 0.000669 \tabularnewline
8 & -0.268948 & -2.4502 & 0.008189 \tabularnewline
9 & 0.209753 & 1.9109 & 0.029732 \tabularnewline
10 & 0.035976 & 0.3278 & 0.371962 \tabularnewline
11 & -0.007849 & -0.0715 & 0.471584 \tabularnewline
12 & 0.722674 & 6.5839 & 0 \tabularnewline
13 & 0.017335 & 0.1579 & 0.43745 \tabularnewline
14 & 0.061989 & 0.5648 & 0.286883 \tabularnewline
15 & 0.108428 & 0.9878 & 0.163055 \tabularnewline
16 & -0.253367 & -2.3083 & 0.011736 \tabularnewline
17 & -0.355572 & -3.2394 & 0.000862 \tabularnewline
18 & 0.0018 & 0.0164 & 0.493479 \tabularnewline
19 & -0.300164 & -2.7346 & 0.003817 \tabularnewline
20 & -0.187423 & -1.7075 & 0.045733 \tabularnewline
21 & 0.131829 & 1.201 & 0.11658 \tabularnewline
22 & 0.081178 & 0.7396 & 0.230825 \tabularnewline
23 & 0.017634 & 0.1607 & 0.436379 \tabularnewline
24 & 0.478955 & 4.3635 & 1.8e-05 \tabularnewline
25 & 0.031268 & 0.2849 & 0.38823 \tabularnewline
26 & 0.037764 & 0.344 & 0.36584 \tabularnewline
27 & 0.03234 & 0.2946 & 0.384506 \tabularnewline
28 & -0.173187 & -1.5778 & 0.059206 \tabularnewline
29 & -0.279046 & -2.5422 & 0.006436 \tabularnewline
30 & -0.035201 & -0.3207 & 0.374624 \tabularnewline
31 & -0.198042 & -1.8042 & 0.03741 \tabularnewline
32 & -0.09409 & -0.8572 & 0.196901 \tabularnewline
33 & 0.087795 & 0.7999 & 0.21304 \tabularnewline
34 & 0.095594 & 0.8709 & 0.193159 \tabularnewline
35 & 0.016653 & 0.1517 & 0.439888 \tabularnewline
36 & 0.307961 & 2.8057 & 0.003127 \tabularnewline
37 & 0.044507 & 0.4055 & 0.343086 \tabularnewline
38 & 0.068617 & 0.6251 & 0.2668 \tabularnewline
39 & -0.033538 & -0.3055 & 0.380357 \tabularnewline
40 & -0.114954 & -1.0473 & 0.149004 \tabularnewline
41 & -0.12724 & -1.1592 & 0.124847 \tabularnewline
42 & -0.076485 & -0.6968 & 0.243933 \tabularnewline
43 & -0.054467 & -0.4962 & 0.310527 \tabularnewline
44 & -0.025647 & -0.2337 & 0.407913 \tabularnewline
45 & 0.033118 & 0.3017 & 0.381811 \tabularnewline
46 & 0.082475 & 0.7514 & 0.227275 \tabularnewline
47 & 0.005572 & 0.0508 & 0.479817 \tabularnewline
48 & 0.177009 & 1.6126 & 0.055311 \tabularnewline
\hline
\end{tabular}
%Source: https://freestatistics.org/blog/index.php?pk=79147&T=1

[TABLE]
[ROW][C]Autocorrelation Function[/C][/ROW]
[ROW][C]Time lag k[/C][C]ACF(k)[/C][C]T-STAT[/C][C]P-value[/C][/ROW]
[ROW][C]1[/C][C]-0.02409[/C][C]-0.2195[/C][C]0.413411[/C][/ROW]
[ROW][C]2[/C][C]0.059185[/C][C]0.5392[/C][C]0.295595[/C][/ROW]
[ROW][C]3[/C][C]0.223733[/C][C]2.0383[/C][C]0.022352[/C][/ROW]
[ROW][C]4[/C][C]-0.312817[/C][C]-2.8499[/C][C]0.002757[/C][/ROW]
[ROW][C]5[/C][C]-0.366456[/C][C]-3.3386[/C][C]0.000631[/C][/ROW]
[ROW][C]6[/C][C]0.063707[/C][C]0.5804[/C][C]0.281608[/C][/ROW]
[ROW][C]7[/C][C]-0.364446[/C][C]-3.3203[/C][C]0.000669[/C][/ROW]
[ROW][C]8[/C][C]-0.268948[/C][C]-2.4502[/C][C]0.008189[/C][/ROW]
[ROW][C]9[/C][C]0.209753[/C][C]1.9109[/C][C]0.029732[/C][/ROW]
[ROW][C]10[/C][C]0.035976[/C][C]0.3278[/C][C]0.371962[/C][/ROW]
[ROW][C]11[/C][C]-0.007849[/C][C]-0.0715[/C][C]0.471584[/C][/ROW]
[ROW][C]12[/C][C]0.722674[/C][C]6.5839[/C][C]0[/C][/ROW]
[ROW][C]13[/C][C]0.017335[/C][C]0.1579[/C][C]0.43745[/C][/ROW]
[ROW][C]14[/C][C]0.061989[/C][C]0.5648[/C][C]0.286883[/C][/ROW]
[ROW][C]15[/C][C]0.108428[/C][C]0.9878[/C][C]0.163055[/C][/ROW]
[ROW][C]16[/C][C]-0.253367[/C][C]-2.3083[/C][C]0.011736[/C][/ROW]
[ROW][C]17[/C][C]-0.355572[/C][C]-3.2394[/C][C]0.000862[/C][/ROW]
[ROW][C]18[/C][C]0.0018[/C][C]0.0164[/C][C]0.493479[/C][/ROW]
[ROW][C]19[/C][C]-0.300164[/C][C]-2.7346[/C][C]0.003817[/C][/ROW]
[ROW][C]20[/C][C]-0.187423[/C][C]-1.7075[/C][C]0.045733[/C][/ROW]
[ROW][C]21[/C][C]0.131829[/C][C]1.201[/C][C]0.11658[/C][/ROW]
[ROW][C]22[/C][C]0.081178[/C][C]0.7396[/C][C]0.230825[/C][/ROW]
[ROW][C]23[/C][C]0.017634[/C][C]0.1607[/C][C]0.436379[/C][/ROW]
[ROW][C]24[/C][C]0.478955[/C][C]4.3635[/C][C]1.8e-05[/C][/ROW]
[ROW][C]25[/C][C]0.031268[/C][C]0.2849[/C][C]0.38823[/C][/ROW]
[ROW][C]26[/C][C]0.037764[/C][C]0.344[/C][C]0.36584[/C][/ROW]
[ROW][C]27[/C][C]0.03234[/C][C]0.2946[/C][C]0.384506[/C][/ROW]
[ROW][C]28[/C][C]-0.173187[/C][C]-1.5778[/C][C]0.059206[/C][/ROW]
[ROW][C]29[/C][C]-0.279046[/C][C]-2.5422[/C][C]0.006436[/C][/ROW]
[ROW][C]30[/C][C]-0.035201[/C][C]-0.3207[/C][C]0.374624[/C][/ROW]
[ROW][C]31[/C][C]-0.198042[/C][C]-1.8042[/C][C]0.03741[/C][/ROW]
[ROW][C]32[/C][C]-0.09409[/C][C]-0.8572[/C][C]0.196901[/C][/ROW]
[ROW][C]33[/C][C]0.087795[/C][C]0.7999[/C][C]0.21304[/C][/ROW]
[ROW][C]34[/C][C]0.095594[/C][C]0.8709[/C][C]0.193159[/C][/ROW]
[ROW][C]35[/C][C]0.016653[/C][C]0.1517[/C][C]0.439888[/C][/ROW]
[ROW][C]36[/C][C]0.307961[/C][C]2.8057[/C][C]0.003127[/C][/ROW]
[ROW][C]37[/C][C]0.044507[/C][C]0.4055[/C][C]0.343086[/C][/ROW]
[ROW][C]38[/C][C]0.068617[/C][C]0.6251[/C][C]0.2668[/C][/ROW]
[ROW][C]39[/C][C]-0.033538[/C][C]-0.3055[/C][C]0.380357[/C][/ROW]
[ROW][C]40[/C][C]-0.114954[/C][C]-1.0473[/C][C]0.149004[/C][/ROW]
[ROW][C]41[/C][C]-0.12724[/C][C]-1.1592[/C][C]0.124847[/C][/ROW]
[ROW][C]42[/C][C]-0.076485[/C][C]-0.6968[/C][C]0.243933[/C][/ROW]
[ROW][C]43[/C][C]-0.054467[/C][C]-0.4962[/C][C]0.310527[/C][/ROW]
[ROW][C]44[/C][C]-0.025647[/C][C]-0.2337[/C][C]0.407913[/C][/ROW]
[ROW][C]45[/C][C]0.033118[/C][C]0.3017[/C][C]0.381811[/C][/ROW]
[ROW][C]46[/C][C]0.082475[/C][C]0.7514[/C][C]0.227275[/C][/ROW]
[ROW][C]47[/C][C]0.005572[/C][C]0.0508[/C][C]0.479817[/C][/ROW]
[ROW][C]48[/C][C]0.177009[/C][C]1.6126[/C][C]0.055311[/C][/ROW]
[/TABLE]
Source: https://freestatistics.org/blog/index.php?pk=79147&T=1

Globally Unique Identifier (entire table): ba.freestatistics.org/blog/index.php?pk=79147&T=1

As an alternative you can also use a QR Code:  

The GUIDs for individual cells are displayed in the table below:

Autocorrelation Function
Time lag kACF(k)T-STATP-value
1-0.02409-0.21950.413411
20.0591850.53920.295595
30.2237332.03830.022352
4-0.312817-2.84990.002757
5-0.366456-3.33860.000631
60.0637070.58040.281608
7-0.364446-3.32030.000669
8-0.268948-2.45020.008189
90.2097531.91090.029732
100.0359760.32780.371962
11-0.007849-0.07150.471584
120.7226746.58390
130.0173350.15790.43745
140.0619890.56480.286883
150.1084280.98780.163055
16-0.253367-2.30830.011736
17-0.355572-3.23940.000862
180.00180.01640.493479
19-0.300164-2.73460.003817
20-0.187423-1.70750.045733
210.1318291.2010.11658
220.0811780.73960.230825
230.0176340.16070.436379
240.4789554.36351.8e-05
250.0312680.28490.38823
260.0377640.3440.36584
270.032340.29460.384506
28-0.173187-1.57780.059206
29-0.279046-2.54220.006436
30-0.035201-0.32070.374624
31-0.198042-1.80420.03741
32-0.09409-0.85720.196901
330.0877950.79990.21304
340.0955940.87090.193159
350.0166530.15170.439888
360.3079612.80570.003127
370.0445070.40550.343086
380.0686170.62510.2668
39-0.033538-0.30550.380357
40-0.114954-1.04730.149004
41-0.12724-1.15920.124847
42-0.076485-0.69680.243933
43-0.054467-0.49620.310527
44-0.025647-0.23370.407913
450.0331180.30170.381811
460.0824750.75140.227275
470.0055720.05080.479817
480.1770091.61260.055311


Partial Autocorrelation Function
Time lag kPACF(k)T-STATP-value
1-0.02409-0.21950.413411
20.0586390.53420.297307
30.2274012.07170.020698
4-0.320873-2.92330.002231
5-0.465341-4.23952.9e-05
60.0452110.41190.340739
7-0.168458-1.53470.064327
8-0.360894-3.28790.000741
9-0.078532-0.71550.238167
100.1593951.45220.075114
11-0.116713-1.06330.145364
120.4892884.45761.3e-05
130.0690450.6290.265527
140.0448930.4090.341798
15-0.277734-2.53030.006643
16-0.018567-0.16920.433042
17-0.001526-0.01390.494472
18-0.052986-0.48270.315281
19-0.079178-0.72140.236361
200.0452810.41250.340506
21-0.082467-0.75130.227296
22-0.008485-0.07730.469283
23-0.060375-0.550.291884
24-0.108512-0.98860.162869
25-0.14292-1.30210.098248
26-0.106832-0.97330.16662
27-0.02553-0.23260.408325
28-0.009928-0.09040.464074
290.0264250.24070.405172
30-0.041967-0.38230.351594
31-0.012512-0.1140.45476
32-0.011296-0.10290.459141
33-0.015242-0.13890.44495
34-0.124777-1.13680.129452
35-0.142944-1.30230.09821
36-0.088972-0.81060.209965
370.0158160.14410.442888
380.0940190.85660.19708
39-0.081561-0.74310.229772
40-0.125411-1.14260.128255
410.1379251.25660.106219
42-0.029216-0.26620.395385
430.07020.63960.262113
44-0.098161-0.89430.186877
45-0.008381-0.07640.469661
46-0.107299-0.97750.16557
47-0.065405-0.59590.276442
480.0853370.77750.21955

\begin{tabular}{lllllllll}
\hline
Partial Autocorrelation Function \tabularnewline
Time lag k & PACF(k) & T-STAT & P-value \tabularnewline
1 & -0.02409 & -0.2195 & 0.413411 \tabularnewline
2 & 0.058639 & 0.5342 & 0.297307 \tabularnewline
3 & 0.227401 & 2.0717 & 0.020698 \tabularnewline
4 & -0.320873 & -2.9233 & 0.002231 \tabularnewline
5 & -0.465341 & -4.2395 & 2.9e-05 \tabularnewline
6 & 0.045211 & 0.4119 & 0.340739 \tabularnewline
7 & -0.168458 & -1.5347 & 0.064327 \tabularnewline
8 & -0.360894 & -3.2879 & 0.000741 \tabularnewline
9 & -0.078532 & -0.7155 & 0.238167 \tabularnewline
10 & 0.159395 & 1.4522 & 0.075114 \tabularnewline
11 & -0.116713 & -1.0633 & 0.145364 \tabularnewline
12 & 0.489288 & 4.4576 & 1.3e-05 \tabularnewline
13 & 0.069045 & 0.629 & 0.265527 \tabularnewline
14 & 0.044893 & 0.409 & 0.341798 \tabularnewline
15 & -0.277734 & -2.5303 & 0.006643 \tabularnewline
16 & -0.018567 & -0.1692 & 0.433042 \tabularnewline
17 & -0.001526 & -0.0139 & 0.494472 \tabularnewline
18 & -0.052986 & -0.4827 & 0.315281 \tabularnewline
19 & -0.079178 & -0.7214 & 0.236361 \tabularnewline
20 & 0.045281 & 0.4125 & 0.340506 \tabularnewline
21 & -0.082467 & -0.7513 & 0.227296 \tabularnewline
22 & -0.008485 & -0.0773 & 0.469283 \tabularnewline
23 & -0.060375 & -0.55 & 0.291884 \tabularnewline
24 & -0.108512 & -0.9886 & 0.162869 \tabularnewline
25 & -0.14292 & -1.3021 & 0.098248 \tabularnewline
26 & -0.106832 & -0.9733 & 0.16662 \tabularnewline
27 & -0.02553 & -0.2326 & 0.408325 \tabularnewline
28 & -0.009928 & -0.0904 & 0.464074 \tabularnewline
29 & 0.026425 & 0.2407 & 0.405172 \tabularnewline
30 & -0.041967 & -0.3823 & 0.351594 \tabularnewline
31 & -0.012512 & -0.114 & 0.45476 \tabularnewline
32 & -0.011296 & -0.1029 & 0.459141 \tabularnewline
33 & -0.015242 & -0.1389 & 0.44495 \tabularnewline
34 & -0.124777 & -1.1368 & 0.129452 \tabularnewline
35 & -0.142944 & -1.3023 & 0.09821 \tabularnewline
36 & -0.088972 & -0.8106 & 0.209965 \tabularnewline
37 & 0.015816 & 0.1441 & 0.442888 \tabularnewline
38 & 0.094019 & 0.8566 & 0.19708 \tabularnewline
39 & -0.081561 & -0.7431 & 0.229772 \tabularnewline
40 & -0.125411 & -1.1426 & 0.128255 \tabularnewline
41 & 0.137925 & 1.2566 & 0.106219 \tabularnewline
42 & -0.029216 & -0.2662 & 0.395385 \tabularnewline
43 & 0.0702 & 0.6396 & 0.262113 \tabularnewline
44 & -0.098161 & -0.8943 & 0.186877 \tabularnewline
45 & -0.008381 & -0.0764 & 0.469661 \tabularnewline
46 & -0.107299 & -0.9775 & 0.16557 \tabularnewline
47 & -0.065405 & -0.5959 & 0.276442 \tabularnewline
48 & 0.085337 & 0.7775 & 0.21955 \tabularnewline
\hline
\end{tabular}
%Source: https://freestatistics.org/blog/index.php?pk=79147&T=2

[TABLE]
[ROW][C]Partial Autocorrelation Function[/C][/ROW]
[ROW][C]Time lag k[/C][C]PACF(k)[/C][C]T-STAT[/C][C]P-value[/C][/ROW]
[ROW][C]1[/C][C]-0.02409[/C][C]-0.2195[/C][C]0.413411[/C][/ROW]
[ROW][C]2[/C][C]0.058639[/C][C]0.5342[/C][C]0.297307[/C][/ROW]
[ROW][C]3[/C][C]0.227401[/C][C]2.0717[/C][C]0.020698[/C][/ROW]
[ROW][C]4[/C][C]-0.320873[/C][C]-2.9233[/C][C]0.002231[/C][/ROW]
[ROW][C]5[/C][C]-0.465341[/C][C]-4.2395[/C][C]2.9e-05[/C][/ROW]
[ROW][C]6[/C][C]0.045211[/C][C]0.4119[/C][C]0.340739[/C][/ROW]
[ROW][C]7[/C][C]-0.168458[/C][C]-1.5347[/C][C]0.064327[/C][/ROW]
[ROW][C]8[/C][C]-0.360894[/C][C]-3.2879[/C][C]0.000741[/C][/ROW]
[ROW][C]9[/C][C]-0.078532[/C][C]-0.7155[/C][C]0.238167[/C][/ROW]
[ROW][C]10[/C][C]0.159395[/C][C]1.4522[/C][C]0.075114[/C][/ROW]
[ROW][C]11[/C][C]-0.116713[/C][C]-1.0633[/C][C]0.145364[/C][/ROW]
[ROW][C]12[/C][C]0.489288[/C][C]4.4576[/C][C]1.3e-05[/C][/ROW]
[ROW][C]13[/C][C]0.069045[/C][C]0.629[/C][C]0.265527[/C][/ROW]
[ROW][C]14[/C][C]0.044893[/C][C]0.409[/C][C]0.341798[/C][/ROW]
[ROW][C]15[/C][C]-0.277734[/C][C]-2.5303[/C][C]0.006643[/C][/ROW]
[ROW][C]16[/C][C]-0.018567[/C][C]-0.1692[/C][C]0.433042[/C][/ROW]
[ROW][C]17[/C][C]-0.001526[/C][C]-0.0139[/C][C]0.494472[/C][/ROW]
[ROW][C]18[/C][C]-0.052986[/C][C]-0.4827[/C][C]0.315281[/C][/ROW]
[ROW][C]19[/C][C]-0.079178[/C][C]-0.7214[/C][C]0.236361[/C][/ROW]
[ROW][C]20[/C][C]0.045281[/C][C]0.4125[/C][C]0.340506[/C][/ROW]
[ROW][C]21[/C][C]-0.082467[/C][C]-0.7513[/C][C]0.227296[/C][/ROW]
[ROW][C]22[/C][C]-0.008485[/C][C]-0.0773[/C][C]0.469283[/C][/ROW]
[ROW][C]23[/C][C]-0.060375[/C][C]-0.55[/C][C]0.291884[/C][/ROW]
[ROW][C]24[/C][C]-0.108512[/C][C]-0.9886[/C][C]0.162869[/C][/ROW]
[ROW][C]25[/C][C]-0.14292[/C][C]-1.3021[/C][C]0.098248[/C][/ROW]
[ROW][C]26[/C][C]-0.106832[/C][C]-0.9733[/C][C]0.16662[/C][/ROW]
[ROW][C]27[/C][C]-0.02553[/C][C]-0.2326[/C][C]0.408325[/C][/ROW]
[ROW][C]28[/C][C]-0.009928[/C][C]-0.0904[/C][C]0.464074[/C][/ROW]
[ROW][C]29[/C][C]0.026425[/C][C]0.2407[/C][C]0.405172[/C][/ROW]
[ROW][C]30[/C][C]-0.041967[/C][C]-0.3823[/C][C]0.351594[/C][/ROW]
[ROW][C]31[/C][C]-0.012512[/C][C]-0.114[/C][C]0.45476[/C][/ROW]
[ROW][C]32[/C][C]-0.011296[/C][C]-0.1029[/C][C]0.459141[/C][/ROW]
[ROW][C]33[/C][C]-0.015242[/C][C]-0.1389[/C][C]0.44495[/C][/ROW]
[ROW][C]34[/C][C]-0.124777[/C][C]-1.1368[/C][C]0.129452[/C][/ROW]
[ROW][C]35[/C][C]-0.142944[/C][C]-1.3023[/C][C]0.09821[/C][/ROW]
[ROW][C]36[/C][C]-0.088972[/C][C]-0.8106[/C][C]0.209965[/C][/ROW]
[ROW][C]37[/C][C]0.015816[/C][C]0.1441[/C][C]0.442888[/C][/ROW]
[ROW][C]38[/C][C]0.094019[/C][C]0.8566[/C][C]0.19708[/C][/ROW]
[ROW][C]39[/C][C]-0.081561[/C][C]-0.7431[/C][C]0.229772[/C][/ROW]
[ROW][C]40[/C][C]-0.125411[/C][C]-1.1426[/C][C]0.128255[/C][/ROW]
[ROW][C]41[/C][C]0.137925[/C][C]1.2566[/C][C]0.106219[/C][/ROW]
[ROW][C]42[/C][C]-0.029216[/C][C]-0.2662[/C][C]0.395385[/C][/ROW]
[ROW][C]43[/C][C]0.0702[/C][C]0.6396[/C][C]0.262113[/C][/ROW]
[ROW][C]44[/C][C]-0.098161[/C][C]-0.8943[/C][C]0.186877[/C][/ROW]
[ROW][C]45[/C][C]-0.008381[/C][C]-0.0764[/C][C]0.469661[/C][/ROW]
[ROW][C]46[/C][C]-0.107299[/C][C]-0.9775[/C][C]0.16557[/C][/ROW]
[ROW][C]47[/C][C]-0.065405[/C][C]-0.5959[/C][C]0.276442[/C][/ROW]
[ROW][C]48[/C][C]0.085337[/C][C]0.7775[/C][C]0.21955[/C][/ROW]
[/TABLE]
Source: https://freestatistics.org/blog/index.php?pk=79147&T=2

Globally Unique Identifier (entire table): ba.freestatistics.org/blog/index.php?pk=79147&T=2

As an alternative you can also use a QR Code:  

The GUIDs for individual cells are displayed in the table below:

Partial Autocorrelation Function
Time lag kPACF(k)T-STATP-value
1-0.02409-0.21950.413411
20.0586390.53420.297307
30.2274012.07170.020698
4-0.320873-2.92330.002231
5-0.465341-4.23952.9e-05
60.0452110.41190.340739
7-0.168458-1.53470.064327
8-0.360894-3.28790.000741
9-0.078532-0.71550.238167
100.1593951.45220.075114
11-0.116713-1.06330.145364
120.4892884.45761.3e-05
130.0690450.6290.265527
140.0448930.4090.341798
15-0.277734-2.53030.006643
16-0.018567-0.16920.433042
17-0.001526-0.01390.494472
18-0.052986-0.48270.315281
19-0.079178-0.72140.236361
200.0452810.41250.340506
21-0.082467-0.75130.227296
22-0.008485-0.07730.469283
23-0.060375-0.550.291884
24-0.108512-0.98860.162869
25-0.14292-1.30210.098248
26-0.106832-0.97330.16662
27-0.02553-0.23260.408325
28-0.009928-0.09040.464074
290.0264250.24070.405172
30-0.041967-0.38230.351594
31-0.012512-0.1140.45476
32-0.011296-0.10290.459141
33-0.015242-0.13890.44495
34-0.124777-1.13680.129452
35-0.142944-1.30230.09821
36-0.088972-0.81060.209965
370.0158160.14410.442888
380.0940190.85660.19708
39-0.081561-0.74310.229772
40-0.125411-1.14260.128255
410.1379251.25660.106219
42-0.029216-0.26620.395385
430.07020.63960.262113
44-0.098161-0.89430.186877
45-0.008381-0.07640.469661
46-0.107299-0.97750.16557
47-0.065405-0.59590.276442
480.0853370.77750.21955


Parameters (Session):
par1 = 48 ; par2 = 1 ; par3 = 1 ; par4 = 0 ; par5 = 12 ; par6 = White Noise ; par7 = 0.95 ;
Parameters (R input):
par1 = 48 ; par2 = 1 ; par3 = 1 ; par4 = 0 ; par5 = 12 ; par6 = White Noise ; par7 = 0.95 ;
R code (references can be found in the software module):
if (par1 == 'Default') {
par1 = 10*log10(length(x))
} else {
par1 <- as.numeric(par1)
}
par2 <- as.numeric(par2)
par3 <- as.numeric(par3)
par4 <- as.numeric(par4)
par5 <- as.numeric(par5)
if (par6 == 'White Noise') par6 <- 'white' else par6 <- 'ma'
par7 <- as.numeric(par7)
if (par2 == 0) {
x <- log(x)
} else {
x <- (x ^ par2 - 1) / par2
}
if (par3 > 0) x <- diff(x,lag=1,difference=par3)
if (par4 > 0) x <- diff(x,lag=par5,difference=par4)
bitmap(file='pic1.png')
racf <- acf(x, par1, main='Autocorrelation', xlab='time lag', ylab='ACF', ci.type=par6, ci=par7, sub=paste('(lambda=',par2,', d=',par3,', D=',par4,', CI=', par7, ', CI type=',par6,')',sep=''))
dev.off()
bitmap(file='pic2.png')
rpacf <- pacf(x,par1,main='Partial Autocorrelation',xlab='lags',ylab='PACF')
dev.off()
(myacf <- c(racf$acf))
(mypacf <- c(rpacf$acf))
lengthx <- length(x)
sqrtn <- sqrt(lengthx)
load(file='createtable')
a<-table.start()
a<-table.row.start(a)
a<-table.element(a,'Autocorrelation Function',4,TRUE)
a<-table.row.end(a)
a<-table.row.start(a)
a<-table.element(a,'Time lag k',header=TRUE)
a<-table.element(a,hyperlink('basics.htm','ACF(k)','click here for more information about the Autocorrelation Function'),header=TRUE)
a<-table.element(a,'T-STAT',header=TRUE)
a<-table.element(a,'P-value',header=TRUE)
a<-table.row.end(a)
for (i in 2:(par1+1)) {
a<-table.row.start(a)
a<-table.element(a,i-1,header=TRUE)
a<-table.element(a,round(myacf[i],6))
mytstat <- myacf[i]*sqrtn
a<-table.element(a,round(mytstat,4))
a<-table.element(a,round(1-pt(abs(mytstat),lengthx),6))
a<-table.row.end(a)
}
a<-table.end(a)
table.save(a,file='mytable.tab')
a<-table.start()
a<-table.row.start(a)
a<-table.element(a,'Partial Autocorrelation Function',4,TRUE)
a<-table.row.end(a)
a<-table.row.start(a)
a<-table.element(a,'Time lag k',header=TRUE)
a<-table.element(a,hyperlink('basics.htm','PACF(k)','click here for more information about the Partial Autocorrelation Function'),header=TRUE)
a<-table.element(a,'T-STAT',header=TRUE)
a<-table.element(a,'P-value',header=TRUE)
a<-table.row.end(a)
for (i in 1:par1) {
a<-table.row.start(a)
a<-table.element(a,i,header=TRUE)
a<-table.element(a,round(mypacf[i],6))
mytstat <- mypacf[i]*sqrtn
a<-table.element(a,round(mytstat,4))
a<-table.element(a,round(1-pt(abs(mytstat),lengthx),6))
a<-table.row.end(a)
}
a<-table.end(a)
table.save(a,file='mytable1.tab')