Free Statistics

of Irreproducible Research!

Author's title

Author*Unverified author*
R Software Modulerwasp_autocorrelation.wasp
Title produced by software(Partial) Autocorrelation Function
Date of computationFri, 12 Aug 2011 09:29:19 -0400
Cite this page as followsStatistical Computations at FreeStatistics.org, Office for Research Development and Education, URL https://freestatistics.org/blog/index.php?v=date/2011/Aug/12/t13131568693aadi63encgrgi5.htm/, Retrieved Sun, 10 Nov 2024 19:40:29 +0000
Statistical Computations at FreeStatistics.org, Office for Research Development and Education, URL https://freestatistics.org/blog/index.php?pk=123627, Retrieved Sun, 10 Nov 2024 19:40:29 +0000
QR Codes:

Original text written by user:
IsPrivate?No (this computation is public)
User-defined keywordsMorel Sarah
Estimated Impact184
Family? (F = Feedback message, R = changed R code, M = changed R Module, P = changed Parameters, D = changed Data)
-       [(Partial) Autocorrelation Function] [autocorrelatie om...] [2011-08-12 13:29:19] [d41d8cd98f00b204e9800998ecf8427e] [Current]
Feedback Forum

Post a new message
Dataseries X:
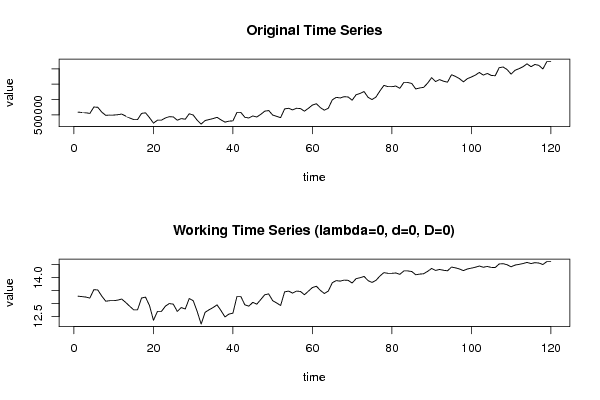
588264
577918
567562
546859
756344
745987
588264
483527
493873
493873
504229
526055
462824
399492
347630
347630
546859
567562
409838
231412
325803
325803
399492
442021
431664
325803
378790
357986
536412
493873
325803
200263
315447
347630
378790
420195
336150
263595
294755
305101
577918
577918
420195
399492
462824
431664
515709
620447
641250
493873
452367
409838
694135
714939
661953
714939
704481
620447
714939
819676
862205
735641
651596
714939
987746
1071790
1051088
1092483
1082137
977399
1155825
1198354
1260562
1071790
998102
1082137
1282389
1460814
1418286
1418286
1439089
1366423
1555307
1555307
1523124
1344597
1376780
1397583
1534503
1712929
1586355
1649698
1596712
1565653
1807421
1754435
1680746
1576009
1680746
1733732
1796963
1880998
1796963
1848826
1785585
1775239
2037699
2059525
1975491
1828123
1953664
2006549
2069882
2164273
2069882
2143570
2111388
1996193
2237951
2237951


Summary of computational transaction
Raw Inputview raw input (R code)
Raw Outputview raw output of R engine
Computing time1 seconds
R Server'Gwilym Jenkins' @ jenkins.wessa.net

\begin{tabular}{lllllllll}
\hline
Summary of computational transaction \tabularnewline
Raw Input & view raw input (R code)  \tabularnewline
Raw Output & view raw output of R engine  \tabularnewline
Computing time & 1 seconds \tabularnewline
R Server & 'Gwilym Jenkins' @ jenkins.wessa.net \tabularnewline
\hline
\end{tabular}
%Source: https://freestatistics.org/blog/index.php?pk=123627&T=0

[TABLE]
[ROW][C]Summary of computational transaction[/C][/ROW]
[ROW][C]Raw Input[/C][C]view raw input (R code) [/C][/ROW]
[ROW][C]Raw Output[/C][C]view raw output of R engine [/C][/ROW]
[ROW][C]Computing time[/C][C]1 seconds[/C][/ROW]
[ROW][C]R Server[/C][C]'Gwilym Jenkins' @ jenkins.wessa.net[/C][/ROW]
[/TABLE]
Source: https://freestatistics.org/blog/index.php?pk=123627&T=0

Globally Unique Identifier (entire table): ba.freestatistics.org/blog/index.php?pk=123627&T=0

As an alternative you can also use a QR Code:  

The GUIDs for individual cells are displayed in the table below:

Summary of computational transaction
Raw Inputview raw input (R code)
Raw Outputview raw output of R engine
Computing time1 seconds
R Server'Gwilym Jenkins' @ jenkins.wessa.net


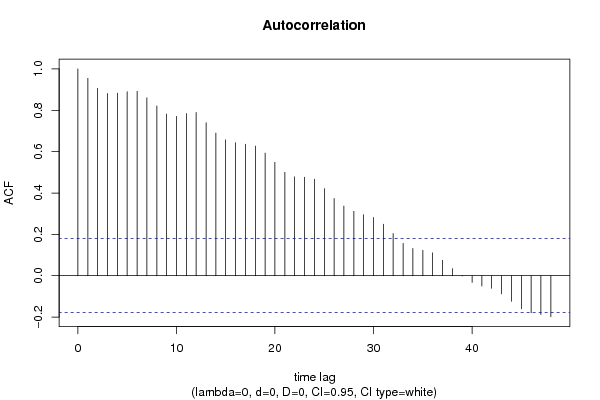
Autocorrelation Function
Time lag kACF(k)T-STATP-value
10.95462910.45740
20.9062429.92740
30.8814949.65630
40.8825399.66770
50.8895369.74440
60.8915699.76670
70.8601479.42240
80.8212298.99610
90.7816358.56240
100.7705218.44060
110.7838528.58670
120.7894788.64830
130.7401698.10810
140.6897267.55560
150.6569237.19620
160.6429717.04340
170.6359426.96640
180.6269796.86820
190.5929426.49530
200.5481036.00420
210.4998715.47580
220.4780225.23650
230.4759045.21330
240.4663295.10841e-06
250.4211074.6135e-06
260.3731734.08794e-05
270.3365193.68640.000171
280.3112773.40990.000443
290.2945063.22610.000809
300.2818563.08760.001253
310.248852.7260.003685
320.2037292.23170.013744
330.1562831.7120.04474
340.131421.43960.076288
350.1233641.35140.089558
360.110631.21190.113967
370.0745850.8170.207762
380.0342980.37570.353897
39-0.001217-0.01330.494695
40-0.03229-0.35370.362085
41-0.050013-0.54790.2924
42-0.061068-0.6690.252403
43-0.087738-0.96110.169211
44-0.123487-1.35270.089343
45-0.159823-1.75080.04127
46-0.179376-1.9650.025865
47-0.187254-2.05130.021209
48-0.197997-2.1690.016029

\begin{tabular}{lllllllll}
\hline
Autocorrelation Function \tabularnewline
Time lag k & ACF(k) & T-STAT & P-value \tabularnewline
1 & 0.954629 & 10.4574 & 0 \tabularnewline
2 & 0.906242 & 9.9274 & 0 \tabularnewline
3 & 0.881494 & 9.6563 & 0 \tabularnewline
4 & 0.882539 & 9.6677 & 0 \tabularnewline
5 & 0.889536 & 9.7444 & 0 \tabularnewline
6 & 0.891569 & 9.7667 & 0 \tabularnewline
7 & 0.860147 & 9.4224 & 0 \tabularnewline
8 & 0.821229 & 8.9961 & 0 \tabularnewline
9 & 0.781635 & 8.5624 & 0 \tabularnewline
10 & 0.770521 & 8.4406 & 0 \tabularnewline
11 & 0.783852 & 8.5867 & 0 \tabularnewline
12 & 0.789478 & 8.6483 & 0 \tabularnewline
13 & 0.740169 & 8.1081 & 0 \tabularnewline
14 & 0.689726 & 7.5556 & 0 \tabularnewline
15 & 0.656923 & 7.1962 & 0 \tabularnewline
16 & 0.642971 & 7.0434 & 0 \tabularnewline
17 & 0.635942 & 6.9664 & 0 \tabularnewline
18 & 0.626979 & 6.8682 & 0 \tabularnewline
19 & 0.592942 & 6.4953 & 0 \tabularnewline
20 & 0.548103 & 6.0042 & 0 \tabularnewline
21 & 0.499871 & 5.4758 & 0 \tabularnewline
22 & 0.478022 & 5.2365 & 0 \tabularnewline
23 & 0.475904 & 5.2133 & 0 \tabularnewline
24 & 0.466329 & 5.1084 & 1e-06 \tabularnewline
25 & 0.421107 & 4.613 & 5e-06 \tabularnewline
26 & 0.373173 & 4.0879 & 4e-05 \tabularnewline
27 & 0.336519 & 3.6864 & 0.000171 \tabularnewline
28 & 0.311277 & 3.4099 & 0.000443 \tabularnewline
29 & 0.294506 & 3.2261 & 0.000809 \tabularnewline
30 & 0.281856 & 3.0876 & 0.001253 \tabularnewline
31 & 0.24885 & 2.726 & 0.003685 \tabularnewline
32 & 0.203729 & 2.2317 & 0.013744 \tabularnewline
33 & 0.156283 & 1.712 & 0.04474 \tabularnewline
34 & 0.13142 & 1.4396 & 0.076288 \tabularnewline
35 & 0.123364 & 1.3514 & 0.089558 \tabularnewline
36 & 0.11063 & 1.2119 & 0.113967 \tabularnewline
37 & 0.074585 & 0.817 & 0.207762 \tabularnewline
38 & 0.034298 & 0.3757 & 0.353897 \tabularnewline
39 & -0.001217 & -0.0133 & 0.494695 \tabularnewline
40 & -0.03229 & -0.3537 & 0.362085 \tabularnewline
41 & -0.050013 & -0.5479 & 0.2924 \tabularnewline
42 & -0.061068 & -0.669 & 0.252403 \tabularnewline
43 & -0.087738 & -0.9611 & 0.169211 \tabularnewline
44 & -0.123487 & -1.3527 & 0.089343 \tabularnewline
45 & -0.159823 & -1.7508 & 0.04127 \tabularnewline
46 & -0.179376 & -1.965 & 0.025865 \tabularnewline
47 & -0.187254 & -2.0513 & 0.021209 \tabularnewline
48 & -0.197997 & -2.169 & 0.016029 \tabularnewline
\hline
\end{tabular}
%Source: https://freestatistics.org/blog/index.php?pk=123627&T=1

[TABLE]
[ROW][C]Autocorrelation Function[/C][/ROW]
[ROW][C]Time lag k[/C][C]ACF(k)[/C][C]T-STAT[/C][C]P-value[/C][/ROW]
[ROW][C]1[/C][C]0.954629[/C][C]10.4574[/C][C]0[/C][/ROW]
[ROW][C]2[/C][C]0.906242[/C][C]9.9274[/C][C]0[/C][/ROW]
[ROW][C]3[/C][C]0.881494[/C][C]9.6563[/C][C]0[/C][/ROW]
[ROW][C]4[/C][C]0.882539[/C][C]9.6677[/C][C]0[/C][/ROW]
[ROW][C]5[/C][C]0.889536[/C][C]9.7444[/C][C]0[/C][/ROW]
[ROW][C]6[/C][C]0.891569[/C][C]9.7667[/C][C]0[/C][/ROW]
[ROW][C]7[/C][C]0.860147[/C][C]9.4224[/C][C]0[/C][/ROW]
[ROW][C]8[/C][C]0.821229[/C][C]8.9961[/C][C]0[/C][/ROW]
[ROW][C]9[/C][C]0.781635[/C][C]8.5624[/C][C]0[/C][/ROW]
[ROW][C]10[/C][C]0.770521[/C][C]8.4406[/C][C]0[/C][/ROW]
[ROW][C]11[/C][C]0.783852[/C][C]8.5867[/C][C]0[/C][/ROW]
[ROW][C]12[/C][C]0.789478[/C][C]8.6483[/C][C]0[/C][/ROW]
[ROW][C]13[/C][C]0.740169[/C][C]8.1081[/C][C]0[/C][/ROW]
[ROW][C]14[/C][C]0.689726[/C][C]7.5556[/C][C]0[/C][/ROW]
[ROW][C]15[/C][C]0.656923[/C][C]7.1962[/C][C]0[/C][/ROW]
[ROW][C]16[/C][C]0.642971[/C][C]7.0434[/C][C]0[/C][/ROW]
[ROW][C]17[/C][C]0.635942[/C][C]6.9664[/C][C]0[/C][/ROW]
[ROW][C]18[/C][C]0.626979[/C][C]6.8682[/C][C]0[/C][/ROW]
[ROW][C]19[/C][C]0.592942[/C][C]6.4953[/C][C]0[/C][/ROW]
[ROW][C]20[/C][C]0.548103[/C][C]6.0042[/C][C]0[/C][/ROW]
[ROW][C]21[/C][C]0.499871[/C][C]5.4758[/C][C]0[/C][/ROW]
[ROW][C]22[/C][C]0.478022[/C][C]5.2365[/C][C]0[/C][/ROW]
[ROW][C]23[/C][C]0.475904[/C][C]5.2133[/C][C]0[/C][/ROW]
[ROW][C]24[/C][C]0.466329[/C][C]5.1084[/C][C]1e-06[/C][/ROW]
[ROW][C]25[/C][C]0.421107[/C][C]4.613[/C][C]5e-06[/C][/ROW]
[ROW][C]26[/C][C]0.373173[/C][C]4.0879[/C][C]4e-05[/C][/ROW]
[ROW][C]27[/C][C]0.336519[/C][C]3.6864[/C][C]0.000171[/C][/ROW]
[ROW][C]28[/C][C]0.311277[/C][C]3.4099[/C][C]0.000443[/C][/ROW]
[ROW][C]29[/C][C]0.294506[/C][C]3.2261[/C][C]0.000809[/C][/ROW]
[ROW][C]30[/C][C]0.281856[/C][C]3.0876[/C][C]0.001253[/C][/ROW]
[ROW][C]31[/C][C]0.24885[/C][C]2.726[/C][C]0.003685[/C][/ROW]
[ROW][C]32[/C][C]0.203729[/C][C]2.2317[/C][C]0.013744[/C][/ROW]
[ROW][C]33[/C][C]0.156283[/C][C]1.712[/C][C]0.04474[/C][/ROW]
[ROW][C]34[/C][C]0.13142[/C][C]1.4396[/C][C]0.076288[/C][/ROW]
[ROW][C]35[/C][C]0.123364[/C][C]1.3514[/C][C]0.089558[/C][/ROW]
[ROW][C]36[/C][C]0.11063[/C][C]1.2119[/C][C]0.113967[/C][/ROW]
[ROW][C]37[/C][C]0.074585[/C][C]0.817[/C][C]0.207762[/C][/ROW]
[ROW][C]38[/C][C]0.034298[/C][C]0.3757[/C][C]0.353897[/C][/ROW]
[ROW][C]39[/C][C]-0.001217[/C][C]-0.0133[/C][C]0.494695[/C][/ROW]
[ROW][C]40[/C][C]-0.03229[/C][C]-0.3537[/C][C]0.362085[/C][/ROW]
[ROW][C]41[/C][C]-0.050013[/C][C]-0.5479[/C][C]0.2924[/C][/ROW]
[ROW][C]42[/C][C]-0.061068[/C][C]-0.669[/C][C]0.252403[/C][/ROW]
[ROW][C]43[/C][C]-0.087738[/C][C]-0.9611[/C][C]0.169211[/C][/ROW]
[ROW][C]44[/C][C]-0.123487[/C][C]-1.3527[/C][C]0.089343[/C][/ROW]
[ROW][C]45[/C][C]-0.159823[/C][C]-1.7508[/C][C]0.04127[/C][/ROW]
[ROW][C]46[/C][C]-0.179376[/C][C]-1.965[/C][C]0.025865[/C][/ROW]
[ROW][C]47[/C][C]-0.187254[/C][C]-2.0513[/C][C]0.021209[/C][/ROW]
[ROW][C]48[/C][C]-0.197997[/C][C]-2.169[/C][C]0.016029[/C][/ROW]
[/TABLE]
Source: https://freestatistics.org/blog/index.php?pk=123627&T=1

Globally Unique Identifier (entire table): ba.freestatistics.org/blog/index.php?pk=123627&T=1

As an alternative you can also use a QR Code:  

The GUIDs for individual cells are displayed in the table below:

Autocorrelation Function
Time lag kACF(k)T-STATP-value
10.95462910.45740
20.9062429.92740
30.8814949.65630
40.8825399.66770
50.8895369.74440
60.8915699.76670
70.8601479.42240
80.8212298.99610
90.7816358.56240
100.7705218.44060
110.7838528.58670
120.7894788.64830
130.7401698.10810
140.6897267.55560
150.6569237.19620
160.6429717.04340
170.6359426.96640
180.6269796.86820
190.5929426.49530
200.5481036.00420
210.4998715.47580
220.4780225.23650
230.4759045.21330
240.4663295.10841e-06
250.4211074.6135e-06
260.3731734.08794e-05
270.3365193.68640.000171
280.3112773.40990.000443
290.2945063.22610.000809
300.2818563.08760.001253
310.248852.7260.003685
320.2037292.23170.013744
330.1562831.7120.04474
340.131421.43960.076288
350.1233641.35140.089558
360.110631.21190.113967
370.0745850.8170.207762
380.0342980.37570.353897
39-0.001217-0.01330.494695
40-0.03229-0.35370.362085
41-0.050013-0.54790.2924
42-0.061068-0.6690.252403
43-0.087738-0.96110.169211
44-0.123487-1.35270.089343
45-0.159823-1.75080.04127
46-0.179376-1.9650.025865
47-0.187254-2.05130.021209
48-0.197997-2.1690.016029


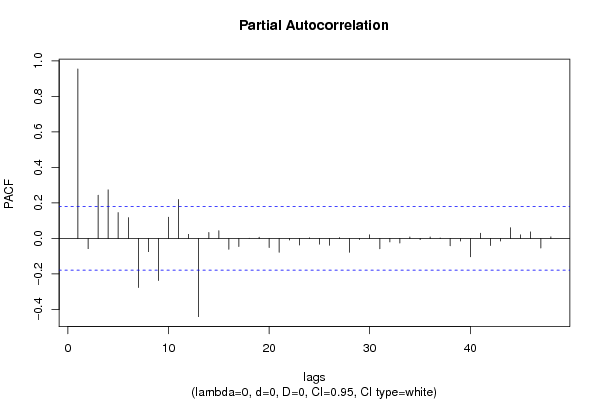
Partial Autocorrelation Function
Time lag kPACF(k)T-STATP-value
10.95462910.45740
2-0.057233-0.6270.265941
30.2431392.66350.004398
40.2736072.99720.001656
50.1454181.5930.056898
60.1172211.28410.100792
7-0.276408-3.02790.001508
8-0.07425-0.81340.208809
9-0.236704-2.5930.005349
100.1195451.30960.096425
110.2196442.40610.008825
120.0230970.2530.400347
13-0.440289-4.82312e-06
140.0335520.36750.35693
150.0438720.48060.315839
16-0.060549-0.66330.254211
17-0.044873-0.49160.311966
180.0004270.00470.498137
190.0068540.07510.470136
20-0.051061-0.55930.288485
21-0.078049-0.8550.197132
22-0.008934-0.09790.4611
23-0.036655-0.40150.344372
240.0033240.03640.485506
25-0.032011-0.35070.363229
26-0.03783-0.41440.339657
270.004870.05330.478773
28-0.077599-0.85010.198494
29-0.006141-0.06730.47324
300.0204510.2240.411558
31-0.058166-0.63720.26261
32-0.019195-0.21030.416907
33-0.025679-0.28130.389481
340.0081170.08890.464646
35-0.006417-0.07030.472036
360.0081050.08880.4647
370.0030320.03320.486779
38-0.041409-0.45360.325464
39-0.014608-0.160.436565
40-0.103202-1.13050.130256
410.0292180.32010.374738
42-0.040008-0.43830.33099
43-0.014788-0.1620.435789
440.0600180.65750.256071
450.0203920.22340.411807
460.0369670.4050.343116
47-0.05369-0.58810.278771
480.008940.09790.461072

\begin{tabular}{lllllllll}
\hline
Partial Autocorrelation Function \tabularnewline
Time lag k & PACF(k) & T-STAT & P-value \tabularnewline
1 & 0.954629 & 10.4574 & 0 \tabularnewline
2 & -0.057233 & -0.627 & 0.265941 \tabularnewline
3 & 0.243139 & 2.6635 & 0.004398 \tabularnewline
4 & 0.273607 & 2.9972 & 0.001656 \tabularnewline
5 & 0.145418 & 1.593 & 0.056898 \tabularnewline
6 & 0.117221 & 1.2841 & 0.100792 \tabularnewline
7 & -0.276408 & -3.0279 & 0.001508 \tabularnewline
8 & -0.07425 & -0.8134 & 0.208809 \tabularnewline
9 & -0.236704 & -2.593 & 0.005349 \tabularnewline
10 & 0.119545 & 1.3096 & 0.096425 \tabularnewline
11 & 0.219644 & 2.4061 & 0.008825 \tabularnewline
12 & 0.023097 & 0.253 & 0.400347 \tabularnewline
13 & -0.440289 & -4.8231 & 2e-06 \tabularnewline
14 & 0.033552 & 0.3675 & 0.35693 \tabularnewline
15 & 0.043872 & 0.4806 & 0.315839 \tabularnewline
16 & -0.060549 & -0.6633 & 0.254211 \tabularnewline
17 & -0.044873 & -0.4916 & 0.311966 \tabularnewline
18 & 0.000427 & 0.0047 & 0.498137 \tabularnewline
19 & 0.006854 & 0.0751 & 0.470136 \tabularnewline
20 & -0.051061 & -0.5593 & 0.288485 \tabularnewline
21 & -0.078049 & -0.855 & 0.197132 \tabularnewline
22 & -0.008934 & -0.0979 & 0.4611 \tabularnewline
23 & -0.036655 & -0.4015 & 0.344372 \tabularnewline
24 & 0.003324 & 0.0364 & 0.485506 \tabularnewline
25 & -0.032011 & -0.3507 & 0.363229 \tabularnewline
26 & -0.03783 & -0.4144 & 0.339657 \tabularnewline
27 & 0.00487 & 0.0533 & 0.478773 \tabularnewline
28 & -0.077599 & -0.8501 & 0.198494 \tabularnewline
29 & -0.006141 & -0.0673 & 0.47324 \tabularnewline
30 & 0.020451 & 0.224 & 0.411558 \tabularnewline
31 & -0.058166 & -0.6372 & 0.26261 \tabularnewline
32 & -0.019195 & -0.2103 & 0.416907 \tabularnewline
33 & -0.025679 & -0.2813 & 0.389481 \tabularnewline
34 & 0.008117 & 0.0889 & 0.464646 \tabularnewline
35 & -0.006417 & -0.0703 & 0.472036 \tabularnewline
36 & 0.008105 & 0.0888 & 0.4647 \tabularnewline
37 & 0.003032 & 0.0332 & 0.486779 \tabularnewline
38 & -0.041409 & -0.4536 & 0.325464 \tabularnewline
39 & -0.014608 & -0.16 & 0.436565 \tabularnewline
40 & -0.103202 & -1.1305 & 0.130256 \tabularnewline
41 & 0.029218 & 0.3201 & 0.374738 \tabularnewline
42 & -0.040008 & -0.4383 & 0.33099 \tabularnewline
43 & -0.014788 & -0.162 & 0.435789 \tabularnewline
44 & 0.060018 & 0.6575 & 0.256071 \tabularnewline
45 & 0.020392 & 0.2234 & 0.411807 \tabularnewline
46 & 0.036967 & 0.405 & 0.343116 \tabularnewline
47 & -0.05369 & -0.5881 & 0.278771 \tabularnewline
48 & 0.00894 & 0.0979 & 0.461072 \tabularnewline
\hline
\end{tabular}
%Source: https://freestatistics.org/blog/index.php?pk=123627&T=2

[TABLE]
[ROW][C]Partial Autocorrelation Function[/C][/ROW]
[ROW][C]Time lag k[/C][C]PACF(k)[/C][C]T-STAT[/C][C]P-value[/C][/ROW]
[ROW][C]1[/C][C]0.954629[/C][C]10.4574[/C][C]0[/C][/ROW]
[ROW][C]2[/C][C]-0.057233[/C][C]-0.627[/C][C]0.265941[/C][/ROW]
[ROW][C]3[/C][C]0.243139[/C][C]2.6635[/C][C]0.004398[/C][/ROW]
[ROW][C]4[/C][C]0.273607[/C][C]2.9972[/C][C]0.001656[/C][/ROW]
[ROW][C]5[/C][C]0.145418[/C][C]1.593[/C][C]0.056898[/C][/ROW]
[ROW][C]6[/C][C]0.117221[/C][C]1.2841[/C][C]0.100792[/C][/ROW]
[ROW][C]7[/C][C]-0.276408[/C][C]-3.0279[/C][C]0.001508[/C][/ROW]
[ROW][C]8[/C][C]-0.07425[/C][C]-0.8134[/C][C]0.208809[/C][/ROW]
[ROW][C]9[/C][C]-0.236704[/C][C]-2.593[/C][C]0.005349[/C][/ROW]
[ROW][C]10[/C][C]0.119545[/C][C]1.3096[/C][C]0.096425[/C][/ROW]
[ROW][C]11[/C][C]0.219644[/C][C]2.4061[/C][C]0.008825[/C][/ROW]
[ROW][C]12[/C][C]0.023097[/C][C]0.253[/C][C]0.400347[/C][/ROW]
[ROW][C]13[/C][C]-0.440289[/C][C]-4.8231[/C][C]2e-06[/C][/ROW]
[ROW][C]14[/C][C]0.033552[/C][C]0.3675[/C][C]0.35693[/C][/ROW]
[ROW][C]15[/C][C]0.043872[/C][C]0.4806[/C][C]0.315839[/C][/ROW]
[ROW][C]16[/C][C]-0.060549[/C][C]-0.6633[/C][C]0.254211[/C][/ROW]
[ROW][C]17[/C][C]-0.044873[/C][C]-0.4916[/C][C]0.311966[/C][/ROW]
[ROW][C]18[/C][C]0.000427[/C][C]0.0047[/C][C]0.498137[/C][/ROW]
[ROW][C]19[/C][C]0.006854[/C][C]0.0751[/C][C]0.470136[/C][/ROW]
[ROW][C]20[/C][C]-0.051061[/C][C]-0.5593[/C][C]0.288485[/C][/ROW]
[ROW][C]21[/C][C]-0.078049[/C][C]-0.855[/C][C]0.197132[/C][/ROW]
[ROW][C]22[/C][C]-0.008934[/C][C]-0.0979[/C][C]0.4611[/C][/ROW]
[ROW][C]23[/C][C]-0.036655[/C][C]-0.4015[/C][C]0.344372[/C][/ROW]
[ROW][C]24[/C][C]0.003324[/C][C]0.0364[/C][C]0.485506[/C][/ROW]
[ROW][C]25[/C][C]-0.032011[/C][C]-0.3507[/C][C]0.363229[/C][/ROW]
[ROW][C]26[/C][C]-0.03783[/C][C]-0.4144[/C][C]0.339657[/C][/ROW]
[ROW][C]27[/C][C]0.00487[/C][C]0.0533[/C][C]0.478773[/C][/ROW]
[ROW][C]28[/C][C]-0.077599[/C][C]-0.8501[/C][C]0.198494[/C][/ROW]
[ROW][C]29[/C][C]-0.006141[/C][C]-0.0673[/C][C]0.47324[/C][/ROW]
[ROW][C]30[/C][C]0.020451[/C][C]0.224[/C][C]0.411558[/C][/ROW]
[ROW][C]31[/C][C]-0.058166[/C][C]-0.6372[/C][C]0.26261[/C][/ROW]
[ROW][C]32[/C][C]-0.019195[/C][C]-0.2103[/C][C]0.416907[/C][/ROW]
[ROW][C]33[/C][C]-0.025679[/C][C]-0.2813[/C][C]0.389481[/C][/ROW]
[ROW][C]34[/C][C]0.008117[/C][C]0.0889[/C][C]0.464646[/C][/ROW]
[ROW][C]35[/C][C]-0.006417[/C][C]-0.0703[/C][C]0.472036[/C][/ROW]
[ROW][C]36[/C][C]0.008105[/C][C]0.0888[/C][C]0.4647[/C][/ROW]
[ROW][C]37[/C][C]0.003032[/C][C]0.0332[/C][C]0.486779[/C][/ROW]
[ROW][C]38[/C][C]-0.041409[/C][C]-0.4536[/C][C]0.325464[/C][/ROW]
[ROW][C]39[/C][C]-0.014608[/C][C]-0.16[/C][C]0.436565[/C][/ROW]
[ROW][C]40[/C][C]-0.103202[/C][C]-1.1305[/C][C]0.130256[/C][/ROW]
[ROW][C]41[/C][C]0.029218[/C][C]0.3201[/C][C]0.374738[/C][/ROW]
[ROW][C]42[/C][C]-0.040008[/C][C]-0.4383[/C][C]0.33099[/C][/ROW]
[ROW][C]43[/C][C]-0.014788[/C][C]-0.162[/C][C]0.435789[/C][/ROW]
[ROW][C]44[/C][C]0.060018[/C][C]0.6575[/C][C]0.256071[/C][/ROW]
[ROW][C]45[/C][C]0.020392[/C][C]0.2234[/C][C]0.411807[/C][/ROW]
[ROW][C]46[/C][C]0.036967[/C][C]0.405[/C][C]0.343116[/C][/ROW]
[ROW][C]47[/C][C]-0.05369[/C][C]-0.5881[/C][C]0.278771[/C][/ROW]
[ROW][C]48[/C][C]0.00894[/C][C]0.0979[/C][C]0.461072[/C][/ROW]
[/TABLE]
Source: https://freestatistics.org/blog/index.php?pk=123627&T=2

Globally Unique Identifier (entire table): ba.freestatistics.org/blog/index.php?pk=123627&T=2

As an alternative you can also use a QR Code:  

The GUIDs for individual cells are displayed in the table below:

Partial Autocorrelation Function
Time lag kPACF(k)T-STATP-value
10.95462910.45740
2-0.057233-0.6270.265941
30.2431392.66350.004398
40.2736072.99720.001656
50.1454181.5930.056898
60.1172211.28410.100792
7-0.276408-3.02790.001508
8-0.07425-0.81340.208809
9-0.236704-2.5930.005349
100.1195451.30960.096425
110.2196442.40610.008825
120.0230970.2530.400347
13-0.440289-4.82312e-06
140.0335520.36750.35693
150.0438720.48060.315839
16-0.060549-0.66330.254211
17-0.044873-0.49160.311966
180.0004270.00470.498137
190.0068540.07510.470136
20-0.051061-0.55930.288485
21-0.078049-0.8550.197132
22-0.008934-0.09790.4611
23-0.036655-0.40150.344372
240.0033240.03640.485506
25-0.032011-0.35070.363229
26-0.03783-0.41440.339657
270.004870.05330.478773
28-0.077599-0.85010.198494
29-0.006141-0.06730.47324
300.0204510.2240.411558
31-0.058166-0.63720.26261
32-0.019195-0.21030.416907
33-0.025679-0.28130.389481
340.0081170.08890.464646
35-0.006417-0.07030.472036
360.0081050.08880.4647
370.0030320.03320.486779
38-0.041409-0.45360.325464
39-0.014608-0.160.436565
40-0.103202-1.13050.130256
410.0292180.32010.374738
42-0.040008-0.43830.33099
43-0.014788-0.1620.435789
440.0600180.65750.256071
450.0203920.22340.411807
460.0369670.4050.343116
47-0.05369-0.58810.278771
480.008940.09790.461072


Parameters (Session):
par1 = 48 ; par2 = 0.0 ; par3 = 0 ; par4 = 0 ; par5 = 12 ; par6 = White Noise ; par7 = 0.95 ;
Parameters (R input):
par1 = 48 ; par2 = 0.0 ; par3 = 0 ; par4 = 0 ; par5 = 12 ; par6 = White Noise ; par7 = 0.95 ; par8 = ;
R code (references can be found in the software module):
if (par1 == 'Default') {
par1 = 10*log10(length(x))
} else {
par1 <- as.numeric(par1)
}
par2 <- as.numeric(par2)
par3 <- as.numeric(par3)
par4 <- as.numeric(par4)
par5 <- as.numeric(par5)
if (par6 == 'White Noise') par6 <- 'white' else par6 <- 'ma'
par7 <- as.numeric(par7)
if (par8 != '') par8 <- as.numeric(par8)
ox <- x
if (par8 == '') {
if (par2 == 0) {
x <- log(x)
} else {
x <- (x ^ par2 - 1) / par2
}
} else {
x <- log(x,base=par8)
}
if (par3 > 0) x <- diff(x,lag=1,difference=par3)
if (par4 > 0) x <- diff(x,lag=par5,difference=par4)
bitmap(file='picts.png')
op <- par(mfrow=c(2,1))
plot(ox,type='l',main='Original Time Series',xlab='time',ylab='value')
if (par8=='') {
mytitle <- paste('Working Time Series (lambda=',par2,', d=',par3,', D=',par4,')',sep='')
mysub <- paste('(lambda=',par2,', d=',par3,', D=',par4,', CI=', par7, ', CI type=',par6,')',sep='')
} else {
mytitle <- paste('Working Time Series (base=',par8,', d=',par3,', D=',par4,')',sep='')
mysub <- paste('(base=',par8,', d=',par3,', D=',par4,', CI=', par7, ', CI type=',par6,')',sep='')
}
plot(x,type='l', main=mytitle,xlab='time',ylab='value')
par(op)
dev.off()
bitmap(file='pic1.png')
racf <- acf(x, par1, main='Autocorrelation', xlab='time lag', ylab='ACF', ci.type=par6, ci=par7, sub=mysub)
dev.off()
bitmap(file='pic2.png')
rpacf <- pacf(x,par1,main='Partial Autocorrelation',xlab='lags',ylab='PACF',sub=mysub)
dev.off()
(myacf <- c(racf$acf))
(mypacf <- c(rpacf$acf))
lengthx <- length(x)
sqrtn <- sqrt(lengthx)
load(file='createtable')
a<-table.start()
a<-table.row.start(a)
a<-table.element(a,'Autocorrelation Function',4,TRUE)
a<-table.row.end(a)
a<-table.row.start(a)
a<-table.element(a,'Time lag k',header=TRUE)
a<-table.element(a,hyperlink('basics.htm','ACF(k)','click here for more information about the Autocorrelation Function'),header=TRUE)
a<-table.element(a,'T-STAT',header=TRUE)
a<-table.element(a,'P-value',header=TRUE)
a<-table.row.end(a)
for (i in 2:(par1+1)) {
a<-table.row.start(a)
a<-table.element(a,i-1,header=TRUE)
a<-table.element(a,round(myacf[i],6))
mytstat <- myacf[i]*sqrtn
a<-table.element(a,round(mytstat,4))
a<-table.element(a,round(1-pt(abs(mytstat),lengthx),6))
a<-table.row.end(a)
}
a<-table.end(a)
table.save(a,file='mytable.tab')
a<-table.start()
a<-table.row.start(a)
a<-table.element(a,'Partial Autocorrelation Function',4,TRUE)
a<-table.row.end(a)
a<-table.row.start(a)
a<-table.element(a,'Time lag k',header=TRUE)
a<-table.element(a,hyperlink('basics.htm','PACF(k)','click here for more information about the Partial Autocorrelation Function'),header=TRUE)
a<-table.element(a,'T-STAT',header=TRUE)
a<-table.element(a,'P-value',header=TRUE)
a<-table.row.end(a)
for (i in 1:par1) {
a<-table.row.start(a)
a<-table.element(a,i,header=TRUE)
a<-table.element(a,round(mypacf[i],6))
mytstat <- mypacf[i]*sqrtn
a<-table.element(a,round(mytstat,4))
a<-table.element(a,round(1-pt(abs(mytstat),lengthx),6))
a<-table.row.end(a)
}
a<-table.end(a)
table.save(a,file='mytable1.tab')