Free Statistics

of Irreproducible Research!

Author's title

Author*The author of this computation has been verified*
R Software Modulerwasp_exponentialsmoothing.wasp
Title produced by softwareExponential Smoothing
Date of computationThu, 01 Dec 2011 15:56:13 -0500
Cite this page as followsStatistical Computations at FreeStatistics.org, Office for Research Development and Education, URL https://freestatistics.org/blog/index.php?v=date/2011/Dec/01/t1322773014dq9dqozegy14frx.htm/, Retrieved Thu, 31 Oct 2024 23:05:52 +0000
Statistical Computations at FreeStatistics.org, Office for Research Development and Education, URL https://freestatistics.org/blog/index.php?pk=149996, Retrieved Thu, 31 Oct 2024 23:05:52 +0000
QR Codes:

Original text written by user:
IsPrivate?No (this computation is public)
User-defined keywords
Estimated Impact200
Family? (F = Feedback message, R = changed R code, M = changed R Module, P = changed Parameters, D = changed Data)
-     [Exponential Smoothing] [HPC Retail Sales] [2008-03-10 17:56:43] [74be16979710d4c4e7c6647856088456]
-   PD  [Exponential Smoothing] [multiplicative ho...] [2008-05-08 22:00:10] [74be16979710d4c4e7c6647856088456]
-  MPD    [Exponential Smoothing] [Workshop 8 - Expo...] [2010-11-30 08:26:52] [1429a1a14191a86916b95357f6de790b]
- R           [Exponential Smoothing] [Exponential Smoot...] [2011-12-01 20:56:13] [ef8d8c90df4ff8d053d0205bd6ba250c] [Current]
Feedback Forum

Post a new message
Dataseries X:
9700
9081
9084
9743
8587
9731
9563
9998
9437
10038
9918
9252
9737
9035
9133
9487
8700
9627
8947
9283
8829
9947
9628
9318
9605
8640
9214
9567
8547
9185
9470
9123
9278
10170
9434
9655
9429
8739
9552
9687
9019
9672
9206
9069
9788
10312
10105
9863
9656
9295
9946
9701
9049
10190
9706
9765
9893
9994
10433
10073
10112
9266
9820
10097
9115
10411
9678
10408
10153
10368
10581
10597
10680
9738
9556


Summary of computational transaction
Raw Inputview raw input (R code)
Raw Outputview raw output of R engine
Computing time2 seconds
R Server'Gertrude Mary Cox' @ cox.wessa.net

\begin{tabular}{lllllllll}
\hline
Summary of computational transaction \tabularnewline
Raw Input & view raw input (R code)  \tabularnewline
Raw Output & view raw output of R engine  \tabularnewline
Computing time & 2 seconds \tabularnewline
R Server & 'Gertrude Mary Cox' @ cox.wessa.net \tabularnewline
\hline
\end{tabular}
%Source: https://freestatistics.org/blog/index.php?pk=149996&T=0

[TABLE]
[ROW][C]Summary of computational transaction[/C][/ROW]
[ROW][C]Raw Input[/C][C]view raw input (R code) [/C][/ROW]
[ROW][C]Raw Output[/C][C]view raw output of R engine [/C][/ROW]
[ROW][C]Computing time[/C][C]2 seconds[/C][/ROW]
[ROW][C]R Server[/C][C]'Gertrude Mary Cox' @ cox.wessa.net[/C][/ROW]
[/TABLE]
Source: https://freestatistics.org/blog/index.php?pk=149996&T=0

Globally Unique Identifier (entire table): ba.freestatistics.org/blog/index.php?pk=149996&T=0

As an alternative you can also use a QR Code:  

The GUIDs for individual cells are displayed in the table below:

Summary of computational transaction
Raw Inputview raw input (R code)
Raw Outputview raw output of R engine
Computing time2 seconds
R Server'Gertrude Mary Cox' @ cox.wessa.net


Estimated Parameters of Exponential Smoothing
ParameterValue
alpha0.118633222491737
beta0.177842898057947
gamma0.593783465809374

\begin{tabular}{lllllllll}
\hline
Estimated Parameters of Exponential Smoothing \tabularnewline
Parameter & Value \tabularnewline
alpha & 0.118633222491737 \tabularnewline
beta & 0.177842898057947 \tabularnewline
gamma & 0.593783465809374 \tabularnewline
\hline
\end{tabular}
%Source: https://freestatistics.org/blog/index.php?pk=149996&T=1

[TABLE]
[ROW][C]Estimated Parameters of Exponential Smoothing[/C][/ROW]
[ROW][C]Parameter[/C][C]Value[/C][/ROW]
[ROW][C]alpha[/C][C]0.118633222491737[/C][/ROW]
[ROW][C]beta[/C][C]0.177842898057947[/C][/ROW]
[ROW][C]gamma[/C][C]0.593783465809374[/C][/ROW]
[/TABLE]
Source: https://freestatistics.org/blog/index.php?pk=149996&T=1

Globally Unique Identifier (entire table): ba.freestatistics.org/blog/index.php?pk=149996&T=1

As an alternative you can also use a QR Code:  

The GUIDs for individual cells are displayed in the table below:

Estimated Parameters of Exponential Smoothing
ParameterValue
alpha0.118633222491737
beta0.177842898057947
gamma0.593783465809374


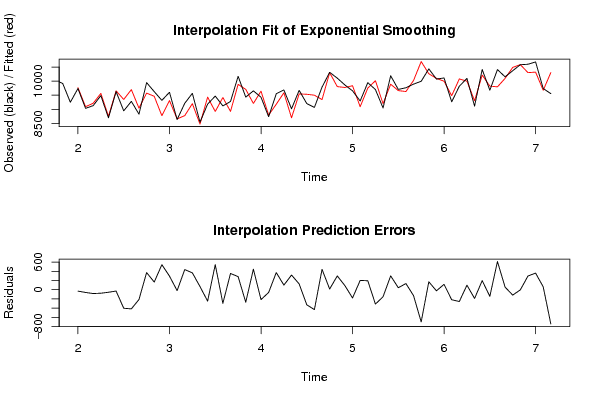
Interpolation Forecasts of Exponential Smoothing
tObservedFittedResiduals
1397379768.09802350427-31.0980235042716
1490359094.82069242711-59.8206924271108
1591339216.54046372292-83.5404637229203
1694879563.68373905259-76.6837390525943
1787008755.77257036396-55.7725703639553
1896279656.62380040276-29.62380040276
1989479350.24380475784-403.243804757836
2092839699.78239553172-416.782395531722
2188299042.42155295859-213.421552958589
2299479575.43327830414371.566721695855
2396289462.01672409347165.983275906532
2493188775.3797376699542.6202623301
2596059309.97278290563295.02721709437
2686408661.11902781689-21.1190278168924
2792148776.5991422725437.4008577275
2895679201.70519948741365.294800512585
2985478479.069367336967.9306326630958
3091859432.78885628248-247.788856282479
3194708924.90192533848545.098074661517
3291239419.77362093571-296.773620935714
3392788925.52238256396352.477617436036
34101709886.20179988942283.798200110577
3594349707.3158755727-273.315875572704
3696559208.93777542992446.06222457008
3794299643.72781956204-214.72781956204
3887398799.42061988547-60.4206198854663
3995529179.84407265267372.155927347334
4096879587.7408618321999.2591381678085
4190198700.57566008173318.424339918272
4296729546.72216589018125.277834109822
4392069533.85368355076-327.853683550757
4490699501.97079455157-432.970794551573
4597889345.86084071458442.139159285423
461031210297.64501435414.3549856459813
47101059805.95946624617299.040533753827
4898639774.7634805128388.2365194871691
4996569836.53709924596-180.537099245963
5092959093.01482721357201.985172786433
5199469752.46311858959193.536881410406
52970110014.0928950335-313.092895033498
5390499201.74857262885-152.748572628851
54101909890.01737584565299.982624154345
5597069663.5188578280142.4811421719933
5697659631.15772151834133.842278481663
57989310022.8300650906-129.830065090609
58999410693.3737308994-699.373730899397
591043310261.4366175685171.563382431515
601007310097.5384434741-24.5384434740972
61101129995.63683516032116.363164839684
6292669484.15430846813-218.154308468131
63982010077.1025414293-257.102541429251
64100979998.3875218282798.6124781717281
6591159305.74224179498-190.742241794984
661041110212.5772925249198.422707475118
6796789823.26733998686-145.26733998686
68104089796.48292855531611.517071444689
691015310096.947740160656.0522598394018
701036810485.5143429505-117.514342950461
711058110584.7149952168-3.71499521678197
721059710300.0096105431296.99038945692
731068010319.3899927215360.610007278467
7497389676.3680764090661.6319235909414
75955610302.5795309439-746.579530943922

\begin{tabular}{lllllllll}
\hline
Interpolation Forecasts of Exponential Smoothing \tabularnewline
t & Observed & Fitted & Residuals \tabularnewline
13 & 9737 & 9768.09802350427 & -31.0980235042716 \tabularnewline
14 & 9035 & 9094.82069242711 & -59.8206924271108 \tabularnewline
15 & 9133 & 9216.54046372292 & -83.5404637229203 \tabularnewline
16 & 9487 & 9563.68373905259 & -76.6837390525943 \tabularnewline
17 & 8700 & 8755.77257036396 & -55.7725703639553 \tabularnewline
18 & 9627 & 9656.62380040276 & -29.62380040276 \tabularnewline
19 & 8947 & 9350.24380475784 & -403.243804757836 \tabularnewline
20 & 9283 & 9699.78239553172 & -416.782395531722 \tabularnewline
21 & 8829 & 9042.42155295859 & -213.421552958589 \tabularnewline
22 & 9947 & 9575.43327830414 & 371.566721695855 \tabularnewline
23 & 9628 & 9462.01672409347 & 165.983275906532 \tabularnewline
24 & 9318 & 8775.3797376699 & 542.6202623301 \tabularnewline
25 & 9605 & 9309.97278290563 & 295.02721709437 \tabularnewline
26 & 8640 & 8661.11902781689 & -21.1190278168924 \tabularnewline
27 & 9214 & 8776.5991422725 & 437.4008577275 \tabularnewline
28 & 9567 & 9201.70519948741 & 365.294800512585 \tabularnewline
29 & 8547 & 8479.0693673369 & 67.9306326630958 \tabularnewline
30 & 9185 & 9432.78885628248 & -247.788856282479 \tabularnewline
31 & 9470 & 8924.90192533848 & 545.098074661517 \tabularnewline
32 & 9123 & 9419.77362093571 & -296.773620935714 \tabularnewline
33 & 9278 & 8925.52238256396 & 352.477617436036 \tabularnewline
34 & 10170 & 9886.20179988942 & 283.798200110577 \tabularnewline
35 & 9434 & 9707.3158755727 & -273.315875572704 \tabularnewline
36 & 9655 & 9208.93777542992 & 446.06222457008 \tabularnewline
37 & 9429 & 9643.72781956204 & -214.72781956204 \tabularnewline
38 & 8739 & 8799.42061988547 & -60.4206198854663 \tabularnewline
39 & 9552 & 9179.84407265267 & 372.155927347334 \tabularnewline
40 & 9687 & 9587.74086183219 & 99.2591381678085 \tabularnewline
41 & 9019 & 8700.57566008173 & 318.424339918272 \tabularnewline
42 & 9672 & 9546.72216589018 & 125.277834109822 \tabularnewline
43 & 9206 & 9533.85368355076 & -327.853683550757 \tabularnewline
44 & 9069 & 9501.97079455157 & -432.970794551573 \tabularnewline
45 & 9788 & 9345.86084071458 & 442.139159285423 \tabularnewline
46 & 10312 & 10297.645014354 & 14.3549856459813 \tabularnewline
47 & 10105 & 9805.95946624617 & 299.040533753827 \tabularnewline
48 & 9863 & 9774.76348051283 & 88.2365194871691 \tabularnewline
49 & 9656 & 9836.53709924596 & -180.537099245963 \tabularnewline
50 & 9295 & 9093.01482721357 & 201.985172786433 \tabularnewline
51 & 9946 & 9752.46311858959 & 193.536881410406 \tabularnewline
52 & 9701 & 10014.0928950335 & -313.092895033498 \tabularnewline
53 & 9049 & 9201.74857262885 & -152.748572628851 \tabularnewline
54 & 10190 & 9890.01737584565 & 299.982624154345 \tabularnewline
55 & 9706 & 9663.51885782801 & 42.4811421719933 \tabularnewline
56 & 9765 & 9631.15772151834 & 133.842278481663 \tabularnewline
57 & 9893 & 10022.8300650906 & -129.830065090609 \tabularnewline
58 & 9994 & 10693.3737308994 & -699.373730899397 \tabularnewline
59 & 10433 & 10261.4366175685 & 171.563382431515 \tabularnewline
60 & 10073 & 10097.5384434741 & -24.5384434740972 \tabularnewline
61 & 10112 & 9995.63683516032 & 116.363164839684 \tabularnewline
62 & 9266 & 9484.15430846813 & -218.154308468131 \tabularnewline
63 & 9820 & 10077.1025414293 & -257.102541429251 \tabularnewline
64 & 10097 & 9998.38752182827 & 98.6124781717281 \tabularnewline
65 & 9115 & 9305.74224179498 & -190.742241794984 \tabularnewline
66 & 10411 & 10212.5772925249 & 198.422707475118 \tabularnewline
67 & 9678 & 9823.26733998686 & -145.26733998686 \tabularnewline
68 & 10408 & 9796.48292855531 & 611.517071444689 \tabularnewline
69 & 10153 & 10096.9477401606 & 56.0522598394018 \tabularnewline
70 & 10368 & 10485.5143429505 & -117.514342950461 \tabularnewline
71 & 10581 & 10584.7149952168 & -3.71499521678197 \tabularnewline
72 & 10597 & 10300.0096105431 & 296.99038945692 \tabularnewline
73 & 10680 & 10319.3899927215 & 360.610007278467 \tabularnewline
74 & 9738 & 9676.36807640906 & 61.6319235909414 \tabularnewline
75 & 9556 & 10302.5795309439 & -746.579530943922 \tabularnewline
\hline
\end{tabular}
%Source: https://freestatistics.org/blog/index.php?pk=149996&T=2

[TABLE]
[ROW][C]Interpolation Forecasts of Exponential Smoothing[/C][/ROW]
[ROW][C]t[/C][C]Observed[/C][C]Fitted[/C][C]Residuals[/C][/ROW]
[ROW][C]13[/C][C]9737[/C][C]9768.09802350427[/C][C]-31.0980235042716[/C][/ROW]
[ROW][C]14[/C][C]9035[/C][C]9094.82069242711[/C][C]-59.8206924271108[/C][/ROW]
[ROW][C]15[/C][C]9133[/C][C]9216.54046372292[/C][C]-83.5404637229203[/C][/ROW]
[ROW][C]16[/C][C]9487[/C][C]9563.68373905259[/C][C]-76.6837390525943[/C][/ROW]
[ROW][C]17[/C][C]8700[/C][C]8755.77257036396[/C][C]-55.7725703639553[/C][/ROW]
[ROW][C]18[/C][C]9627[/C][C]9656.62380040276[/C][C]-29.62380040276[/C][/ROW]
[ROW][C]19[/C][C]8947[/C][C]9350.24380475784[/C][C]-403.243804757836[/C][/ROW]
[ROW][C]20[/C][C]9283[/C][C]9699.78239553172[/C][C]-416.782395531722[/C][/ROW]
[ROW][C]21[/C][C]8829[/C][C]9042.42155295859[/C][C]-213.421552958589[/C][/ROW]
[ROW][C]22[/C][C]9947[/C][C]9575.43327830414[/C][C]371.566721695855[/C][/ROW]
[ROW][C]23[/C][C]9628[/C][C]9462.01672409347[/C][C]165.983275906532[/C][/ROW]
[ROW][C]24[/C][C]9318[/C][C]8775.3797376699[/C][C]542.6202623301[/C][/ROW]
[ROW][C]25[/C][C]9605[/C][C]9309.97278290563[/C][C]295.02721709437[/C][/ROW]
[ROW][C]26[/C][C]8640[/C][C]8661.11902781689[/C][C]-21.1190278168924[/C][/ROW]
[ROW][C]27[/C][C]9214[/C][C]8776.5991422725[/C][C]437.4008577275[/C][/ROW]
[ROW][C]28[/C][C]9567[/C][C]9201.70519948741[/C][C]365.294800512585[/C][/ROW]
[ROW][C]29[/C][C]8547[/C][C]8479.0693673369[/C][C]67.9306326630958[/C][/ROW]
[ROW][C]30[/C][C]9185[/C][C]9432.78885628248[/C][C]-247.788856282479[/C][/ROW]
[ROW][C]31[/C][C]9470[/C][C]8924.90192533848[/C][C]545.098074661517[/C][/ROW]
[ROW][C]32[/C][C]9123[/C][C]9419.77362093571[/C][C]-296.773620935714[/C][/ROW]
[ROW][C]33[/C][C]9278[/C][C]8925.52238256396[/C][C]352.477617436036[/C][/ROW]
[ROW][C]34[/C][C]10170[/C][C]9886.20179988942[/C][C]283.798200110577[/C][/ROW]
[ROW][C]35[/C][C]9434[/C][C]9707.3158755727[/C][C]-273.315875572704[/C][/ROW]
[ROW][C]36[/C][C]9655[/C][C]9208.93777542992[/C][C]446.06222457008[/C][/ROW]
[ROW][C]37[/C][C]9429[/C][C]9643.72781956204[/C][C]-214.72781956204[/C][/ROW]
[ROW][C]38[/C][C]8739[/C][C]8799.42061988547[/C][C]-60.4206198854663[/C][/ROW]
[ROW][C]39[/C][C]9552[/C][C]9179.84407265267[/C][C]372.155927347334[/C][/ROW]
[ROW][C]40[/C][C]9687[/C][C]9587.74086183219[/C][C]99.2591381678085[/C][/ROW]
[ROW][C]41[/C][C]9019[/C][C]8700.57566008173[/C][C]318.424339918272[/C][/ROW]
[ROW][C]42[/C][C]9672[/C][C]9546.72216589018[/C][C]125.277834109822[/C][/ROW]
[ROW][C]43[/C][C]9206[/C][C]9533.85368355076[/C][C]-327.853683550757[/C][/ROW]
[ROW][C]44[/C][C]9069[/C][C]9501.97079455157[/C][C]-432.970794551573[/C][/ROW]
[ROW][C]45[/C][C]9788[/C][C]9345.86084071458[/C][C]442.139159285423[/C][/ROW]
[ROW][C]46[/C][C]10312[/C][C]10297.645014354[/C][C]14.3549856459813[/C][/ROW]
[ROW][C]47[/C][C]10105[/C][C]9805.95946624617[/C][C]299.040533753827[/C][/ROW]
[ROW][C]48[/C][C]9863[/C][C]9774.76348051283[/C][C]88.2365194871691[/C][/ROW]
[ROW][C]49[/C][C]9656[/C][C]9836.53709924596[/C][C]-180.537099245963[/C][/ROW]
[ROW][C]50[/C][C]9295[/C][C]9093.01482721357[/C][C]201.985172786433[/C][/ROW]
[ROW][C]51[/C][C]9946[/C][C]9752.46311858959[/C][C]193.536881410406[/C][/ROW]
[ROW][C]52[/C][C]9701[/C][C]10014.0928950335[/C][C]-313.092895033498[/C][/ROW]
[ROW][C]53[/C][C]9049[/C][C]9201.74857262885[/C][C]-152.748572628851[/C][/ROW]
[ROW][C]54[/C][C]10190[/C][C]9890.01737584565[/C][C]299.982624154345[/C][/ROW]
[ROW][C]55[/C][C]9706[/C][C]9663.51885782801[/C][C]42.4811421719933[/C][/ROW]
[ROW][C]56[/C][C]9765[/C][C]9631.15772151834[/C][C]133.842278481663[/C][/ROW]
[ROW][C]57[/C][C]9893[/C][C]10022.8300650906[/C][C]-129.830065090609[/C][/ROW]
[ROW][C]58[/C][C]9994[/C][C]10693.3737308994[/C][C]-699.373730899397[/C][/ROW]
[ROW][C]59[/C][C]10433[/C][C]10261.4366175685[/C][C]171.563382431515[/C][/ROW]
[ROW][C]60[/C][C]10073[/C][C]10097.5384434741[/C][C]-24.5384434740972[/C][/ROW]
[ROW][C]61[/C][C]10112[/C][C]9995.63683516032[/C][C]116.363164839684[/C][/ROW]
[ROW][C]62[/C][C]9266[/C][C]9484.15430846813[/C][C]-218.154308468131[/C][/ROW]
[ROW][C]63[/C][C]9820[/C][C]10077.1025414293[/C][C]-257.102541429251[/C][/ROW]
[ROW][C]64[/C][C]10097[/C][C]9998.38752182827[/C][C]98.6124781717281[/C][/ROW]
[ROW][C]65[/C][C]9115[/C][C]9305.74224179498[/C][C]-190.742241794984[/C][/ROW]
[ROW][C]66[/C][C]10411[/C][C]10212.5772925249[/C][C]198.422707475118[/C][/ROW]
[ROW][C]67[/C][C]9678[/C][C]9823.26733998686[/C][C]-145.26733998686[/C][/ROW]
[ROW][C]68[/C][C]10408[/C][C]9796.48292855531[/C][C]611.517071444689[/C][/ROW]
[ROW][C]69[/C][C]10153[/C][C]10096.9477401606[/C][C]56.0522598394018[/C][/ROW]
[ROW][C]70[/C][C]10368[/C][C]10485.5143429505[/C][C]-117.514342950461[/C][/ROW]
[ROW][C]71[/C][C]10581[/C][C]10584.7149952168[/C][C]-3.71499521678197[/C][/ROW]
[ROW][C]72[/C][C]10597[/C][C]10300.0096105431[/C][C]296.99038945692[/C][/ROW]
[ROW][C]73[/C][C]10680[/C][C]10319.3899927215[/C][C]360.610007278467[/C][/ROW]
[ROW][C]74[/C][C]9738[/C][C]9676.36807640906[/C][C]61.6319235909414[/C][/ROW]
[ROW][C]75[/C][C]9556[/C][C]10302.5795309439[/C][C]-746.579530943922[/C][/ROW]
[/TABLE]
Source: https://freestatistics.org/blog/index.php?pk=149996&T=2

Globally Unique Identifier (entire table): ba.freestatistics.org/blog/index.php?pk=149996&T=2

As an alternative you can also use a QR Code:  

The GUIDs for individual cells are displayed in the table below:

Interpolation Forecasts of Exponential Smoothing
tObservedFittedResiduals
1397379768.09802350427-31.0980235042716
1490359094.82069242711-59.8206924271108
1591339216.54046372292-83.5404637229203
1694879563.68373905259-76.6837390525943
1787008755.77257036396-55.7725703639553
1896279656.62380040276-29.62380040276
1989479350.24380475784-403.243804757836
2092839699.78239553172-416.782395531722
2188299042.42155295859-213.421552958589
2299479575.43327830414371.566721695855
2396289462.01672409347165.983275906532
2493188775.3797376699542.6202623301
2596059309.97278290563295.02721709437
2686408661.11902781689-21.1190278168924
2792148776.5991422725437.4008577275
2895679201.70519948741365.294800512585
2985478479.069367336967.9306326630958
3091859432.78885628248-247.788856282479
3194708924.90192533848545.098074661517
3291239419.77362093571-296.773620935714
3392788925.52238256396352.477617436036
34101709886.20179988942283.798200110577
3594349707.3158755727-273.315875572704
3696559208.93777542992446.06222457008
3794299643.72781956204-214.72781956204
3887398799.42061988547-60.4206198854663
3995529179.84407265267372.155927347334
4096879587.7408618321999.2591381678085
4190198700.57566008173318.424339918272
4296729546.72216589018125.277834109822
4392069533.85368355076-327.853683550757
4490699501.97079455157-432.970794551573
4597889345.86084071458442.139159285423
461031210297.64501435414.3549856459813
47101059805.95946624617299.040533753827
4898639774.7634805128388.2365194871691
4996569836.53709924596-180.537099245963
5092959093.01482721357201.985172786433
5199469752.46311858959193.536881410406
52970110014.0928950335-313.092895033498
5390499201.74857262885-152.748572628851
54101909890.01737584565299.982624154345
5597069663.5188578280142.4811421719933
5697659631.15772151834133.842278481663
57989310022.8300650906-129.830065090609
58999410693.3737308994-699.373730899397
591043310261.4366175685171.563382431515
601007310097.5384434741-24.5384434740972
61101129995.63683516032116.363164839684
6292669484.15430846813-218.154308468131
63982010077.1025414293-257.102541429251
64100979998.3875218282798.6124781717281
6591159305.74224179498-190.742241794984
661041110212.5772925249198.422707475118
6796789823.26733998686-145.26733998686
68104089796.48292855531611.517071444689
691015310096.947740160656.0522598394018
701036810485.5143429505-117.514342950461
711058110584.7149952168-3.71499521678197
721059710300.0096105431296.99038945692
731068010319.3899927215360.610007278467
7497389676.3680764090661.6319235909414
75955610302.5795309439-746.579530943922


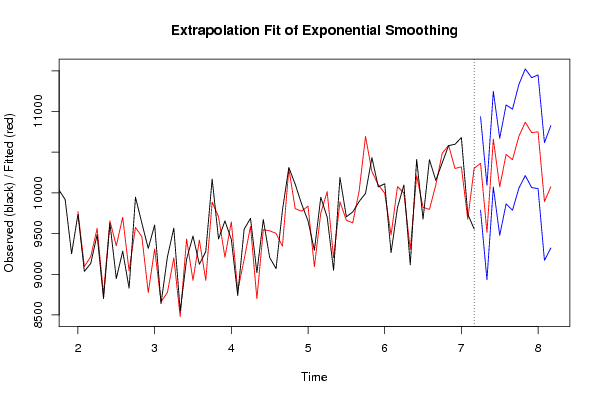
Extrapolation Forecasts of Exponential Smoothing
tForecast95% Lower Bound95% Upper Bound
7610362.08400429879787.7649000434610936.403108554
779514.355744844958934.4570012110110094.2544884789
7810659.556369010410072.347474152411246.7652638684
7910074.72467916029478.292555400910671.1568029195
8010472.17987525739864.4569336414511079.9028168732
8110407.44884061229786.2438684121911028.6538128123
8210695.396580950510058.42699442811332.3661674729
8310867.438852322910212.362728109311522.5149765366
8410739.968678646710064.415064705111415.5222925883
8510750.567990178210052.164260747811448.9717196086
869893.847174684979170.2425691331810617.4517802368
8710074.02543693319322.9103340806310825.1405397856

\begin{tabular}{lllllllll}
\hline
Extrapolation Forecasts of Exponential Smoothing \tabularnewline
t & Forecast & 95% Lower Bound & 95% Upper Bound \tabularnewline
76 & 10362.0840042987 & 9787.76490004346 & 10936.403108554 \tabularnewline
77 & 9514.35574484495 & 8934.45700121101 & 10094.2544884789 \tabularnewline
78 & 10659.5563690104 & 10072.3474741524 & 11246.7652638684 \tabularnewline
79 & 10074.7246791602 & 9478.2925554009 & 10671.1568029195 \tabularnewline
80 & 10472.1798752573 & 9864.45693364145 & 11079.9028168732 \tabularnewline
81 & 10407.4488406122 & 9786.24386841219 & 11028.6538128123 \tabularnewline
82 & 10695.3965809505 & 10058.426994428 & 11332.3661674729 \tabularnewline
83 & 10867.4388523229 & 10212.3627281093 & 11522.5149765366 \tabularnewline
84 & 10739.9686786467 & 10064.4150647051 & 11415.5222925883 \tabularnewline
85 & 10750.5679901782 & 10052.1642607478 & 11448.9717196086 \tabularnewline
86 & 9893.84717468497 & 9170.24256913318 & 10617.4517802368 \tabularnewline
87 & 10074.0254369331 & 9322.91033408063 & 10825.1405397856 \tabularnewline
\hline
\end{tabular}
%Source: https://freestatistics.org/blog/index.php?pk=149996&T=3

[TABLE]
[ROW][C]Extrapolation Forecasts of Exponential Smoothing[/C][/ROW]
[ROW][C]t[/C][C]Forecast[/C][C]95% Lower Bound[/C][C]95% Upper Bound[/C][/ROW]
[ROW][C]76[/C][C]10362.0840042987[/C][C]9787.76490004346[/C][C]10936.403108554[/C][/ROW]
[ROW][C]77[/C][C]9514.35574484495[/C][C]8934.45700121101[/C][C]10094.2544884789[/C][/ROW]
[ROW][C]78[/C][C]10659.5563690104[/C][C]10072.3474741524[/C][C]11246.7652638684[/C][/ROW]
[ROW][C]79[/C][C]10074.7246791602[/C][C]9478.2925554009[/C][C]10671.1568029195[/C][/ROW]
[ROW][C]80[/C][C]10472.1798752573[/C][C]9864.45693364145[/C][C]11079.9028168732[/C][/ROW]
[ROW][C]81[/C][C]10407.4488406122[/C][C]9786.24386841219[/C][C]11028.6538128123[/C][/ROW]
[ROW][C]82[/C][C]10695.3965809505[/C][C]10058.426994428[/C][C]11332.3661674729[/C][/ROW]
[ROW][C]83[/C][C]10867.4388523229[/C][C]10212.3627281093[/C][C]11522.5149765366[/C][/ROW]
[ROW][C]84[/C][C]10739.9686786467[/C][C]10064.4150647051[/C][C]11415.5222925883[/C][/ROW]
[ROW][C]85[/C][C]10750.5679901782[/C][C]10052.1642607478[/C][C]11448.9717196086[/C][/ROW]
[ROW][C]86[/C][C]9893.84717468497[/C][C]9170.24256913318[/C][C]10617.4517802368[/C][/ROW]
[ROW][C]87[/C][C]10074.0254369331[/C][C]9322.91033408063[/C][C]10825.1405397856[/C][/ROW]
[/TABLE]
Source: https://freestatistics.org/blog/index.php?pk=149996&T=3

Globally Unique Identifier (entire table): ba.freestatistics.org/blog/index.php?pk=149996&T=3

As an alternative you can also use a QR Code:  

The GUIDs for individual cells are displayed in the table below:

Extrapolation Forecasts of Exponential Smoothing
tForecast95% Lower Bound95% Upper Bound
7610362.08400429879787.7649000434610936.403108554
779514.355744844958934.4570012110110094.2544884789
7810659.556369010410072.347474152411246.7652638684
7910074.72467916029478.292555400910671.1568029195
8010472.17987525739864.4569336414511079.9028168732
8110407.44884061229786.2438684121911028.6538128123
8210695.396580950510058.42699442811332.3661674729
8310867.438852322910212.362728109311522.5149765366
8410739.968678646710064.415064705111415.5222925883
8510750.567990178210052.164260747811448.9717196086
869893.847174684979170.2425691331810617.4517802368
8710074.02543693319322.9103340806310825.1405397856


Parameters (Session):
par1 = 12 ; par2 = Triple ; par3 = additive ;
Parameters (R input):
par1 = 12 ; par2 = Triple ; par3 = additive ;
R code (references can be found in the software module):
par1 <- as.numeric(par1)
if (par2 == 'Single') K <- 1
if (par2 == 'Double') K <- 2
if (par2 == 'Triple') K <- par1
nx <- length(x)
nxmK <- nx - K
x <- ts(x, frequency = par1)
if (par2 == 'Single') fit <- HoltWinters(x, gamma=F, beta=F)
if (par2 == 'Double') fit <- HoltWinters(x, gamma=F)
if (par2 == 'Triple') fit <- HoltWinters(x, seasonal=par3)
fit
myresid <- x - fit$fitted[,'xhat']
bitmap(file='test1.png')
op <- par(mfrow=c(2,1))
plot(fit,ylab='Observed (black) / Fitted (red)',main='Interpolation Fit of Exponential Smoothing')
plot(myresid,ylab='Residuals',main='Interpolation Prediction Errors')
par(op)
dev.off()
bitmap(file='test2.png')
p <- predict(fit, par1, prediction.interval=TRUE)
np <- length(p[,1])
plot(fit,p,ylab='Observed (black) / Fitted (red)',main='Extrapolation Fit of Exponential Smoothing')
dev.off()
bitmap(file='test3.png')
op <- par(mfrow = c(2,2))
acf(as.numeric(myresid),lag.max = nx/2,main='Residual ACF')
spectrum(myresid,main='Residals Periodogram')
cpgram(myresid,main='Residal Cumulative Periodogram')
qqnorm(myresid,main='Residual Normal QQ Plot')
qqline(myresid)
par(op)
dev.off()
load(file='createtable')
a<-table.start()
a<-table.row.start(a)
a<-table.element(a,'Estimated Parameters of Exponential Smoothing',2,TRUE)
a<-table.row.end(a)
a<-table.row.start(a)
a<-table.element(a,'Parameter',header=TRUE)
a<-table.element(a,'Value',header=TRUE)
a<-table.row.end(a)
a<-table.row.start(a)
a<-table.element(a,'alpha',header=TRUE)
a<-table.element(a,fit$alpha)
a<-table.row.end(a)
a<-table.row.start(a)
a<-table.element(a,'beta',header=TRUE)
a<-table.element(a,fit$beta)
a<-table.row.end(a)
a<-table.row.start(a)
a<-table.element(a,'gamma',header=TRUE)
a<-table.element(a,fit$gamma)
a<-table.row.end(a)
a<-table.end(a)
table.save(a,file='mytable.tab')
a<-table.start()
a<-table.row.start(a)
a<-table.element(a,'Interpolation Forecasts of Exponential Smoothing',4,TRUE)
a<-table.row.end(a)
a<-table.row.start(a)
a<-table.element(a,'t',header=TRUE)
a<-table.element(a,'Observed',header=TRUE)
a<-table.element(a,'Fitted',header=TRUE)
a<-table.element(a,'Residuals',header=TRUE)
a<-table.row.end(a)
for (i in 1:nxmK) {
a<-table.row.start(a)
a<-table.element(a,i+K,header=TRUE)
a<-table.element(a,x[i+K])
a<-table.element(a,fit$fitted[i,'xhat'])
a<-table.element(a,myresid[i])
a<-table.row.end(a)
}
a<-table.end(a)
table.save(a,file='mytable1.tab')
a<-table.start()
a<-table.row.start(a)
a<-table.element(a,'Extrapolation Forecasts of Exponential Smoothing',4,TRUE)
a<-table.row.end(a)
a<-table.row.start(a)
a<-table.element(a,'t',header=TRUE)
a<-table.element(a,'Forecast',header=TRUE)
a<-table.element(a,'95% Lower Bound',header=TRUE)
a<-table.element(a,'95% Upper Bound',header=TRUE)
a<-table.row.end(a)
for (i in 1:np) {
a<-table.row.start(a)
a<-table.element(a,nx+i,header=TRUE)
a<-table.element(a,p[i,'fit'])
a<-table.element(a,p[i,'lwr'])
a<-table.element(a,p[i,'upr'])
a<-table.row.end(a)
}
a<-table.end(a)
table.save(a,file='mytable2.tab')